
Abstract
Aims
To assess the potential clinical impact and cost-effectiveness of COVID-19 mRNA vaccines updated for fall 2023 in adults aged ≥18 years over a 1-year analytic time horizon (September 2023-August 2024).
Materials and methods
A compartmental Susceptible-Exposed-Infected-Recovered model was updated to reflect COVID-19 cases in summer 2023. The numbers of symptomatic infections, COVID-19–related hospitalizations and deaths, and costs and quality-adjusted life-years (QALYs) gained were calculated using a decision tree model. The incremental cost-effectiveness ratio (ICER) of a Moderna updated mRNA fall 2023 vaccine (Moderna Fall Campaign) was compared to no additional vaccination. Potential differences between the Moderna and the Pfizer-BioNTech fall 2023 vaccines were also examined.
Results
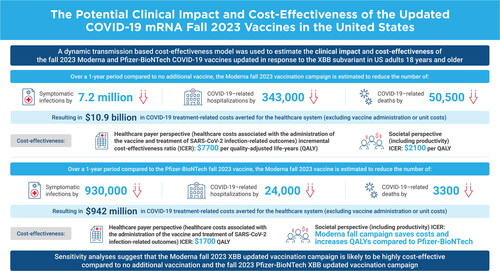
Base case results suggest that the Moderna Fall Campaign would decrease the expected 64.2 million symptomatic infections by 7.2 million (11%) to 57.0 million. COVID-19–related hospitalizations and deaths are expected to decline by 343,000 (-29%) and 50,500 (-33%), respectively. The Moderna Fall Campaign would increase QALYs by 740,880 and healthcare costs by $5.7 billion relative to no vaccine, yielding an ICER of $7700 per QALY gained. Using a societal cost perspective, the ICER is $2100. Sensitivity analyses suggest that vaccine effectiveness, COVID-19 incidence, hospitalization rates, and costs drive cost-effectiveness. With a relative vaccine effectiveness of 5.1% for infection and 9.8% for hospitalization for the Moderna vaccine versus the Pfizer-BioNTech vaccine, use of the Moderna vaccine is expected to prevent 24,000 more hospitalizations and 3300 more deaths than the Pfizer-BioNTech vaccine.
Limitations and conclusions
As COVID-19 becomes endemic, future incidence, including patterns of infection, are highly uncertain. The effectiveness of fall 2023 vaccines is unknown, and it is unclear when a new variant that evades natural or vaccine immunity will emerge. Despite these limitations, our model predicts the Moderna Fall Campaign vaccine is highly cost-effective across all sensitivity analyses.
Graphical abstract
Introduction
In May 2023, the World Health Organization (WHO) ended the COVID-19 global health emergency following 12 months of decreasing incidence of infections.Citation1 The US federal government also ended its public health emergency on May 11, 2023.Citation2 The WHO attributed the decrease in the risk of infection to increased levels of immunity achieved through both highly effective vaccines and previous infections. In the United States, for example, Jones et al. reported an increase in SARS-CoV-2 antibodies among blood donors at 68.4% from April 2021 to June 2021 to 96.4% from July 2022 to September 2022.Citation3 Among those tested in the latter time period, 22.6% had antibodies from a previous infection alone, 26.1% had antibodies from vaccination alone, and 47.7% had hybrid immunity.
The use of COVID-19 vaccines has been evolving throughout the pandemic. In the United States, the mRNA vaccines produced by Moderna and Pfizer-BioNTech are preferred, and a third protein subunit vaccine manufactured by Novavax is also available.Citation4 As SARS-CoV-2 evolved from the ancestral strain (Wuhan-Hu-1) into the Omicron variants that have circulated since January 2022,Citation5 the COVID-19 vaccines have been updated. New bivalent COVID-19 mRNA vaccines containing antigens to both the ancestral strain and the Omicron BA.4/BA.5 subvariants were developed. In September 2022, the Centers for Disease Control and Prevention (CDC) recommended that all individuals aged ≥6 months receive one dose of these bivalent vaccines.Citation6 By the end of January 2023, XBB subvariants had began to dominate globally, and initial studies reported that the bivalent COVID-19 vaccines have low effectiveness against these subvariants.Citation7,Citation8 Therefore, in May 2023, the WHO Technical Advisory Group on COVID-19 Vaccine Composition recommended that COVID-19 vaccines be updated once more to monovalent versions with an XBB subvariant. In the United States, in June 2023, the Vaccines and Related Biological Products Advisory Committee of the Food and Drug Administration specified that COVID-19 vaccines in the United States be updated to monovalent versions with the XBB.1.5 sublineage of Omicron.Citation9 As of the end of July 2023, XBB sublineages accounted for 98% of SARS-CoV-2 infections in the United States.Citation10
During the pandemic phase of COVID-19, the few formal economic evaluations conducted of the vaccines concluded that they were a cost-effective intervention.Citation11 Previously, we published an analysis of the potential clinical impact of the bivalent boosters in fall 2022 in the United States using a mathematical model of infection dynamics.Citation12 We did not conduct an economic assessment, and the incidence of SARS-CoV-2 infections has since declined. While the CDC continued to distribute free COVID-19 vaccines in May 2023, the funding of COVID-19 vaccines in the United States is transitioning from the pandemic procurement process to the standard processes for childhood and adult vaccines. Given these changes to the epidemiologic, clinical, and financial dimensions of COVID-19 vaccines, it is important to assess both the ongoing clinical and economic impact of additional COVID-19 doses. Specifically, it will be important to determine if the use of COVID-19 vaccines is still cost-effective from both a societal and a healthcare system perspective.
The objective of this analysis was to assess the potential clinical impact and cost-effectiveness of the mRNA COVID-19 vaccines updated for fall 2023 in people aged ≥18 years using a mathematical model. Outcomes were estimated both with and without a Moderna updated fall 2023 COVID-19 vaccine campaign. In addition, we explore the potential differences between the mRNA COVID-19 vaccines manufactured by Moderna and Pfizer-BioNTech. The formulation of these two mRNA COVID-19 vaccines differs in multiple points, such as dosage and delivery system (lipid nanoparticles), and observational studies have demonstrated that these differences impact vaccine effectiveness (VE).Citation13–18 Therefore, as an additional analysis, we compare the potential benefits of a fall 2023 vaccination campaign with the updated Moderna COVID-19 mRNA vaccine to one with the updated Pfizer-BioNTech COVID-19 mRNA vaccine.
Methods
Overview
For this analysis, two sets of comparisons were conducted across the 1-year analytic time horizon of September 2023 to August 2024. First, vaccination of individuals ≥18 years with the updated Moderna COVID-19 mRNA fall 2023 vaccine (Moderna Fall Campaign) was compared to no additional COVID-19 vaccination in fall 2023 (No Vaccine Fall Campaign). Second, the Moderna Fall Campaign was compared to vaccination of individuals ≥18 years with the updated Pfizer-BioNTech COVID-19 mRNA fall 2023 vaccine (Pfizer-BioNTech Fall Campaign).
A Susceptible-Exposed-Infected-Recovered (SEIR) model was used to estimate the total number of infections during the time horizon. A consequences decision tree was then used to calculate the numbers of symptomatic infections, COVID-19–related hospitalizations, COVID-19–related deaths, and associated costs and quality-adjusted life-years (QALYs) gained for each vaccination strategy. The incremental cost-effectiveness ratio (ICER) comparing the two vaccination strategies was calculated as the difference in costs between the Moderna Fall Campaign and the No Vaccine Fall Campaign divided by the difference in QALYs (incremental cost per QALY gained).
SEIR dynamic transmission model
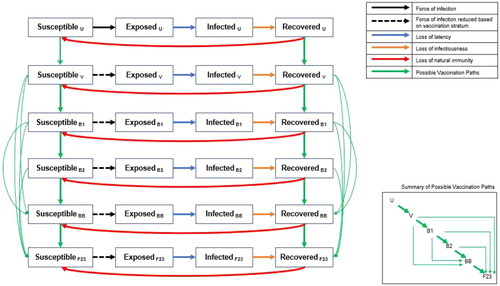
A previously developed compartmental SEIR model was updated to reflect the clinical and epidemiologic situation in the summer of 2023. The model has been previously described in detailCitation12; in the updated model, the SEIR compartments were stratified by vaccination status (). To accommodate changes since the summer of 2022, one more stratum was added to represent the fall 2023 vaccine. Individuals in the Susceptible (S) state moved to the Exposed (E) state based on the force (incidence) of infection, which was affected by the susceptible individual’s vaccination stratum. The Exposed (E) state represents an infection that is both asymptomatic and nontransmissible, and that lasts for an average of 3 days.Citation19 The Infected (I) state represents a contagious infection that may be clinically symptomatic or asymptomatic for an average of 7 days.Citation19,Citation20 Finally, individuals in the Recovered (R) states have natural immunity to infection, and the rate of movement back to the Susceptible (S) states represents the waning of natural immunity. Anyone who is in the S or R states may receive a vaccine. Once individuals have received their primary series, they move into the “Vaccinated” stratum. There, these individuals progress through the additional Booster 1 and Booster 2 strata over time as additional doses are received.
Figure 1. Model structure: compartments in the SEIR dynamic model of SARS-CoV-2 infection. Black arrows represent the movement between the susceptible and exposed compartments, which is driven by the force of infection. The dashed black arrows indicate that the force of infection is modified by vaccination compared to the same transition in the unvaccinated stratum. Each vaccine stratum is associated with a unique vaccine effectiveness estimate. The blue arrows represent the loss of latency, which means the infection becomes transmissible. The orange arrows represent the loss of infectiousness, which means the infection is cleared and natural immunity develops. The red arrows represent the loss of natural immunity following infection and transition back to the susceptible state. Loss of latency, loss of infectiousness, and loss of natural immunity are the same for all vaccine strata but can change over time. The green arrows represent the possible vaccination paths. The inset box is a stylized version that shows the possible vaccination paths more clearly (please see the Technical Appendix for the mathematical equations driving each transition). Abbreviations. B1, first booster; B2, second booster; BB, bivalent booster; F23, fall 2023 vaccine; u, unvaccinated; v, primary series vaccination.
Consistent with CDC policies, from September 2022 to August 2023, any person who had received at least their primary series could receive the bivalent mRNA vaccine irrespective of subsequent boosters. This analysis assumes that, after August 2023, individuals who had received at least their primary series were eligible to receive an updated COVID-19 mRNA fall 2023 vaccine, whether or not they had received monovalent or bivalent boosters. Differential equations that define the transitions in the model, and the associated parameter inputs, are provided in the Technical Appendix.
In the SEIR model, vaccination reduces the incidence of asymptomatic or symptomatic infection. Vaccination can also reduce the risk of hospitalization for someone with a symptomatic infection. Each day, newly vaccinated individuals are assigned the initial VE that is appropriate to the vaccine used and the variant that is circulating. The VE of previously vaccinated persons is reduced according to the waning rate. The average VE for a given day is calculated as a weighted average of the VE for the newly vaccinated individuals and the VE of those vaccinated in past days, weighted by the number of people in each of these groups. The VE against hospitalization (i.e. the reduction in the risk of hospitalization due to infection for vaccinated versus unvaccinated persons) is calculated for use in the consequences decision tree (see the Technical Appendix).
SEIR model time periods
The model simulation was run from the emergence of COVID-19 in January 2020 until August 2024, with a time step of 1 day. There are two time periods considered in the model simulation. The first is the “burn-in” (or “model calibration”) time period, which runs from model simulation until August 2023. The burn-in time period was used to estimate the residual protection from previously received vaccines and the proportion of individuals with natural immunity (in the R compartments) at the end of August 2023. The second is the analysis time period, which runs from September 2023 to August 2024 and aligns with the 1-year time horizon for the cost-effectiveness analysis. The analysis time period was used to project the incidence of COVID-19 and the potential impact of fall 2023 vaccines.
Burn-in period
The model simulation considers three variant time periods during the burn-in period: (1) the pre-Omicron period (January 31, 2020–November 30, 2021); (2) the Omicron BA.1 period (December 1, 2021–August 14, 2022); and (3) the Omicron BA.4/BA.5 period (August 15, 2022–February 28, 2023). During the variant time period 1, all vaccines administered were considered well-matched to circulating COVID-19 variants, so VE depended only on the time since vaccination. However, at the start of variant time periods 2 and 3, it was assumed that a new variant with immune escape had emerged. Therefore, the VE of any previously administered vaccine immediately declines and a proportion of people immediately lose natural immunity and are moved from the R to the S compartments. Any newly administered poorly matched vaccines also have lower initial VE compared to a well-matched vaccine.
During the burn-in period, vaccine uptake patterns vary by age group. The residual VE protection at the end of the burn-in period varies by vaccine stratum because the timing of vaccine receipt of each booster is based on historical recommendations and coverage patterns.
The proportions of people in the R states depend on how many have previously developed an infection, which depends on social contact patterns and virus transmissibility. During the burn-in period, social contact patterns that drive risk of transmission were altered greatly during the pandemic through reduced mobility and risk reduction practices such as mask wearing. In addition, the transmissibility of the virus changed as new variants emerged and was modified by the receipt of COVID-19 vaccines. While contact patterns and VE were estimated based on data, the transmissibility of the virus was derived through a calibration process described in the Technical Appendix. The purpose of the calibration process was to ensure that the model predicted a valid number of infections, ensuring that a reasonable proportion of people ended up in the R compartment on August 31, 2023. The transmissibility parameter was then held constant during the analysis time horizon.
Burn-in period: alternative infection scenarios
In addition to the base case scenario, three additional calibrations were conducted in order to allow variation in the proportion of individuals with natural immunity and the amount of residual VE at the end of the burn-in period. For the first alternative burn-in scenario, the waning rate of natural protection from a SARS-CoV-2 infection during Omicron was doubled and then the model was recalibrated to the same level as in the base case. For the second, the waning rate was reduced by half. A final alternative burn-in scenario was created in which a drop in VE was added on January 15, 2023, to mimic the emergence of XBB variants and reduce the residual VE accordingly. These changes ultimately led to different incidence projections during the analysis time horizon. Further details are provided in the Technical Appendix.
Analysis time horizon
To conduct the analyses, the SEIR model simulation was run multiple times, varying the vaccination characteristics (initial VE; waning of VE; vaccine coverage) for the fall 2023 vaccine campaigns (i.e. Moderna Fall Campaign, Pfizer-BioNTech Fall Campaign, and No Vaccine Fall Campaign) during the analysis time horizon between September 1, 2023, and August 31, 2024. The inputs for VE and coverage are described in the following sections for the base case and scenario analyses.
Analysis time horizon: fall 2023 COVID-19 vaccine effectiveness
For the base case analyses, the updated COVID-19 mRNA fall 2023 vaccines from both Moderna and Pfizer-BioNTech were assumed to be well-matched to the circulating COVID-19 variant for the entire 1-year time horizon. VE input values are summarized in . The updated Moderna COVID-19 mRNA fall 2023 vaccine was tested in a phase 2/3 randomized safety and immunogenicity study; results from this study indicated that the vaccine elicits a robust neutralizing antibody response.Citation21 As there are no data on clinical outcomes for the updated Moderna fall 2023 vaccine, data from past vaccine formulations used during the Omicron variant period were assumed. Our estimate of the initial VE against hospitalization was based upon a Kaiser Permanente prospective cohort study of the Moderna bivalent BA.4/BA.5 COVID-19 vaccine by Tseng et al.Citation22 These VE estimates were achieved for the first month following vaccination but then waned, with an absolute monthly decrease based on a meta-analysis of the effect of monovalent vaccines against Omicron BA.1/BA.2.Citation23 As this study had no outcomes related to infection, the estimate of the initial VE against infection was based on a meta-analysis of monovalent versions of the vaccines administered during the Omicron period.Citation24
Table 1. Vaccine effectiveness parameters for the updated COVID-19 mRNA fall 2023 vaccines.
For the comparison between the Moderna Fall Campaign and the No Vaccine Fall Campaign, several scenario analyses were conducted by varying the initial VE and monthly waning rates according to 95% confidence intervals (CIs) (). The VE estimates over time for the base case and scenario analyses are shown in .
Figure 2. The vaccine effectiveness of the updated Moderna COVID-19 mRNA fall 2023 vaccine over time for those who receive their vaccine in September. Abbreviations. VE, vaccine effectiveness.
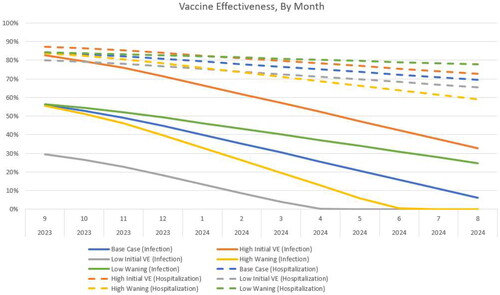
For the comparison of the updated Moderna and Pfizer-BioNTech COVID-19 mRNA vaccines, the VE of the Moderna vaccine was held constant at the base case value. The relative vaccine effectiveness (rVE) estimates between the two updated fall 2023 vaccines were assumed based on a US-based comparative retrospective database analysis on the VE of Moderna and Pfizer-BioNTech BA.4/BA.5 bivalent vaccines by Kopel et al. (2023).Citation18 They conducted multivariate Cox regression models to estimate the hazard ratios (HRs) adjusted by potential confounders. The rVE was then calculated as 100*(1 – HR). For those aged ≥18 years, the rVE for the Moderna vaccine compared to the Pfizer-BioNTech vaccine against hospitalizations is 9.8% (95% CI, 2.6%-16.4%), while the rVE against outpatient visits, which was used as a proxy for infections, is 5.1% (95% CI, 3.2%-6.9%). For all analyses, the Pfizer-BioNTech VE was calculated based on the Moderna VE and reduced by these rVE values (). The 95% CIs of the rVEs were used to calculate ranges for scenario analyses. The rVE used for the scenario where individuals aged ≥65 years receive the vaccine is presented in the Technical Appendix. The monthly waning rates were assumed to be the same for both the Moderna and Pfizer-BioNTech vaccines in all scenarios.
Analysis time horizon: fall 2023 COVID-19 vaccine coverage
For the base case analyses, uptake of the updated COVID-19 fall 2023 vaccines was assumed to occur between September 2023 and January 2024, with final coverage rates, by age group, based on the uptake of influenza vaccines for the 2022–2023 season.Citation25 We assumed that individuals who received at least the primary vaccination series have an equal chance of being vaccinated irrespective of their booster histories. Uptake patterns were assumed to be the same for both the Moderna Fall Campaign and the Pfizer-BioNTech Fall Campaign. For the comparison of the Moderna Fall Campaign to the No Vaccine Fall Campaign, scenario analyses were conducted by varying the uptake rate of those who receive the updated vaccine. Further detail is provided in the Technical Appendix.
Consequences of infection
Each run of the SEIR model predicts the total number of infections (asymptomatic and symptomatic) and the incremental reduction in the risk of hospitalization for infection for vaccinated versus unvaccinated persons for each month of the analysis time period. These monthly outputs are used in a decision tree, which is shown in Figure A11 of the Technical Appendix, to calculate the clinical and economic consequences of infections.
The number of monthly infections entering the decision tree is reduced because only symptomatic infections have consequences for quality-of-life and economic costs. For the base case, the proportion of infections that are symptomatic was set to 67.6%,Citation26 as estimated in a meta-analysis of studies published on Omicron infections. In sensitivity analyses, this proportion was varied according to the CI (95% CI, 60.5%-74.7%).
Following all symptomatic infections, the risk of myocarditis varies with age. Independent of the risk of myocarditis, some infections are treated in the hospital, and the risk of more severe SARS-CoV-2 infection increases with age. The probability of hospitalization in unvaccinated symptomatic patients is displayed in . For vaccinated persons, probabilities are reduced according to VE, which varies by vaccination strata and is calculated within the SEIR model. Those who are hospitalized face a risk of mortality that varies by the highest level of care received (ventilator; intensive care unit [ICU] with no ventilator; no ICU or ventilator). There is an increased risk of mortality post-discharge, compared to age-specific mortality rates, as well as a risk of readmission to hospital. Patients who are not hospitalized are considered to have a non-severe infection and are not at risk of death from COVID-19.
Table 2. Base case inputs for the infection consequences model.
The inputs for the infection consequences decision tree model are displayed in . For the deterministic sensitivity analyses (DSAs), percentage with symptoms, infection-induced myocarditis rates, hospitalization rates in the unvaccinated, hospitalization level of care, and in-hospital mortality rates were varied according to their 95% CIs. All other inputs were varied by ±25% of the base case value.
The base case economic analyses were conducted using the healthcare perspective; all cost inputs are shown in . A scenario analysis was conducted using the societal perspective, which also included lost productivity costs (see Table A8). All past costs were inflated to 2022 US dollars using the medical care component of the US Consumer Price Index.Citation27 For the healthcare cost perspective, the average cost of ambulatory care was calculated as a mix of treatment in outpatient clinics or the emergency department. As a portion of patients with non-severe SARS-CoV-2 infection will not require any medical attention, the cost of ambulatory care was weighted by the probability of seeking outpatient care for treatment. All patients who recovered from their infection were assigned a post-infection cost, which was higher for those treated in the hospital compared to those with non-severe cases. These cost inputs were derived from Koumpias et al.Citation28 who calculated incremental healthcare costs up to 6 months pre- and post-COVID-19 diagnosis. The incremental costs may therefore represent comorbidities that were exacerbated by infection, recovery from organ damage related to COVID-19 or its treatment, or other costs associated with the symptoms of long COVID.Citation29 As the time horizon for the analytic period is only 1 year, none of the costs were discounted.
The expected number of life years lost due to early deaths from COVID-19 was calculated using expected survival by age as reported by the National Center for Health Statistics.Citation30 Age-specific utility values for individuals without infection, obtained using the EuroQol-5D in a group of US adults, were attached to each year lost due to early death from COVID-19.Citation31 All future QALYs lost were discounted by 3% annually to present value.Citation32 The QALYs lost due to morbidity associated with SARS-CoV-2 infection, including myocarditis due to SARS-CoV-2 infection, COVID-19 treatment, and post-infection care and symptoms (regardless of whether or not medical care was sought), are shown in . The QALYs lost due to mortality, morbidity, and adverse events following vaccination (described below) were summed to determine the total QALYs lost.
Table 3. Base case inputs for the infection consequences model (costs and QALYs lost).
Vaccine costs and adverse events
For each vaccine administered, individuals were assigned a probability of experiencing a vaccine-related adverse event (grade 3 local or systemic infection-related events; anaphylaxis; myocarditis/pericarditis). The probabilities, along with the associated costs and QALYs lost, are displayed in Table A9. The unit cost of the updated Moderna fall 2023 vaccine was set to $129.50,Citation33 and the unit cost of the updated Pfizer-BioNTech vaccine was set to $120.00 in the base case analysis.Citation34 A vaccine administration cost of $20.33 was also included in model analyses.Citation35 For the societal perspective, time loss from vaccination was assumed to be 0.04 days, considering the majority of COVID-19 vaccines are administered in the pharmacy setting.Citation36
Deterministic sensitivity analyses
A series of one-way and multi-way DSAs were conducted to test the robustness of the results for the comparison of the Moderna Fall Campaign to the No Vaccine Fall Campaign. As described throughout the text and summarized in Table A11, inputs related to the incidence of infection, fall 2023 vaccine coverage, fall 2023 vaccine VE, percentage of symptomatic infections, and the inputs to the consequences decision tree were varied. A scenario analysis was conducted for these comparisons, where the target population was limited to vaccination of those aged ≥65 years, rather than to all adults aged ≥18 years. A second scenario analyses was conducted using the societal perspective.
Probabilistic sensitivity analyses
For the No Vaccine Fall Campaign versus the Moderna Fall Campaign, the percentage of patients with symptomatic infections, as well as the probabilities, costs, and QALY inputs in and Table A9, were varied in a probabilistic sensitivity analysis (PSA). Distributions for the PSA were chosen based on recommendations from Briggs, Sculpher, and Claxton.Citation37 For skewed data (e.g. costs), for example, a gamma or log-normal distribution is advised, while for binomial data, a beta distribution was used. If data were not available to estimate a standard error, then it was assumed to be 10% of the mean.
Results
Comparison: updated Moderna Fall Campaign versus No Vaccine Fall Campaign
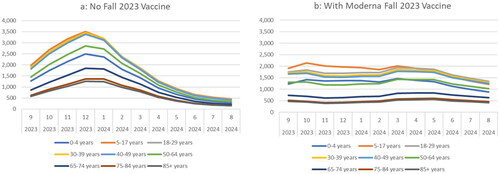
For the base case scenario, the model predicted that from September 1, 2023, to August 31, 2024, there will be 64,203,464 symptomatic infections using the No Vaccine Fall Campaign scenario and 56,956,517 if the Moderna Fall Campaign is administered. This represents a decrease of 7,237,947 symptomatic infections (-11%) when 111,097,782 vaccines are administered to individuals aged ≥18 years. The predicted monthly incidence per 100,000 persons is shown over time, by age group, in . Without the vaccine, the incidence is expected to peak in December 2023 and decline to a low point from July 2024 to August 2024. With the vaccine, the peak is flattened, and incidence is predicted to remain more constant over time. In July and August 2024, the incidence is higher with vaccine compared to no vaccine. This pattern is predicted because the vaccine protection against infection wanes, leading to a rebound in the risk of transmission with contacts at the end of the 1-year time horizon.
Figure 3. Monthly rate of symptomatic infections (per 100,000 persons) with and without an updated Moderna mRNA fall 2023 vaccination, by age group.
The incidence of symptomatic infection was highest in individuals 5 to 17 years of age and lowest in those aged ≥75 years (). With the No Vaccine Fall Campaign, the residual VE from past vaccination is low, ranging from 4% to 8% among those who received the bivalent booster, to 0% among people who were vaccinated with any number of monovalent doses. The proportion of individuals immune to infections was higher in those aged <50 years, ranging from 50.8% to 67.5%, but was 30.9% or lower in the older age groups, suggesting that the incidence patterns by age group are driven by contact patterns and mixing across age groups. With a fall 2023 vaccine strategy targeting those aged ≥18 years, individuals 5 to 17 years of age continue to have the highest incidence while individuals aged ≥75 years have the lowest.
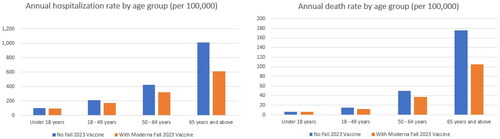
In the base case analysis, with the No Vaccine Fall Campaign, there are 1,199,429 COVID-19–related hospitalizations and 154,798 associated deaths predicted from September 2023 to August 2024. With an updated Moderna mRNA fall 2023 vaccine, those numbers decline to 856,823 (-29%) and 104,304 (-33%), respectively. The residual VE against hospitalization is higher compared to infection, ranging by age group from 31% to 37% among individuals who received the primary series only and 68% to 70% among individuals who received the bivalent booster. While individuals aged ≥65 years have the highest vaccine coverage rates overall, they also have the highest risk of hospitalization and death. These individuals are therefore expected to have the highest annual rates of hospitalization and death per 100,000 persons with and without the fall 2023 vaccine ().
Figure 4. The annual rate of hospitalizations and deaths per 100,000 with and without an updated Moderna mRNA fall 2023 vaccination across the 1-year time horizon, by age group.
Given this clinical impact, the updated Moderna COVID-19 mRNA fall 2023 vaccine is expected to lead to a gain of 499,660 QALYs by preventing COVID-19–related deaths and 241,220 QALYs gained due to prevented morbidity, for a total of 740,870 QALYs gained (0.007 QALYs gained per vaccination). Approximately 94% of those QALYs gained due to morbidity are due to the prevention of the post-infection impact of COVID-19, while only 8% are from preventing the initial infection itself. Vaccination costs are $16,646 million; however, COVID-19 treatment costs with vaccination are $42,330 million compared to $53,255 million without the vaccine, leading to $10,924 million in healthcare treatment costs prevented. The incremental cost per QALY gained of the updated Moderna COVID-19 mRNA fall 2023 vaccine compared to no additional COVID-19 vaccination in fall 2023 is therefore $7700 (; see Table A10 for further cost disaggregation).
Table 4. Economic results for the base case and scenario analyses.
When the target population for vaccination was limited to those aged ≥65 years, fewer vaccines were delivered (39,793,511) and only 2.7 million cases of symptomatic disease, 180,000 hospitalizations, and 31,000 deaths were prevented compared to the 7.2 million cases, 343,000 hospitalizations, and 50,000 deaths prevented when all adults are targeted. Older age groups are at greater risk of severe outcomes, so the incremental cost per QALY gained decreased to $1800 (). When vaccine coverage rates are decreased, fewer clinical events are prevented (4.0 million symptomatic infections, 181,000 hospitalizations, 27,000 deaths) but, because of increased efficiency due to the non-linear herd effects in the dynamic model, the ICER decreases to $6200. With the bivalent vaccine, overall coverage was lower than the base case for the new vaccine, but the proportion of older (i.e. higher risk) individuals increased and the incremental cost per QALY gained decreased to $3900. Using the societal cost perspective, the cost per QALY gained is lower than in the healthcare perspective, at $2100 per QALY gained ().
The 12 most influential variables from the DSAs are summarized in the tornado diagram in (full DSA results are also provided in Table A11). Overall, VE, patterns of COVID-19 incidence, hospitalization rates, and costs have the greatest impact on cost-effectiveness.
Figure 5. Tornado diagrama: key deterministic sensitivity analyses. Abbreviations. CI, confidence interval; ICER, incremental cost-effectiveness ratio; LB, lower bound; QALY, quality-adjusted life-year; UB, upper bound; VE, vaccine effectiveness. aLabels correspond to the bars presented in the tornado diagram. For example, if the upper bound of a given parameter generates a lower ICER than the lower bound, the upper bound will appear first in the parameter label. bIndicates Moderna Fall Campaign dominates the No Vaccine Fall Campaign.
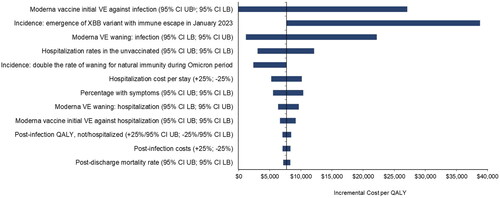
Varying the updated Moderna COVID-19 mRNA fall 2023 initial VE against infection had the greatest impact on the ICER. With low VE against infection, the cost per QALY gained increased to $27,100, while at the highest VE, the Moderna Fall Campaign becomes cost saving as well as more beneficial compared to no vaccine. If the waning rate of VE against infection is varied, then the ICER ranges from $1200 to $22,200. Varying the waning rate of VE against hospitalization led to a smaller range ($6400-$9700). When initial VE against infection and hospitalization were varied simultaneously, the ICER ranged from the Moderna Fall Campaign becoming cost saving as well as more beneficial compared to no vaccine to $33,200.
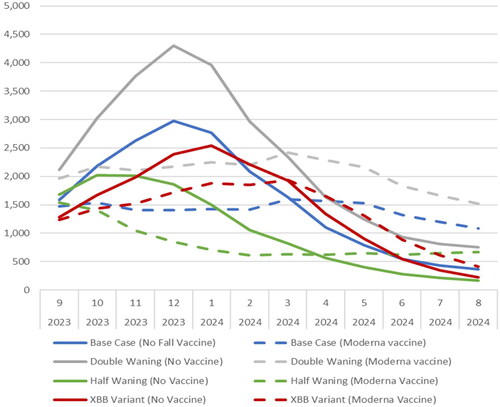
DSA results also suggest that patterns of COVID-19 incidence impact the ICER. Four different incidence scenarios were created with the SEIR model in order to test the potential impact (), but the results are complex given the non-linearity of the model. compares the monthly incidence of the base case and the four scenarios. The incidence of infection increased when the rate of waning natural immunity during Omicron is doubled. There were more infections, and more prevented infections, with the same number of vaccinations as in the base case, so the ICER decreased to $2400. When the waning rate of natural immunity was halved, however, the ICER was reduced (improved) slightly to $7600. While there are fewer infections, the timing of those infections differs, and greater numbers are prevented than in the base case. If we consider that the new XBB variant causes a 50% decrease in both vaccine-mediated and natural immunity in the base case, when the model is recalibrated to achieve the same number of infections in the burn-in period, the transmissibility parameter is lowered. This, in turn, leads to a lower number of infections for all the analytic periods. In that scenario, there were fewer infections prevented with the vaccine. Therefore, the ICER increased to $38,700. When the percentage of infections that are symptomatic was varied, the cost per QALY ranged from $5600 to $10,400.
Figure 6. The monthly incidence of symptomatic infection (per 100,000 persons) for base case and three scenario analyses.
When the hospital rate among unvaccinated persons with a symptomatic infection was varied, the incremental cost per QALY gained varied from $3000 to $12,100. Varying hospital costs by 25% caused the ICER to vary from $5300 to $10,200. The remaining parameters in the DSA had minimal impact on cost-effectiveness results.
In the probabilistic sensitivity analysis, as shown in the cost-effectiveness acceptability curve in Figure A11, the Moderna Fall Campaign vaccine reached a 100% probability of being the most cost-effective option at a willingness-to-pay threshold of approximately $17,000/QALY.
Comparison: Moderna strategy versus Pfizer-BioNTech strategy
In the base case analysis, the updated Moderna fall 2023 vaccine had greater initial VE than the updated Pfizer-BioNTech version of the vaccine. Across the 1-year time frame, the Moderna Fall Vaccine campaign is predicted to prevent 932,165 COVID-19 more infections than the Pfizer-BioNTech Fall Vaccine campaign. In addition, use of the Moderna vaccine is predicted to result in 23,658 fewer hospitalizations and 3340 fewer deaths than use of the Pfizer-BioNTech vaccine. This is expected to lead to an additional 65,418 QALYs gained. While the Moderna fall 2023 vaccine prevents more COVID-19 treatment costs, these healthcare cost savings do not fully offset the higher unit cost. From the healthcare cost perspective, the Moderna Fall Campaign is expected to cost $133,888,000 more than the Pfizer-BioNTech Fall Campaign. The incremental cost per QALY gained of the Moderna Fall 2023 COVID-19 vaccine compared to the Pfizer-BioNTech one is $1741. From the societal cost perspective, the higher unit cost of the Moderna Fall 2023 COVID-19 vaccine is fully offset by reductions in COVID-19-associated treatment and productivity loss. The Moderna Fall Campaign therefore dominates the Pfizer-BioNTech Fall Campaign as it is associated with lower total societal costs and additional QALY gained (; see Table A10 for further cost disaggregation.) In sensitivity analyses from the healthcare cost perspective, varying the rVE, the Moderna Fall Campaign dominates the Pfizer-BioNTech Fall Campaign at the upper bound difference in rVE and has an ICER of $17,630 at the lower bound difference in rVE. For the subgroup analysis limited to those 65 years of age and older, use of the Moderna Fall 2023 COVID-19 vaccine is predicted to have lower total healthcare costs and societal costs.
Discussion
Using an SEIR model stratified by vaccination status, we examined the potential clinical impact and the cost-effectiveness of fall 2023 COVID-19 vaccines in the United States targeting individuals aged ≥18 years. The updated Moderna COVID-19 mRNA fall 2023 vaccine is predicted to prevent 7.2 million cases of symptomatic infection, 340,000 hospitalizations, and 50,500 deaths between September 2023 and August 2024 compared to no new fall 2023 vaccination. In the base case analysis, the incremental cost per QALY gained was predicted to be $7700 from the healthcare payer perspective. Neumann et al. have argued a willingness-to-pay threshold of $100,000 per QALY gained is reasonable for the United States.Citation38 Considering this threshold, use of the vaccine is cost-effective. Using a societal cost perspective, the ICER was only $2100 per QALY gained. There is still uncertainty regarding the morbidity and mortality associated with SARS-CoV-2 infection; however, the sensitivity analyses demonstrated that the results are robust. Although the incremental cost per QALY was most affected by the incidence of infection, the VE, and the probability of hospitalization and its associated costs, vaccination with the updated Moderna COVID-19 mRNA fall 2023 vaccine is cost-effective across a wide range of parameter values and scenarios.
As COVID-19 transitions from a pandemic to an endemic state, the future incidence of infection and the expected pattern of infection are highly uncertain. It is clear that the incidence of SARS-CoV-2 infection has been declining since the peak of infection in January 2022Citation39; however, it is difficult to quantify the change because of the evolution of data collection practices. During the pandemic phase, SARS-CoV-2 infection was reported to public health authorities at a much greater rate than other infectious diseases, as many individuals sought confirmatory polymerase chain reaction testing from healthcare providers. Since the emergence of Omicron, healthcare-seeking behavior has declined and so has the proportion of infections reported. For this analysis, four different incidence scenarios were generated by the SEIR model to vary the dynamics of infection. For all of these scenarios, use of the Moderna vaccine remained cost-effective, as the ICER was below $40,000 per QALY gained.
The VEs of the new fall 2023 vaccines against both hospitalization and infection are unknown as the randomized controlled trials conducted with the updated Moderna COVID-19 vaccine focused on immunological outcomes only.Citation21 In our analysis, the VE of the bivalent vaccine against hospitalization from an observational study was therefore used to represent the VE against hospitalization of a fall 2023 vaccine that is well-matched to the circulating variant.Citation22 Data on the VE against infection are more variable, and therefore, the results of a meta-analyses were used.Citation24 While a poorly matched vaccine would provide some protection, it would likely be associated with lower initial VE and possibly also faster waning of response. It is also unknown when a new variant that evades immunity mediated by past infections (natural immunity) or vaccine doses (vaccine immunity) will emerge. The only option at the point of time when decisions about adopting the new vaccine are made is to examine the impact of a vaccine with a range of VE profiles, as has been done within the scenario analyses. These analyses show that a fall 2023 COVID-19 vaccine is likely to be valuable over a range of VE scenarios. Real-world studies of the effect of the new fall 2023 vaccines on the clinical outcomes are required to validate our modeled predictions.
The hospitalization rates in unvaccinated individuals that were used to populate the model were estimated using data from the first year of the pandemic.Citation40 They were adjusted downwards in order to account for the lower severity of infections with Omicron variants.Citation41 An important driver of hospitalization costs is the level of care required, with a higher cost of treatment in the ICU (with or without mechanical ventilation) compared with patients who did not require treatment in the ICU. The current severity of disease associated with Omicron is not fully quantified and the virulence of future COVID-19 variants is unknown. In sensitivity analyses, however, use of the fall 2023 vaccine remained cost-effective, with all ICERs falling well below the $100,000 cost per QALY threshold.
Other parameters, which may increase the value of vaccination, were not included in the analysis. For example, although post-infection costs and QALY decrements were included, they were of limited duration with a follow-up time limited to 6 months for healthcare costsCitation28 and 1 year of QALYs.Citation42,Citation43 Bowe et al. recently reported on the lasting health consequences 2 years following infection.Citation44 Results from Zhang et al. found higher rates of new-onset hypertension in individuals following SARS-CoV-2 infection.Citation45 On the other hand, the post-infection cost data that we have used were based on patients infected with the ancestral SARS-CoV-2 virus strain (Wuhan-Hu-1) and it is not clear whether these costs would be reduced given the lower severity of the Omicron variants and evolution of care over time. Given the uncertainty in the portion of individuals who may be experiencing long COVID,Citation46 and the fact that 6 months of post-COVID infection costs were incorporated, we did not include an estimate of any additional healthcare costs for those who report experiencing longer term symptoms.Citation47 Additionally, although analyses from the societal perspective were included, the emphasis was on short-term lost productivity for the COVID-19 patient as there are limited data and uncertainty about the longer-term impacts. Broader aspects of lost productivity, such as caregiver time,Citation48,Citation49 are not included in the current analysis, nor are the consequences of weighing utility losses associated with severe disease higher than non-severe disease and the associated utility losses for families.Citation49 Other parameters, as proposed by the International Society of Pharmacoeconomics and Outcomes Research in the “value flower” frameworkCitation49 and noted by Postma et al.Citation48 and Di Fusco et al.Citation50 that may also increase the value of vaccination, which include equity, productivity of other individuals, and health system strengthening, are also not included.
Our analysis quantified the potential clinical and economic impact of using versions of the fall 2023 COVID-19 vaccine that provide better protection than other versions. The Moderna mRNA COVID-19 vaccine was found to be more effective than the Pfizer-BioNTech mRNA COVID-19 vaccine in a meta-analysis in immunocompromised populationsCitation13 and in studies of the monovalentCitation14–17 and bivalent versionsCitation18 of the vaccine in the general population. While both the Moderna and Pfizer-BioNTech vaccines have the same mechanisms of action, differences in VE may exist because their delivery systems and dosage differ. To our knowledge, there is no systematic review and meta-analysis summarizing all of the studies that directly compare the Moderna and the Pfizer-BioNTech mRNA COVID-19 vaccines. For this analysis, we used the results from the study by Kopel et al.Citation18 as it was a study of the bivalent formulations against BA.4/BA.5 during the period of BA.4/BA.5 dominance, and that used a large sample size and attempted to control for potential bias from potential confounders. Based on the VE results of the Kopel et al. study,Citation18 we predicted that the difference in VE would lead to prevention of 23,700 additional hospitalizations due to COVID-19 infections and 3300 additional deaths in the US population. While the total healthcare costs associated with the Moderna fall vaccine are higher than those associated with the Pfizer-BioNTech fall vaccine, with the base case rVE (Moderna vs Pfizer-BioNTech: 5.1% for infection; 9.8% for hospitalization), the cost per QALY gained of a Moderna Fall Campaign compared to Pfizer-BioNTech was only $1700. After including the savings in productivity costs with additional infections prevented, the total societal cost of the Moderna Fall Campaign is lower than that of the Pfizer-BioNTech Campaign.
Conclusions
In conclusion, while the VE of the updated vaccines is uncertain, this analysis suggests that using COVID-19 mRNA vaccines in fall 2023 will prevent significant morbidity and mortality in the United States. Furthermore, the analyses with our model predict the continued use of the Moderna vaccine is likely to be highly cost-effective compared to no further vaccination. If the difference in vaccine effectiveness between the two fall 2023 mRNA vaccines is similar to that reported in studies on both the original and bivalent versions of the vaccine, then the Moderna vaccine will be cost-effective compared to the Pfizer-BioNTech vaccine from a healthcare perspective and cost saving when factoring in reduced productivity losses, despite a higher unit cost.
Transparency
Author contributions
AL, EB, KF, KJ, MK, MM, NV, and MW were involved in study design and interpretation of the analysis. MM programmed the model with quality assurance by MK, AL, and KF. All authors were involved in model estimation. MM, MK, and KF conducted the analysis. AL, KF, MK, and MM wrote the initial draft of the manuscript, and all remaining co-authors critically revised the manuscript and approved the final version.
Acknowledgements
Medical writing and/or editorial assistance was provided by Kate Russin, of MEDiSTRAVA in accordance with Good Publication Practice (GPP 2022) guidelines, funded by Moderna, Inc., and under the direction of the authors.
Reviewer disclosures
Peer reviewers on this manuscript have no relevant financial or other relationships to disclose.
Previous presentations
The submitted manuscript has been published on a pre-print server (medrxiv: https://www.medrxiv.org/content/10.1101/2023.09.05.23295085v1).
Supplemental Material
Download MS Word (599.1 KB)Declaration of funding
This study was supported by Moderna, Inc.
Declaration of financial/other interests
MK is a shareholder in Quadrant Health Economics Inc, which was contracted by Moderna, Inc., to conduct this study. KF, AL, MM, and MW are consultants at Quadrant Health Economics Inc. KJ, EB, and NV are employed by Moderna, Inc. and hold stock/stock options in the company.
References
- United Nations. UN News. WHO chief declares end to COVID-19 as a global health emergency, 2023. Available from: https://news.un.org/en/story/2023/05/1136367.
- Centers for Disease Control and Prevention. End of the Federal COVID-19 Public Health Emergency (PHE) Declaration [cited 2023 September 12]. Available from: https://www.cdc.gov/coronavirus/2019-ncov/your-health/end-of-phe.html.
- Jones JM, Manrique IM, Stone MS, et al. Estimates of SARS-CoV-2 seroprevalence and incidence of primary SARS-CoV-2 infections among blood donors, by COVID-19 vaccination status - United States, April 2021-September 2022. MMWR Morb Mortal Wkly Rep. 2023;72(22):601–605. doi: 10.15585/mmwr.mm7222a3.
- Centers for Disease Control and Prevention. Updated (2023-2024 Formula). COVID-19 vaccine: interim 2023-2024 COVID-19 Immunization Schedule for Persons 6 Months of Age and Older. 2023. Available from: https://www.cdc.gov/vaccines/covid-19/downloads/COVID-19-immunization-schedule-ages-6months-older.pdf.
- Hodcroft E. CoVariants. Overview of variants in countries: France. 2023. Available from: https://covariants.org/.
- Rosenblum HG, Wallace M, Godfrey M, et al. Interim Recommendations from the Advisory Committee on Immunization Practices for the Use of Bivalent Booster Doses of COVID-19 Vaccines - United States, October 2022. MMWR Morb Mortal Wkly Rep. 2022;71(45):1436–1441. doi: 10.15585/mmwr.mm7145a2.
- Link-Gelles R, Ciesla AA, Roper LE, et al. Early estimates of bivalent mRNA booster dose vaccine effectiveness in preventing symptomatic SARS-CoV-2 infection attributable to Omicron BA.5- and XBB/XBB.1.5-related sublineages among immunocompetent adults - increasing community access to testing program, United States. December 2022-January 2023. MMWR Morb Mortal Wkly Rep. 2023;72(5):119–124. doi: 10.15585/mmwr.mm7205e1.
- Link-Gelles R, Weber ZA, Reese SE, et al. Estimates of bivalent mRNA vaccine durability in preventing COVID-19-associated hospitalization and critical illness among adults with and without immunocompromising conditions - VISION Network, September 2022-April 2023. MMWR Morb Mortal Wkly Rep. 2023;72(21):579–588. doi: 10.15585/mmwr.mm7221a3.
- U.S. Food and Drug Administration. Recommendation for the 2023-2024 Formula of COVID-19 vaccines in the U.S. [cited 2023 June 16]. Available from: https://www.fda.gov/media/169591/download.
- Hodcroft E. CoVariants [cited 2023 January 23]. Available from: https://covariants.org/.
- Utami AM, Rendrayani F, Khoiry QA, et al. Economic evaluation of COVID-19 vaccination: a systematic review. J Glob Health. 2023;13:06001. doi: 10.7189/jogh.13.06001.
- Kohli MA, Maschio M, Lee A, et al. The potential clinical impact of implementing different COVID-19 boosters in fall 2022 in the United States. J Med Econ. 2022;25(1):1127–1139. doi: 10.1080/13696998.2022.2126127.
- Wang X, Haeussler K, Spellman A, et al. Comparative effectiveness of mRNA-1273 and BNT162b2 COVID-19 vaccines in immunocompromised individuals: a systematic review and meta-analysis using the GRADE framework. Front Immunol. 2023:14:1204831. doi: 10.3389/fimmu.2023.1204831.
- Nguyen VB, Boileau C, Bogdanov A, et al. Relative effectiveness of BNT162b2, mRNA-1273, and Ad26.COV2.S vaccines and homologous boosting in preventing COVID-19 in adults in the US. Open Forum Infect Dis. 2023;10(7):ofad288. doi: 10.1093/ofid/ofad288.
- Ono S, Michihata N, Yamana H, et al. Comparative effectiveness of BNT162b2 and mRNA-1273 booster dose after BNT162b2 primary vaccination against the Omicron variants: a retrospective cohort study using large-scale population-based registries in Japan. Clin Infect Dis. 2023;76(1):18–24. doi: 10.1093/cid/ciac763.
- Mayr FT, Talisa VB, Shaikh OS, et al. Comparative COVID-19 vaccine effectiveness over time in veterans. Open Forum Infect Dis. 2022;9(7):ofac311. doi: 10.1093/ofid/ofac311.
- Hulme WJ, Horne EMF, Parker EPK, et al. Comparative effectiveness of BNT162b2 versus mRNA-1273 covid-19 vaccine boosting in England: matched cohort study in OpenSAFELY-TPP. BMJ. 2023;380:e072808. doi: 10.1136/bmj-2022-072808.
- Kopel H, Nguyen VH, Boileau C, et al. Comparative Effectiveness of Bivalent (Original/Omicron BA.4/BA.5) COVID-19 Vaccines in Adults. Vaccines. 2023;11(11):1711. doi: 10.3390/vaccines11111711.
- Wolfel R, Corman VM, Guggemos W, et al. Virological assessment of hospitalized patients with COVID-2019. Nature. 2020;581(7809):465–469. doi: 10.1038/s41586-020-2196-x.
- Imai N, Cori A, Dorigatti I, et al. Report 3: transmissibility of 2019-nCOV. Imperial College London. 2020 [updated January 25, 2020; cited 2022 May 15]. Available from: doi: 10.25561/77148.
- Moderna Inc. Moderna COVID-19 Variant Vaccines. Presentation to the Vaccines and Related Biological Products Advisory Committee. 2023 [cited 2023 June 23]. Available from: https://www.fda.gov/advisory-committees/advisory-committee-calendar/vaccines-and-related-biological-products-advisory-committee-june-15-2023-meeting-announcement#event-materials.
- Tseng HF, Ackerson BK, Sy LS, et al. mRNA-1273 bivalent (original and Omicron) COVID-19 vaccine effectiveness against COVID-19 outcomes in the United States. Nat Commun 2023;14:5851. doi: 10.1038/s41467-023-41537-7.
- Higdon MM, Baidya A, Walter KK, et al. Duration of effectiveness of vaccination against COVID-19 caused by the Omicron variant. Lancet Infect Dis. 2022;22(8):1114–1116. doi: 10.1016/S1473-3099(22)00409-1.
- Pratama NR, Wafa IA, Budi DS, et al. Effectiveness of COVID-19 vaccines against SARS-CoV-2 Omicron variant (B.1.1.529): a systematic review with meta-analysis and meta-regression. Vaccines (Basel). 2022;10(12):2180. doi: 10.3390/vaccines10122180.
- Centers for Disease Control and Prevention. Weekly flu vaccination dashboard: influenza vaccination coverage, adults. 2023 [cited 2023 May 5]. Available from: https://www.cdc.gov/flu/fluvaxview/dashboard/vaccination-adult-coverage.html.
- Shang W, Kang L, Cao G, et al. Percentage of asymptomatic infections among SARS-CoV-2 Omicron variant-positive individuals: a systematic review and meta-analysis. Vaccines (Basel). 2022;10(7):1049. doi: 10.3390/vaccines10071049.
- US Bureau of Labor Statistics. US Consumer Price Index: medical care in US city average, all urban consumers. 2023 [cited 2023 May 15]. Available from: https://data.bls.gov/cgi-bin/surveymost.
- Koumpias AM, Schwartzman D, Fleming O. Long-haul COVID: healthcare utilization and medical expenditures 6 months post-diagnosis. BMC Health Serv Res. 2022;22(1):1010. doi: 10.1186/s12913-022-08387-3.
- Saydah S. Update: epidemiologic characteristics of long COVID. ACIP Meeting Slides. Atlanta, GA: Centers for Disease Control and Prevention; 2023 [cited 2023 September 12]. Available from: https://www.cdc.gov/vaccines/acip/meetings/slides-2023-09-12.html.
- Centers for Disease Control and Prevention. National Center for Health Statistics. National Vital Statistics System - Life Expectancy 2017 [cited 2020 June 24]. Available from: https://ftp.cdc.gov/pub/Health_Statistics/NCHS/Publications/NVSR/68_07/.
- Hanmer J, Lawrence WF, Anderson JP, et al. Report of nationally representative values for the noninstitutionalized US adult population for 7 health-related quality-of-life scores. Med Decis Making. 2006;26(4):391–400. doi: 10.1177/0272989X06290497.
- Sanders GD, Neumann PJ, Basu A, et al. Recommendations for conduct, methodological practices, and reporting of cost-effectiveness analyses: second panel on cost-effectiveness in health and medicine. JAMA. 2016;316(10):1093–1103. doi: 10.1001/jama.2016.12195.
- IBM Micromedex. Average wholesale price from RedBook NDC accessed via Compendia [cited 2023 August 16]. Available from: Available from: https://www.ibm.com/us-en/marketplace/micromedex-red-book.
- Wolters Kluwer. Medi-Span Prescription Drug Pricing Data. 2023. Available from: https://www.wolterskluwer.com/en/solutions/medi-span/medi-span/drug-pricing-data.
- Centers for Medicare and Medicaid Services. National Physician Fee Schedule Relative Value File April Release. 2023 [cited 2023 May 3]. Available from: https://www.cms.gov/medicare/medicare-fee-service-payment/physicianfeesched/pfs-relative-value-files/rvu23b.
- IQVIA Institute Report. Trends in Vaccine Administration in the United States. 2023 [cited 2023 August 7]. Available from: https://www.iqvia.com/insights/the-iqvia-institute/reports/trends-in-vaccine-administration-in-the-united-states.
- Briggs AH, Sculpher MJ, Claxton K. Decision modelling for health economic evaluation. Oxford: Oxford University Press; 2006.
- Neumann PJ, Cohen JT, Weinstein MC. Updating cost-effectiveness–the curious resilience of the $50,000-per-QALY threshold. N Engl J Med. 2014;371(9):796–797. doi: 10.1056/NEJMp1405158.
- Thornburg NJ. Update on current epidemiology of COVID-19 pandemic and SARS-CoV-2 variants. Presentation to the Vaccines and Related Biological Products Advisory Committee. Available from: https://www.fda.gov/advisory-committees/advisory-committee-calendar/vaccines-and-related-biological-products-advisory-committee-june-15-2023-meeting-announcement#event-materials.
- Reese H, Iuliano AD, Patel NN, et al. Estimated incidence of coronavirus disease 2019 (COVID-19) illness and hospitalization-United States, February-September 2020. Clin Infect Dis. 2021;72(12):e1010–e1017. doi: 10.1093/cid/ciaa1780.
- Wang L, Berger N, Kaelber D, et al. COVID infection rates, clinical outcomes, and racial/ethnic and gender disparities before and after Omicron emerged in the US. medRxiv. 2022; 2022.02.21.22271300. doi: 10.1101/2022.02.21.22271300.
- Sandmann FG, Tessier E, Lacy J, et al. Long-term health-related quality of life in non-hospitalized coronavirus disease 2019 (COVID-19) cases with confirmed severe acute respiratory syndrome coronavirus 2 (SARS-CoV-2) infection in England: longitudinal analysis and cross-sectional comparison with controls. Clin Infect Dis. 2022;75(1):e962–e973. doi: 10.1093/cid/ciac151.
- The PHOSP-COVID Collaborative Group. Clinical characteristics with inflammation profiling of long COVID and association with 1-year recovery following hospitalisation in the UK: a prospective observational study. Lancet Respir Med. 2022;10(8):761–775. doi: 10.1016/S2213-2600(22)00127-8.
- Bowe B, Xie Y, Al-Aly Z. Postacute sequelae of COVID-19 at 2 years. Nat Med. 2023;29(9):2347–2357. doi: 10.1038/s41591-023-02521-2.
- Zhang V, Fisher M, Hou W, et al. Incidence of new-onset hypertension post-COVID-19: comparison with influenza. Hypertension. 2023;80(10):2135–2148. doi: 10.1161/HYPERTENSIONAHA.123.21174.
- Hoeg TB, Ladhani S, Prasad V. How methodological pitfalls have created widespread misunderstanding about long COVID. BMJ Evid Based Med. 2023;:bmjebm-2023-112338. doi: 10.1136/bmjebm-2023-112338.
- Ford ND, Slaughter D, Edwards D, et al. Long COVID and significant activity limitation among adults, by age - United States, June 1-13, 2022, to June 7-19, 2023. MMWR Morb Mortal Wkly Rep. 2023;72(32):866–870. doi: 10.15585/mmwr.mm7232a3.
- Postma M, Biundo E, Chicoye A, et al. Capturing the value of vaccination within health technology assessment and health economics: country analysis and priority value concepts. Vaccine. 2022;40(30):3999–4007. doi: 10.1016/j.vaccine.2022.04.026.
- Lakdawalla DN, Doshi JA, Garrison LP, Jr., et al. Defining elements of value in health care - a health economics approach: an ISPOR Special Task Force Report [3]. Value Health. 2018;21(2):131–139. doi: 10.1016/j.jval.2017.12.007.
- Di Fusco M, Mendes D, Steuten L, et al. The societal value of vaccines: expert-based conceptual framework and methods using COVID-19 vaccines as a case study. Vaccines (Basel). 2023;11(2):234. doi: 10.3390/vaccines11020234.
- Boehmer TK, Kompaniyets L, Lavery AM, et al. Association between COVID-19 and myocarditis using hospital-based administrative data - United States, March 2020-January 2021. MMWR Morb Mortal Wkly Rep. 2021;70(35):1228–1232. doi: 10.15585/mmwr.mm7035e5.
- Centers for Disease Control and Prevention. Estimated flu-related illnesses, medical visits, hospitalizations, and deaths in the United States—2019–2020 flu season. 2022 [cited 2022 October 28]. Available from: https://www.cdc.gov/flu/about/burden/2019-2020.html.
- Di Fusco M, Shea KM, Lin J, et al. Health outcomes and economic burden of hospitalized COVID-19 patients in the United States. J Med Econ. 2021;24(1):308–317. doi: 10.1080/13696998.2021.1886109.
- Verna EC, Landis C, Brown RS, et al. Factors associated with readmission in the United States following hospitalization with coronavirus disease 2019. Clin Infect Dis. 2022;74(10):1713–1721. doi: 10.1093/cid/ciab464.
- Chopra V, Flanders SA, O'Malley M, et al. Sixty-day outcomes among patients hospitalized with COVID-19. Ann Intern Med. 2021;174(4):576–578. doi: 10.7326/M20-5661.
- HCUPnet - Hospital Inpatient National Statistics. 2018 National Diagnoses - Clinical Classification Software Refined (CCSR), Principal Diagnosis: CIR005 Myocarditis and Cardiomyopathy. 2018 [cited 2021 October 13]. Available from: https://hcupnet.ahrq.gov/#setup.
- Centers for Medicare and Medicaid Services. 2022 National Physician Fee Schedule Relative Value File October Release. 2022 [cited 2023 May]. Available from: https://www.cms.gov/medicare/medicare-fee-for-service-payment/physicianfeesched/pfs-relative-value-files.
- Fiedler M, Song Z. Brookings report: estimating potential spending on COVID-19 care [cited 2020 July 22]. Available from: https://www.brookings.edu/research/estimating-potential-spending-on-covid-19-care/.
- Huang BZ, Creekmur B, Yoo MS, et al. Healthcare utilization among patients diagnosed with COVID-19 in a large integrated health system. J Gen Intern Med. 2022;37(4):830–837. doi: 10.1007/s11606-021-07139-z.
- Prosser LA, Harpaz R, Rose AM, et al. A cost-effectiveness analysis of vaccination for prevention of herpes zoster and related complications: input for national recommendations. Ann Intern Med. 2019;170(6):380–388. doi: 10.7326/M18-2347.
- Smith KJ, Roberts MS. Cost-effectiveness of newer treatment strategies for influenza. Am J Med. 2002;113(4):300–307. doi: 10.1016/s0002-9343(02)01222-6.
- Centers for Disease Control and Prevention. Isolation and precautions for people with COVID-19 [cited 2022 Dec 21]. Available from: https://www.cdc.gov/coronavirus/2019-ncov/your-health/isolation.html.
- Barbut F, Galperine T, Vanhems P, et al. Quality of life and utility decrement associated with Clostridium difficile infection in a French hospital setting. Health Qual Life Outcomes. 2019;17(1):6. doi: 10.1186/s12955-019-1081-5.