
ABSTRACT
Patients with visuospatial neglect (VSN) suffer from an imbalance in visual attention between their left and right (egocentric or allocentric) hemispace. The view of VSN as an attentional imbalance between two hemispaces ignores the fact that—in our daily life—we are presented with varying levels of stimulus density, within but also across hemispaces. Therefore, we developed a novel experimental paradigm in which stroke patients (n = 207) were presented with a different number of simple objects in the left and right (egocentric) hemispaces and were asked to indicate whether there were more objects in the left or the right hemispace. We systematically varied the density of visual stimuli to investigate whether a high level of stimulus density impairs task performance of patients with VSN to a larger degree than it does for patients without VSN. Error rate increased when more objects were presented in the display, but this effect was most pronounced in patients with VSN, especially when more objects were presented in their contralesional than in their ipsilesional hemispace. Our findings reveal that deficits in early visual processing in patients with VSN become especially apparent when overall stimulus density is high. The degree of stimulus density should therefore be taken into account when considering the impact of attentional deficits on activities in daily life.
In order to find our way in the world around us, we have to select the relevant information from the plethora of visual input projected on our retina. This selection process is referred to as visual attention. Patients with visuospatial neglect (VSN) are generally assumed to have an imbalance in visual attention between the two (egocentric or allocentric) hemispaces (Kinsbourne, Citation1987; Posner, Walker, Friedrich, & Rafal, Citation1984; Van der Stigchel & Nijboer, Citation2010), resulting in a failure (or slowness) to report, respond to, or orient to stimuli presented in especially the contralesional hemispace (Heilman & Valenstein, Citation1979). The idea of an imbalance between the two hemispaces is reflected in many of the measures to assess the severity of VSN, such as the difference score or center of cancellation in object cancellation tasks (Buxbaum et al., Citation2004; Ferber & Karnath, Citation2001; Rorden & Karnath, Citation2010). In such cancellation tasks, the omissions in the contralesional hemispace are compared to the omissions in the ipsilesional hemispace. For instance, in case of a difference score, the number of contralesional omissions is subtracted from the number of ipsilesional omissions.
The view of VSN as an attentional imbalance between the two hemispaces ignores the fact that in our daily life, we are presented with varying levels of stimulus density, within but also across hemispaces. For instance, a relatively visual stable environment, such as a sunset on an isolated beach, is associated with low levels of stimulus density, whereas a busy city center in which new objects appear and disappear in the hemispaces constantly—and, importantly, asymmetrically—has a high stimulus density. A situation with one stimulus in the contralesional field and no stimulation ipsilesionally can therefore not be compared to viewing 35 contralesional stimuli and 34 ipsilesional stimuli, even though the “difference score” is 1 in both situations. Only a few studies have varied the stimulus density in object cancellation tasks by varying the total number of items in the display. These studies have reported inconsistent findings, with Geldmacher and Hills (Citation1997) observing no effect on the number of omissions when there were more items in the display, whereas Chatterjee and colleagues (Citation1999) reported a clear effect of stimulus density on the severity of VSN as indicated by more omissions in the contralesional field. Furthermore, Husain and Kennard (Citation1997) suggested that an effect of stimulus density might be restricted to VSN patients with a frontal lesion. Other studies have exclusively varied the number of items in the ipsilesional field and observed that VSN is more severe (i.e., more contralesional omissions) with more ipsilesional items (Kartsounis & Findley, Citation1994; Pia, Ricci, Gindri, & Vallar, Citation2013). Overall, these studies have all used object cancellation tasks, which can be influenced by cognitive domains other than a lateralized imbalance in attention, such as working memory. Cancellation tasks depend heavily on working memory, as this task requires the active maintenance of a search template and of already visited locations (Husain & Rorden, Citation2003). Even though targets are permanently visible in cancellation tasks, memory of previously visited locations is required for an efficient and successful search strategy (Ten Brink, Van der Stigchel, et al., Citation2016; Ten Brink, Van der Stigchel, Visser-Meily, & Nijboer, Citation2016). There is indeed ample evidence that performance on cancellation tests is mediated by deficits in working memory, resulting in deficits on cancellation tests that are unrelated to any spatial bias (Husain et al., Citation2001; Mannan et al., Citation2005; Nys, Stuart, & Dijkerman, Citation2010; Rusconi, Maravita, Bottini, & Vallar, Citation2002; Wojciulik, Husain, Clarke, & Driver, Citation2001). Due to problems in working memory, patients with neglect frequently revisit targets (Mannan et al., Citation2005; Nys et al., Citation2010; Rusconi et al., Citation2002; Wojciulik et al., Citation2001) and have problems reporting whether a certain object is novel, which could result in an inefficient search (De Wit, Ten Brink, Visser-Meily, & Nijboer, Citation2018; Husain et al., Citation2001).
Additionally, previous studies on the influence of stimulus density have all been performed on a relatively small number of (selected) stroke patients and did not systematically vary levels of stimulus density in the total display. Here, we systematically varied the stimulus density in a large group of patients (n = 207) to investigate whether a high level of stimulus density impairs performance of patients with VSN to a larger degree than that of patients without VSN. We therefore developed a novel experimental paradigm in which participants are presented with different number of simple objects in the left and right (egocentric) hemispaces, and no visual search is required. This way, we isolated early visual processing and removed any potential influence of working memory deficits. Participants were asked to verbally indicate whether there were more objects in the left or the right hemispace. The difference in the number of objects between both hemispaces was determined by two staircase procedures, each for both hemispaces. Therefore, this task was automatically more difficult with accurate performance, which eliminated any ceiling effect, and became easier when a patient had a very strong spatial bias resulting in inaccurate responses, eliminating any floor effect. This way, we were able to pick up on subtle differences in the perception of stimulus density between the two hemispaces. Importantly, we varied the number of items in the total display between stimulus presentations, while keeping the difference in the number of stimuli between both hemispaces equal. This allowed us to compare performance on this stimulus density test between patients with VSN and patients without VSN, while patients were performing at individual threshold level due to the staircase. Because we were most interested in egocentric attentional deficits, a cancellation test was used to assess VSN. Shape cancellation tests are known to be most sensitive to capture egocentric attentional deficits when compared to, for example, line bisection tests (Ferber & Karnath, Citation2001; Vanier et al., Citation1990).
Method
Participants
We included stroke patients admitted for inpatient rehabilitation in De Hoogstraat Rehabilitation, from September 2012 to September 2013 and from May to November 2017. Within the first two weeks of admission, a neuropsychologist conducted a neglect screening (consisting of the object cancellation task and line bisection task) and administered measurements of balance for all stroke patients. Within the same week, the nurse observed the presence and severity of VSN during activities of daily living (ADL) with the Catherine Bergego Scale (CBS). Patients from this database were included in this study when they met the following criteria: (a) stroke (confirmed with a computed tomography, CT, or magnetic resonance imaging, MRI, scan) as a diagnosis; (b) aged above 18 years; (c) no severe deficits in communication and/or understanding; (d) normal or corrected-to-normal visual acuity.
Procedure
All patients performed a shape cancellation test and the stimulus density test in the same session. The order of the tests was counterbalanced across patients. The patients used their nonparetic arm to respond during the shape cancellation test and responded verbally in the stimulus density test.
Tests and outcome measures
Shape cancellation test
The shape cancellation test was used to determine whether a patient had VSN. This test consisted of 54 small shapes (0.6° × 0.6°; targets) among 75 distractor shapes of various sizes (with widths ranging from 0.95° to 2.1° and heights ranging from 0.45° to 0.95°). See for a layout of the shape cancellation test. The stimulus presentation was approximately 18.5° wide and 11° high. Participants were instructed to click all targets using the computer mouse and tell the examiner when they had completed the test. No time limit was given. After each mouse click a small circle appeared at the clicked location and remained on screen, regardless of whether a target, a distractor, or a location in between was clicked. Participants viewed the display monitor from a distance of 120 cm.
Figure 1. (a) Example of two possible stimulus displays during the stimulus density test. Participants were asked to verbally indicate whether there were more objects in the left or the right hemispace. (b) Layout of the shape cancellation test.
Stimulus density test
Patients were presented with different number of small filled circles (0.6° × 0.6°) in the left and right hemispaces (see ). They were asked to verbally indicate whether there were more circles in the left or the right hemispace. The neuropsychologist subsequently pressed either the “z” or the “m” key to indicate a left or a right response, respectively. Speed was not important, so no reaction times were measured.
For each patient, we measured the required difference between the number of objects to correctly perform the task (“threshold”). Two thresholds were determined: one for the left and one for the right hemispace. This was computed by a staircase procedure: When three correct answers were given in a row for a particular hemispace, we multiplied the threshold by 1.5. When an incorrect answer was given, we multiplied the threshold by 0.5. For both staircases, the initial threshold was set at 12 objects. The maximum number of items on one side was 23, making the maximum threshold 22. The test consisted of 80 trials. The sequence of trials was randomized. The stimulus display was presented for four seconds. Participants viewed the display monitor from a distance of 90 cm.
Other outcome measures
The included patient’s medical record was reviewed, and the following admission to rehabilitation data were captured: sex, age, lesion side, time post stroke onset in days, measures of cognitive functioning, motor strength of upper and lower extremities as measured with the Motricity Index (MI, arm and leg), presence of language communication deficits as measured with the SAN (“Stichting Afasie Nederland”), and independence in (basic) activities of daily living as measured with the Barthel Index (BI).
Global cognitive functioning was screened with either the Mini-Mental State Examination (MMSE, Folstein, Folstein, & McHugh, Citation1975) or the Montreal Cognitive Assessment (MoCA, Nasreddine et al., Citation2005). Both tests globally assess cognitive functioning, including memory, visuospatial abilities, executive functions, attention, language, and orientation in time and place. Scores range from 0 (no items right) up to 30 (all items right). For the first half of included patients, MMSE scores were obtained. Due to protocol changes in the rehabilitation center, MoCA scores were obtained for the second half of included patients. We converted MMSE scores into MoCA scores in order to create a single, pooled MoCA score. We applied the following formula: MoCA = (1.124 × MMSE) − 8.165 (Solomon et al., Citation2014).
The MI (Collin & Wade, Citation1990) is a short three-item test to administer loss of strength in the arm and leg. Scores range from 0 (no activity, paralysis) up to 33 (maximum normal muscle force) for each dimension; +1 gives a total score of 100.
The SAN is a short task of language communication. Scores range from 1 (no communication through language possible) to 7 (speech and understanding of language are unimpaired).
The BI (Collin, Wade, Davies, & Horne, Citation1988) measures the extent to which stroke patients can function independently in their ADL. Scores range from 0 (completely dependent) up to 20 (completely independent).
Analyses
Categorization
Patients with a difference score of two or more omissions between the two sides of the screen on the shape cancellation test (referred to as an “imbalance”) were defined as patients with VSN (see e.g., Van der Stoep et al., Citation2013). We specifically focused on the difference score in the number of omissions and not the total cancellation score, because the total cancellation score includes nonspatial deficits.
Demographic and stroke characteristics
Demographic and stroke characteristics were compared between VSN and non-VSN patients using independent t tests, except for gender and hemisphere of stroke. These percentages were compared using a chi-squared test.
Stimulus density test
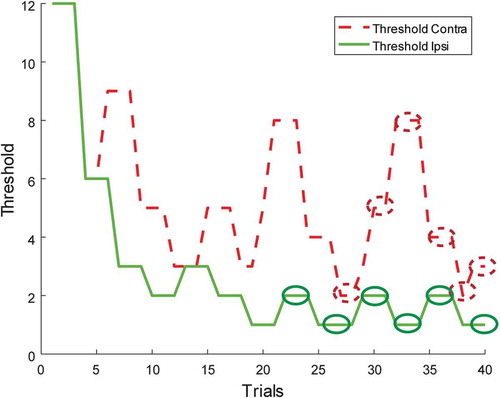
To investigate whether patients with VSN have more problems in the perception of stimulus density than patients without VSN, we compared performance on the stimulus density test between patients with VSN to patients without VSN. For each participant and for each hemispace, the thresholds of the last six turning points were examined. The thresholds were averaged to determine the point of subjective equality (PSE). See for a working example of a patient, showing the development of both thresholds throughout the task.
Figure 2. An example of a patient, showing the development of both thresholds throughout the task. For each threshold, the last six turning points are identified by the ellipses. These turning points were averaged to determine the point of subjective equality (PSE). To view a color version of this figure, please see the online issue of the Journal.
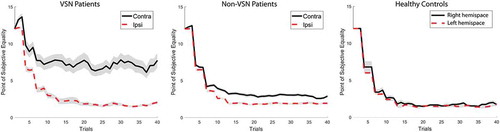
The cutoff score was determined by testing 15 healthy control participants on the same task (Mage = 52 years, SD = 12; 27% male). The control group was age-matched to the patient group, t(220) = 1.96, p > .05. In the control group, we computed the (absolute) difference between the PSE of both hemispaces for each participant. The cutoff score was then defined as the mean difference in PSE of the control group plus two and a half standard deviations (M = 0.61 objects, SD = 0.47). Variation in the healthy control group was very small with a standard deviation of the difference between the PSE of both hemispaces of less than 0.5 (see also ). We therefore decided that a larger control group was not required. There was no imbalance in the mean PSE between the left and right hemispaces, t(14) = 0.61, p = .55).
Figure 3. The progression of averaged point of subjective equality (PSE) scores for both hemispaces across the 80 trials for the visuospatial neglect (VSN) and non-VSN group, and the healthy control group (n = 15; % male = 27%; age = 52 years, SD = 12). Shaded areas indicate standard error of the mean. To view a color version of this figure, please see the online issue of the Journal.
For the patients, PSE difference scores were transformed such that a positive PSE difference referred to a higher contralesional threshold, whereas a negative PSE difference indicated a higher ipsilesional threshold. Patients who showed a PSE difference score that was larger than the cutoff score (±1.79 objects) were defined as showing a lateralized deficit on the stimulus density test.
To validate the cutoff score, we used Crawford and Howell’s significance test on differences between an individual’s score and that of a control sample to investigate whether the adopted cutoff value is indeed different from that of the control group (Crawford & Howell, Citation1998). By inserting our cutoff score and comparing it to that of the control sample, we could confirm that this cutoff score is indeed significantly different from that of the control sample (t = 2.43, p = .029; estimated percentage of normal population falling below individual’s score: 98.6%). This comparison is not significant for a cutoff score of two times the standard deviation above the mean (p = .073).
Shape cancellation test versus stimulus density test
To determine whether performance on the stimulus density test correlated with performance on the shape cancellation, we performed Pearson correlations between the PSE difference scores and the omission difference score of the shape cancellation test.
Hemisphere
As VSN is most dominantly associated with right-hemisphere damage (Ten Brink, Verwer, Biesbroek, Visser-Meily, & Nijboer, Citation2017), we compared performance on the different tests for patients with a right- and a left-hemisphere lesion.
Stimulus density
Although the difference in the number of stimuli between the two hemispaces on a given trial in the stimulus density test was determined by the current threshold for the left or right hemispace, the total number of stimuli in both hemispaces varied randomly between trials (minimum of three, maximum of 45). To determine whether the number of stimuli influenced performance, trials were divided into four bins based on the total number of stimuli on the screen, for each patient separately. Bin 1 contained the trials with the lowest number of stimuli (~10), and Bin 4 contained the trials with the highest number of stimuli (~38). Bins 2 and 3 contained trials with ~19 and ~29 stimuli, respectively. Subsequently, we measured accuracy for each of these four bins. To ensure a relatively stable threshold level, we only included the second half of the test (i.e., the final 20 trials for each threshold). This way, the analysis was not influenced by a varying threshold level. As can be seen in , the threshold was relatively stable after 20 trials.
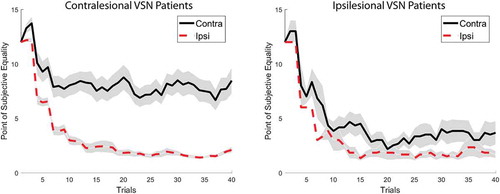
Figure 4. The progression of averaged point of subjective equality (PSE) scores for both hemispaces across the 80 trials for the contra- (n = 70) and ipsilesional (n = 6) visuospatial neglect (VSN) group. Shaded areas indicate standard error of the mean. To view a color version of this figure, please see the online issue of the Journal.
We expected performance to be poor for trials in which a high number of stimuli were presented (effect of bin). Given the known attentional imbalance between both hemispaces in VSN patients, we expected this effect of bin for these patients to be especially pronounced when there are more stimuli in the contralesional hemispace (compared to the ipsilesional hemispace). For these patients, the impaired attention for the contralesional hemispace makes it more difficult to determine whether there are more stimuli in the contralesional than in the ipsilesional field when stimulus density is larger.
To examine how the overall stimulus density influenced performance for the patients showing a contralesional deficit on the shape cancellation test and the stimulus density test (ipsilesional deficits were not analyzed), three groups were made: (a) deficit on both: patients showing a contralesional deficit on the shape cancellation test and the stimulus density test (n = 24); (b) deficit on stimulus density only: patients showing a contralesional deficit on the stimulus density test, but no deficit on the shape cancellation test (n = 44); (c) no deficit on either test: patients showing no deficit on either the shape cancellation test or the stimulus density test (n = 123). Note that there were no patients who only had a contralesional deficit on the shape cancellation test and not on the stimulus density test.
A repeated measures analysis of variance (ANOVA) was performed with group (deficit on both, deficit on stimulus density only, no deficit) as between-subjects variable and bin (1, 2, 3, 4) and stimulus side (more stimuli in contralesional hemispace, more stimuli in ipsilesional hemispace) as within-subjects variable.
For all t tests and ANOVAs on the stimulus density and shape cancellation test, we report effect size (Cohen’s d for t tests and eta-squared for ANOVAs).
Results
Demographic and stroke characteristics
A group of 207 patients was included in the study. Of the 207 included patients, 39 patients showed an imbalance of two or more omissions on the shape cancellation test and were therefore categorized as VSN (18.8%). Of these 39 patients with VSN, 33 patients had contralesional VSN (84.6%, mean difference score = 4.76, SD = 4.21), and six patients had ipsilesional VSN (15.4%, mean difference score = 2.33, SD = 0.52). For the non-VSN patients, the mean difference score was 0.09 (SD = 0.53). An overview of demographic and stroke characteristics is given in . Except for the MoCA (p = .03) and hemisphere of stroke (p = .01), none of the characteristics was significantly different between the two groups.
Table 1. Mean scores and standard deviations at demographical and stroke characteristics for non-VSN and the VSN group as indicated by their performances on the shape cancellation test.
Stimulus density test
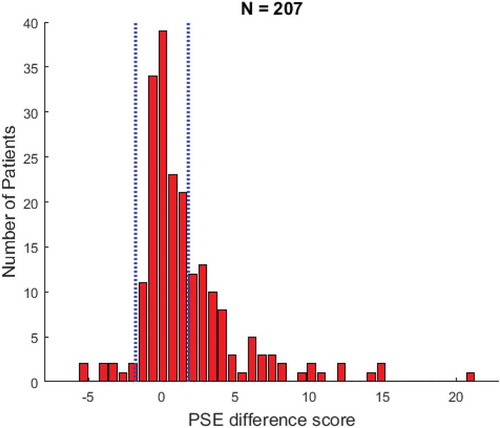
The average PSE difference score was 1.70 (SD = 3.54). The PSE difference scores for the patient group are represented in . Of all 207 patients, 78 patients (37.7%) had a PSE difference score that fell outside of the normal range of ±1.79 (as obtained in the control group). Of these patients with a deficit on the stimulus density test, 70 patients showed a contralesional deficit (89.7%), and eight showed an ipsilesional deficit (10.3%). The values here are difference scores between the PSE in the contra- and ipsilesional field.
Figure 5. Overview of the point of subjective equality (PSE) difference scores for all the included patients. Positive values refer to a PSE difference score in which the contralesional threshold is higher than the ipsilesional threshold. The cutoff scores are indicated by the vertical dashed lines. To view a color version of this figure, please see the online issue of the Journal.
For the sake of completeness, we therefore also analyzed the individual PSEs for both hemispaces. The average PSE in the contralesional field was 3.40 (SD = 3.02) and 1.99 for the ipsilesional hemispace (SD = 1.87).
Patients that were impaired on the shape cancellation test (i.e., VSN patients) had a larger PSE difference score (M = 5.15, SD = 5.33) than non-VSN patients (M = 0.89, SD = 2.36), t(205) = 7.66, p < .00001, d = 1.36. shows the progression of the averaged PSE scores for both hemispaces across the 80 trials for both groups. Although the ipsilesional threshold stays constant and low in both groups, the contralesional threshold fluctuates and levels out at around four objects for the non-VSN patients and seven objects for the VSN patients.
The imbalance is predominantly present in the contralesional VSN group (n = 33), as can be observed in . The imbalance in the ipsilesional VSN group (n = 6) is comparable to the imbalance in the non-VSN group, t(172) = 0.67, p = .50, d = 0.28.
Interestingly, the between-subjects variability of the PSE difference score was larger for the VSN patients (5.3) than for the non-VSN patients (2.4). Splitting on side, this difference observed to be restrictively due to the large variability of the contralesional VSN patients (5.5), as the variability of the ipsilesional VSN patients (2.5) was comparable to that of the non-VSN patients (2.4).
Overall, 44 of the 207 stroke patients showed a significant imbalance on the stimulus density test, but were unimpaired on the shape cancellation task.
Shape cancellation test versus stimulus density test
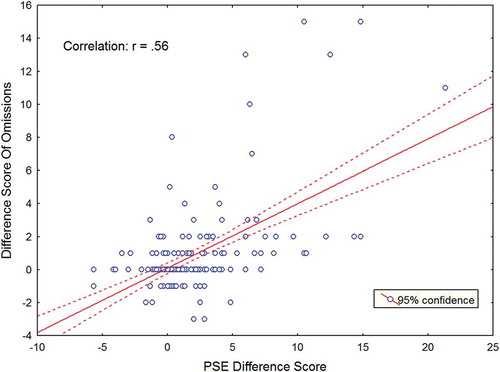
A highly significant correlation was obtained between the omission difference score on the shape cancellation test and the PSE difference score on the stimulus density test for all patients (r = .56, p < .0001). This correlation is illustrated in . The reported correlation indicates that the larger the asymmetry between the omissions in both hemispaces (i.e., more severe VSN) as measured with the shape cancellation task, the larger the PSE difference value was with a higher threshold for the contralesional hemifield.
Figure 6. Correlation between the omission difference score and the point of subjective equality (PSE) difference value. The red line indicates the line of best fit. To view a color version of this figure, please see the online issue of the Journal.
Both tests did not correlate significantly with the Barthel Index, an index of the extent to which stroke patients can function independently in their ADL (shape cancellation test, r = −.04, p = .65; stimulus density test, r = −.07, p = .38).
Hemisphere
The groups with a right- and a left-hemisphere lesion were comparable in size (101 left-hemisphere lesions vs. 106 right-hemisphere lesions). A small majority of the patients that were impaired at the stimulus density test had a right-hemisphere lesion (56.4%). A stronger imbalance between the two hemispheres was observed for the shape cancellation test: 69.2% of patients that were impaired on the shape cancellation test had a right-hemisphere lesion. VSN patients with right-hemisphere damage had a stronger PSE difference score (M = 6.29, SD = 5.66) than VSN patients with left-hemisphere damage (M = 2.60, SD = 3.50), t(37) = 2.08, p < .05, d = 0.72, consistent with the known association between the severity of the lateralized attention deficit and the right hemisphere (Ten Brink et al., Citation2017).
Stimulus density
A repeated measures ANOVA with group (deficit on both, deficit on stimulus density only, no deficit) as between-subjects variable and bin (1, 2, 3, 4) and stimulus side (more stimuli in contralesional hemispace, more stimuli in ipsilesional hemispace) as within-subjects variable resulted in a highly significant three-way interaction, F(5, 564) = 14.624, p < .0001, η2 = .11. We therefore analyzed the effect of bin and group separately for the contra- and ipsilesional hemispace (i.e., whether there were more stimuli in the contra- or ipsilesional hemispace). See for a visualization of this interaction.
Figure 7. Performance on the stimulus density test as a function of the total number of stimuli in the hemispace for three different groups: (a) Deficit on both (patients showing a contralesional deficit on the shape cancellation test and the stimulus density test); (b) Deficit on stimulus density only (patients showing a contralesional deficit on the stimulus density test, but no deficit on the shape cancellation test); (c) No deficit (patients showing no deficit on either the shape cancellation test or the stimulus density test). This analysis was split for thresholds for the contralesional hemispace (left graph) and the ipsilesional hemispace (right graph). Error bars indicate standard error of the mean. To view a color version of this figure, please see the online issue of the Journal.
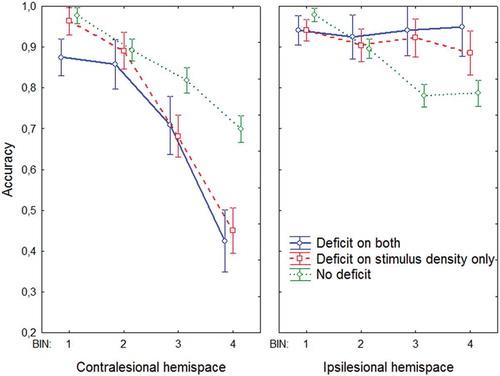
Contralesional hemispace
There was a main effect of group, F(2, 188) = 47.976, p < .0001, η2 = .34, caused by the finding that the no deficit group had a higher accuracy than the other groups, and a main effect of bin, F(3, 564) = 161.05, p < .0001, η2 = .44, with a decrease in accuracy as a function of bin (i.e., increased task complexity).
Importantly, there was a significant interaction between group and bin, F(6, 564) = 10.627, p < .0001, η2 = .06: The effect of bin was stronger for both deficit groups than for the no deficit group. So, although performance decreased as a function of bin for each group, this effect was most pronounced when a deficit was observed on the stimulus density test. Indeed, there was no difference between the two deficit groups, F(1, 66) = 1.70, p = .20, η2 = .03, and no interaction between bin and the two deficit groups, F(3, 198) = 1.01, p = .39, η2 = .01. However, these latter two comparisons were highly significant for the no deficit group, when contrasted with the two deficit groups (ps < .0001). To summarize, the effect of bin was strongest for the groups in which there was a deficit on the stimulus density test.
Ipsilesional hemispace
There was a main effect of group, F(2, 188) = 18.949, p < .0001, η2 = .17, in that performance was worse for the no deficit group than for the other groups, and a main effect of bin, F(3, 564) = 7.414, p < .0001, η2 = .04, with a decrease in accuracy as a function of bin.
Importantly, there was a significant interaction between group and bin, F(6, 564) = 8.091, p < .0001, η2 = .08. Here, the effect of bin was only observed for the no deficit group and not in both deficit groups: There was no significant effect of bin in the two deficit groups (F < 1), but there was a significant effect of bin in the no deficit group, F(3, 366) = 43.867, p < .0001, η2 = .26. Again, both deficit groups did not differ significantly, F(1, 66) = 1.9077, p = .17, η2 = .03, or interacted significantly with bin (F < 1).
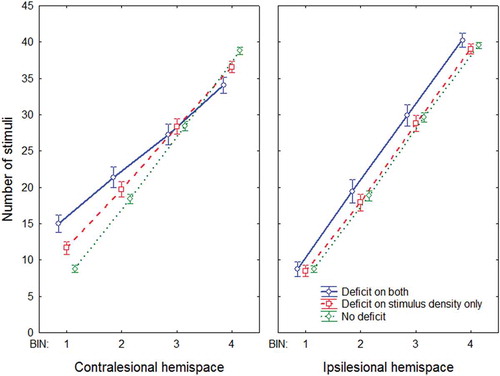
Given the increased threshold for the patients with a deficit on the stimulus density test, the total number of stimuli in the different bins varied between the groups. This could potentially be a confound in these analyses. However, as can be seen in , these differences in the number of stimuli in each bin cannot explain the impaired performance of the deficit groups when more stimuli are presented. The total number of stimuli was actually lower for the deficit groups in the bins in which their performance was most impaired compared to that of the no deficit group. This is due to the fact that we allowed a maximum total number of stimuli to be presented on the screen (i.e., 45): A high threshold (e.g., 20) therefore results in fewer possible combinations in which a high number of stimuli can be presented on the screen.
Figure 8. Number of stimuli in the different bins displayed in . Error bars indicate standard error of the mean. To view a color version of this figure, please see the online issue of the Journal.
General discussion
The aim of the present study was to investigate whether a high level of stimulus density impairs performance of patients with VSN to a larger degree than that of patients without VSN. To this end, we developed a novel experimental paradigm in which patients had to indicate whether there were more objects in their left or right hemispace. Error rate increased when more objects were presented in the display, but this effect was most pronounced in patients with VSN, especially when more objects were presented in their contralesional than in their ipsilesional hemispace.
Patients with VSN were overall impaired in performing the stimulus density test, as revealed by higher thresholds than those for the patients without VSN, most predominantly for the contralesional hemispace. So, even though the current task did not require visual search based on a target template, a deficit was still apparent in patients with VSN. This is interesting, given that visual search requires a multitude of cognitive processes, such as identifying objects, inhibiting distractors, keeping an active search template, and comparing the search template with the object that is currently in attentional focus (Wolfe, Citation1998). All these processes require visual attention, which makes it difficult to determine which aspect of the visual search process is affected in patients with VSN. Here, we isolated the early visual processing by requiring patients only to compare stimulus density between the two hemispaces. The finding that these early (visual) processing stages are already impaired in VSN is consistent with previous studies on judgments of temporal order (Rorden, Mattingley, Karnath, & Driver, Citation1997; Sinnett, Juncadella, Rafal, Azanon, & Soto-Faraco, Citation2007; Van der Stigchel & Nijboer, Citation2018), which have revealed a spatial bias in favor of the ipsilesional hemispace in patients with VSN. These deficits in early visual processing become especially apparent when overall stimulus density is high. Furthermore, the deficits on the stimulus density test were more frequently observed in patients with damage to the right hemisphere, in line with the fact that VSN is most dominantly associated with right-hemisphere damage (Heilman & Van Den Abell, Citation1980; Ten Brink et al., Citation2017).
The impaired performance in patients with VSN when the overall stimulus density was high cannot be explained by differences in task difficulty between the different groups: For each individual patient, we used a staircase procedure to determine the difference in the presented objects between both hemispaces. This way, patients were performing at their own threshold level, keeping task difficulty equal between the groups and excluding an explanation in terms of a ceiling effect. For instance, the absence of a ceiling effect can clearly be observed in the non-VSN patient group, who had a comparable accuracy to that of our healthy control group and had an accuracy level of about 75% for the trials with the highest overall stimulus density, leaving room for improved performance.
Overall, 44 of the 207 stroke patients showed a significant imbalance on the stimulus density test, but were unimpaired on the shape cancellation task. There are three possible reasons for this distinction. First, it could be that the stimulus density test is more sensitive in revealing differences in visual processing after stroke than the shape cancellation test. In contrast to the shape cancellation test, we used a staircase procedure in the stimulus density test, eliminating any floor effects and increasing the chance of observing a deficit in a given patient. Second, the current cutoff score for the stimulus density test was based on a relatively small sample of healthy controls, which could make this score inaccurate. It should be noted, however, that there was little variance in our healthy control group, so adding more controls will unlikely have a major impact on the current cutoff scores. Furthermore, it could be that this cutoff score is more liberal than the adopted standard cutoff score for the shape cancellation, resulting in more patients being categorized as having a deficit on the stimulus density test than on the shape cancellation test.
The effect of overall stimulus density in patients with VSN was only observed when there were more objects in the contralesional field and not when there were objects in the ipsilesional field. Non-VSN patients actually performed worse than patients with VSN when there were objects in the ipsilesional hemispace. Although this might sound surprising at first glance, this can quite easily be explained by the notion that the task requires a comparison between both hemispaces. If there is a tendency to underestimate the number of objects in the contralesional hemispace due to an imbalance in visual attention, it automatically follows that the number of objects in the ipsilesional hemispace is overestimated—or at least the consequence is that the number of objects in that field is judged as larger, even without overestimating—resulting in low error rates when more objects are presented in the ipsilesional hemispace.
From a clinical viewpoint, it is interesting to note that thresholds in the different groups were already relatively stable after around 20 trials for each threshold (see ). Although we do not want to argue that a stimulus density test should be included in a standard neglect assessment (given the strong observed correlation with the shape cancellation task and the lack of significant correlation with an index of the difficulties in activities in daily life), the current methods do provide opportunities for new neuropsychological tasks with a staircase procedure. Neuropsychological tests are currently generally implemented as paper-and-pencil tests. Because of the rise of affordable and portable devices, an increase in computerized tests might be expected (Kane & Kay, Citation1992; Smit et al., Citation2013). In computerized tests, such as the current stimulus density test, the thresholds can be modified based on a patient’s performance during the assessment using a staircase procedure. This results in a sensitive measure in which the chances of ceiling or floor effects are minimized.
Interestingly, we observed a subset of patients with an ipsilesional deficit on the stimulus density test, although the percentage of patients with an ipsilesional deficit was comparable to the percentage of patients showing a deficit on the shape cancellation test (around 10% of the total number of patients with a deficit on the stimulus density test and around 15% of the total number of patients with a deficit on the cancellation test). This percentage is consistent with previous observations that ipsilesional neglect is relatively rare (Kim et al., Citation1999; Kwon & Heilman, Citation1991). Our results reveal that the observed deficit on the stimulus density test was smaller for the ipsilesional VSN patients than for the contralesional VSN patients. This might seem to suggest that ipsilesional neglect is less influenced by varying levels of stimulus density, although we warrant caution in interpreting this finding too strongly, given the low number of patients with an ipsilesional deficit.
In contrast to the relatively controlled environment of an experimental laboratory, our daily world is not always stable and is associated with varying levels of stimulus density. Here, we only varied the visual domain and ignored the multisensory stimulation that we are bombarded with the moment we leave our house. So, even though the extent of stimulus density was still limited in the present study, it does reveal that these aspects should be taken into account when considering the impact of attentional deficits on activities in daily life.
Acknowledgments
We would like to thank Nathan van der Stoep for programming the tasks and the research assistants for their help in testing the patients.
Disclosure statement
No potential conflict of interest was reported by the authors.
Additional information
Funding
References
- Buxbaum, L. J., Ferraro, M. K., Veramonti, T., Farne, A., Whyte, J., Ladavas, E., … Coslett, H. B. (2004). Hemispatial neglect: Subtypes, neuroanatomy, and disability. Neurology, 9(62), 749–756.
- Chatterjee, A., Thompson, K. A., & Ricci, R. (1999). Quantitative analysis of cancellation tasks in neglect. Cortex, 35, 253–262.
- Collin, C., & Wade, D. (1990). Assessing motor impairment after stroke: A pilot reliability study. Journal of Neurology, Neurosurgery, and Psychiatry, 53(7), 576–579.
- Collin, C., Wade, D. T., Davies, S., & Horne, V. (1988). The Barthel ADL Index: A reliability study. International Disability Studies, 10(2), 61–63.
- Crawford, J. R., & Howell, D. C. (1998). Comparing an individual’s test score against norms derived from small samples. The Clinical Neuropsychologist, 12, 482–486.
- De Wit, L., Ten Brink, A. F., Visser-Meily, J. M. A., & Nijboer, T. C. W. (2018). Does prism adaptation affect visual search in spatial neglect patients: A systematic review. Journal of Neuropsychology, 12(1), 53–77.
- Ferber, S., & Karnath, H. (2001). How to assess spatial neglect – Line bisection or cancellation tasks? Journal of Clinical and Experimental Neuropsychology, 5, 599–607.
- Folstein, M. F., Folstein, S. E., & McHugh, P. R. (1975). “Mini-mental state”. A practical method for grading the cognitive state of patients for the clinician. Journal of Psychiatric Research, 12, 189–198.
- Geldmacher, D. S., & Hills, E. C. (1997). Effect of stimulus number, target-to-distractor ratio, and motor speed on visual spatial search quality following traumatic brain injury. Brain Injury, 11(1), 59–66.
- Heilman, K. M., & Valenstein, E. (1979). Mechanisms underlying hemispatial neglect. Annals of Neurology, 5(2), 166–170.
- Heilman, K. M., & Van Den Abell, T. (1980). Right hemispheric dominance for attention: The mechanism underlying hemispheric asymmetries of inattention (neglect). Neurology, 30, 327–330.
- Husain, M., & Kennard, C. (1997). Distractor-dependent frontal neglect. Neuropsychologia, 36(6), 829–841.
- Husain, M., Mannan, S., Hodgson, T. L., Wojciulik, E., Driver, J., & Kennard, C. (2001). Impaired spatial working memory across saccades contributes to abnormal search in parietal neglect. Brain, 124(5), 941–952.
- Husain, M., & Rorden, C. (2003). Non-spatially lateralized mechanisms in hemispatial neglect. Nature Reviews Neuroscience, 4, 26–36.
- Kane, R. L., & Kay, G. G. (1992). Computerized assessment in neuropsychology: A review of tests and test batteries. Neuropsychology Review, 3(1), 1–117.
- Kartsounis, L. D., & Findley, L. J. (1994). Task specific visuospatial neglect related to density and salience of stimuli. Cortex, 30(4), 647–659.
- Kim, M., Na, D. L., Kim, G. M., Adair, J. C., Lee, K. H., & Heilman, K. M. (1999). Ipsilesional neglect: Behavioural and anatomical features. Journal of Neurology, Neurosurgery & Psychiatry, 67, 35–38.
- Kinsbourne, M. (1987). Mechanisms of unilateral neglect. In M. Jeannerod (Ed.), Neurophysiological and neuropsychological aspects of spatial neglect (pp. 69–86). Amsterdam: Elsevier Science Publishers.
- Kwon, S. E., & Heilman, K. M. (1991). Ipsilateral neglect in a patient following a unilateral frontal lesion. Neurology, 41, 2001–2004.
- Mannan, S. K., Mort, D. J., Hodgson, T. L., Driver, J., Kennard, C., & Husain, M. (2005). Revisiting previously searched locations in visual neglect: Role of right parietal and frontal lesions in misjudging old locations as new. Journal of Cognitive Neuroscience, 17(2), 340–354.
- Nasreddine, Z. S., Phillips, N. A., Bedirian, V., Charbonneau, S., Whitehead, V., Collin, I., … Chertkow, H. (2005). The montreal cognitive assessment, MoCA: A brief screening. Journal of the American Geriatrics Society, 53, 695–699.
- Nys, G. M., Stuart, M., & Dijkerman, H. C. (2010). Repetitive exploration towards locations that no longer carry a target in patients with neglect. Journal of Neuropsychology, 4(1), 33–45.
- Pia, L., Ricci, R., Gindri, P., & Vallar, G. (2013). Drawing perseveration in neglect: Effects of target density. Journal of Neuropsychology, 7, 45–57.
- Posner, M. I., Walker, J. A., Friedrich, F. J., & Rafal, R. D. (1984). Effects of parietal injury on covert orienting of attention. The Journal of Neuroscience, 4, 1863–1874.
- Rorden, C., & Karnath, H. O. (2010). A simple measure of neglect severity. Neuropsychologia, 48, 2758–2763.
- Rorden, C., Mattingley, J. B., Karnath, H. O., & Driver, J. (1997). Visual extinction and prior entry: Impaired perception of temporal order with intact motion perception after unilateral parietal damage. Neuropsychologia, 35, 421–433.
- Rusconi, M. L., Maravita, A., Bottini, G., & Vallar, G. (2002). Is the intact side really intact? Perseverative responses in patients with unilateral neglect: A productive manifestation. Neuropsychologia, 40(6), 594–604.
- Sinnett, S., Juncadella, M., Rafal, R., Azanon, E., & Soto-Faraco, S. (2007). A dissociation between visual and auditory hemi-inattention: Evidence from temporal order judgements. Neuropsychologia, 45, 552–560.
- Smit, M., Van der Stigchel, S., Visser-Meily, A., Kouwenhoven, M., Eijsackers, A. L. H., & Nijboer, T. C. W. (2013). The feasibility of computer-based prism adaptation to ameliorate neglect in sub-acute stroke patients admitted to a rehabilitation center. Frontiers in Human Neuroscience, 7(353).
- Solomon, T. M., DeBros, G. B., Budson, A. E., Mirkovic, N., Murphy, C. A., & Solomon, P. R. (2014). Correlational analysis of 5 commonly used measures of cognitive functioning and mental status: An update. American Journal of Alzheimer’s Disease and Other Dementias, 29(8), 718–722.
- Ten Brink, A. F., Biesbroek, J. M., Kuijf, H. J., Van der Stigchel, S., Oort, Q., Visser-Meily, J. M. A., & Nijboer, T. C. W. (2016). The right hemisphere is dominant in organization of visual search - a study in stroke patients. Behavioural Brain Research, 304, 71–79.
- Ten Brink, A. F., Van der Stigchel, S., Visser-Meily, A., & Nijboer, T. C. W. (2016). You never know where you are going until you know where you have been: Disorganized search after stroke. Journal of Neuropsychology, 10, 256–275.
- Ten Brink, A. F., Verwer, J., Biesbroek, J. M., Visser-Meily, J. M. A., & Nijboer, T. C. W. (2017). Differences between left and right-sided neglect revisited: A large cohort study across multiple domains. Journal of Clinical and Experimental Neuropsychology, 39(7), 707–723.
- Van der Stigchel, S., & Nijboer, T. C. W. (2010). The imbalance of oculomotor capture in unilateral visual neglect. Consciousness and Cognition, 19(1), 186–197.
- Van der Stigchel, S., & Nijboer, T. C. W. (2018). Temporal order judgments as a sensitive measure of the spatial bias in patients with visuo-spatial neglect. Journal of Neuropsychology, 12(3), 427–441.
- Van der Stoep, N., Visser-Meily, A., Kappelle, L. J., de Kort, P. L. M., Huisman, K. D., Eijsackers, A. L. H., … Nijboer, T. C. W. (2013). Exploring near and far regions of space: Distance specific visuospatial neglect after stroke. Journal of Clinical and Experimental Neuropsychology, 35(8), 799–811.
- Vanier, M., Gauthier, L., Lambert, J., Pepin, E. P., Robillard, A., Dubouloz, C. J., … Joanette, Y. (1990). Evaluation of left visuospatial neglect: Norms and discrimination power of two tests. Neuropsychology, 4, 87–96.
- Wojciulik, E., Husain, M., Clarke, K., & Driver, J. (2001). Spatial working memory deficit in unilateral neglect. Neuropsychologia, 39, 390–396.
- Wolfe, J. M. (1998). Visual Search. In H. Pashler (Ed.), Attention (pp. 13–74). East Sussex, UK: Psychology Press Ltd.