
ABSTRACT
Typically, developing humans innately place subjective value on social information and orient attention to it. This can be shown through tracking of gaze patterns and pupil size, the latter of which taps into an individual’s cognitive engagement and affective arousal. People with Autism Spectrum Disorder (ASD) present with atypical social, communicative and behavioral patterns, but underlying substrates of these behavioral differences remain unclear. Moreover, due to high comorbidity with other neurodevelopmental disorders, it is often difficult to distinguish which differences are distinctive to ASD. In this study, a group of 35 adolescents and young adults with neurodevelopmental disorders were tested to investigate the processing of social and non-social scenes in individuals who meet the diagnostic criteria for autism and those who do not. Eye tracking and pupillometry measures were collected while participants observed images of tightly controlled natural scenes with or without a human being. Contrary to individuals without autism diagnosis, participants with autism did not show greater pupillary response to images with a human. Participants with autism were slower to fixate on social elements in the social scenes, and this latency metric correlated with clinical measures of poor social functioning. The results confirm the clinical relevance of eye-tracking and pupillometric indices in the field of ASD. We discuss the clinical implications of the results and propose that analysis of changes in visual attention and physiological level to social stimuli might be an integral part of a neurodevelopmental assessment.
Introduction
Humans are a social species. We live and thrive in large social groups and exhibit collective behavior, which provides a number of evolutionary advantages. The evolution of the human brain is very closely linked with the increasing complexity of social interactions and the cognitive abilities they require (Emery, Citation2000). In primates, the primary cues for these processes rely on visual input, which has led to an increasingly elaborate visual social processing system including more than 30 brain regions in humans (Adolphs, Citation2009; Emery, Citation2000).
Eye tracking studies have shown that typically developing (TD) humans have an innate tendency to attend to the central facial region of other humans regardless of scene complexity or salience of other, non-social objects (Birmingham, Bischof, & Kingstone, Citation2009; Constantino et al., Citation2017). The attentional bias for faces and other social stimuli is present from infancy (Amso, Haas, & Markant, Citation2014; Chita-Tegmark, Citation2016; Constantino et al., 2017; Fitzgerald, Citation1968; Kelly, Duarte, Meary, Bindemann, & Pascalis, Citation2019), possibly as early as the third trimester of fetal life (Reid et al., Citation2017).
In addition to eye tracking, social processing is observable through pupillometry due to its control by sympathetic arousal systems and resulting physiological association with cognitive engagement and affective arousal (Bradley, Miccoli, Escrig, & Lang, Citation2008; Laeng, Sirois, & Gredebäck, Citation2012). One central mechanism of this association is the locus coeruleus (LC) – norepinephrine (NE) system. The LC, a noradrenergic “hub” used in the brain as a pacemaker for attentional processes, also controls the muscles in the iris (Laeng et al., Citation2012), and changes in pupil diameter have been shown to directly correlate with activation changes in LC neurons that signify attentional shifts (Laeng et al., Citation2012; Rajkowski, Majczynski, Clayton & Aston-Jones, Citation2004). This psychophysiological signature is also presumed to reveal social processing development and differences, as social perception is a product of attentional shifts due to the prioritized attention placed on social stimuli (Bast, Poustka, & Freitag, Citation2018). Indeed, it has been shown that infants as young as one month show differential (larger) pupil dilation in response to social vs. non-social stimuli (Fitzgerald, Citation1968). Moreover, pupillometry has been argued to be an especially useful tool for studying non- or low-verbal populations such as infants and individuals with developmental disorders affecting social skills and processes (Graur & Siegle, Citation2013). Notably, Graur and Siegle (Citation2013) suggest that pupillometry has moved from being a basic research tool toward a clinical use in the domain of psychiatry, and that this development might be instrumental in linking neuroscience and psychiatric clinical practice more closely together.
Autism Spectrum Disorder (ASD) is a neurodevelopmental disorder characterized by a number of social-communication deficits with restricted and repetitive behaviors and interests (American Psychiatric Association, Citation2013). Among the most prominent social deficits in ASD is a reduced ability to use social cues from facial expressions and body language for learning and social interactions. Although results from different studies have been mixed, atypical facial gaze patterns and eye contact are among the most discernible indications of social impairments in ASD, described already in the first descriptions of the disorder (Kanner, Citation1944), and included in standardized diagnostic criteria including the DSM-V (American Psychiatric Association, Citation2013). With single faces as stimuli, atypical social gaze in ASD patients has been observed as early as in toddlerhood and in high-risk infants even prior to diagnosis (cf., Hutt & Ounsted, Citation1966; Senju & Johnson, Citation2009). Decreased social attention in ASD has also been shown in studies using videos of social scenes versus geometric shapes (Crawford et al., Citation2016), images of scenes containing people (Constantin et al., 2017; Riby & Hancock, Citation2008), and films of social interactions (Klin, Jones, Schultz, Volkmar, & Cohen, Citation2002). As mentioned, however, previous results are also quite mixed, as many similarities in looking times at faces for ASD and TD individuals were found in several other studies (Chawarska, Macari, & Shic, Citation2012; Freeth, Chapman, Ropar, & Mitchell, Citation2010;). Notably, Freeth et al. (Citation2010) found that in complex scenes containing one person, ASD individuals were slower to fixate to faces than TD controls, but once fixated, both groups spent comparable time looking at faces. This highlights the potential importance of an analytical distinction between latency of orienting versus time of exploration in studies of visual social perception in ASD.
Most eye-tracking equipment also records pupil size data, though these data have quite rarely been used until relatively recently in ASD research. Studies using pupillometry have suggested reduced cognitive engagement and/or affective arousal in ASD during social processing, as indicated by decreased pupil diameter in ASD participants compared to controls in response to faces (Anderson, Colombo, & Shaddy, Citation2006; Martineau et al., Citation2011) as well as in response to dynamic social videos (Muller, Baumeister, Dziobek, Banaschewski, & Poustka, Citation2016). By contrast, Wagner, Luyster, Tager-Flusberg and Nelson (Citation2016) found that infants at high-risk for ASD showed increased pupil dilation in response to emotionally expressive faces compared to low-risk controls, suggesting heightened cognitive/affective arousal in ASD. The differences in results reflect a larger contested question in autism research, namely, whether the atypical social processing in ASD is due to a relative indifference or due to an overarousal to socio-affective information such as eye contact (e.g., Hadjikhani et al., Citation2017).
Complicating the issue further, it has become well established in the past decade that ASD is highly comorbid and shares symptoms, genes, and environmental risk factors with other neurodevelopmental disorders to the extent that according to Gillberg (Citation2010), all can be said to fall under the umbrella term “Early Symptomatic Syndromes Eliciting Neurodevelopmental Clinical Evaluation – ESSENCE”. For this reason, it is often difficult – yet highly relevant from both research and clinical perspectives – to determine psychophysiological mechanisms associated with social processing differences in ASD and in other commonly comorbid disorders.
The aim of the current study was to characterize the gaze patterns and the psychophysiological underpinnings of social processing in ASD by comparing findings with those of other neurodevelopmental/ESSENCE disorders. We examined the visual scanning pattern and pupil dilation in response to tightly controlled social and non-social images of a group of adolescents with either a diagnosis of ASD or another ESSENCE diagnosis (e.g., ADHD, dyslexia). Considering the existing literature highlighting the extent of social impairments in ASD, it was expected that the ASD group would take longer to fixate to, and possibly spend less time fixating on social elements of the scenes. In addressing the scarcity and lack of clarity in prior research, pupil size changes were also investigated in order to evaluate cognitive engagement/affective arousal in response to social and non-social visual stimuli. Finally, correlational investigation was carried out to examine the extent that a participant’s social symptom severity scores, according to the clinical assessment, associate with their scanning and pupil size characteristics.
Methods
Participants
The targeted group consisted of 37 adolescents who had been referred to the Child Neuropsychiatric Clinic (CNC) in Gothenburg, Sweden between year 2005 and 2009. These individuals had received childhood diagnosis of ASD and/or another ESSENCE disorder(s) at the time of initial assessment. All diagnoses were based on criteria from the DSM-IV TR (in the DSM IV TR, the Autism Spectrum Disorder was coined Pervasive Developmental Disorder, with several subcategories such as autistic disorder, Asperger syndrome, etc). A follow-up evaluation was carried out at the time of this study in which participants were re-evaluated for a variety of factors including diagnosis, IQ, social functioning, cognitive functioning, well-being, and social perception (eye-tracking and pupillometry).
One participant was excluded from the study due to experimenter error during the registration leaving the final sample size for this study at N = 36 (9 females, 27 males).
The age range for the participants was 12.9–20.0 years (M = 16.45, SD = 1.65). The IQ range for this group, based on either the Wechsler Intelligence Scale for Children – Fourth Edition (WISC-IV) (Wechseler, Citation2003a) or the Wechsler Adult Intelligence Scale (WAIS-IV) (Wechseler, Citation2003b), was variable, 65 − 120 (M = 90.6, SD = 12.5). IQ score was unreported for one subject.
The subjects were categorized according to two main diagnostic subgroups: ASD (n= 23) and non-ASD (n = 13). The non-ASD group displayed subtler, yet still a variety of, often comorbid neurodevelopmental diagnoses. Specifically, all 13 individuals had a diagnosis of ADHD. Among these, two also received a specific reading disability/dyslexia diagnosis and two had borderline intellectual functioning.
No difference was found between the two groups regarding age (p = .361) or IQ (p = 1.0).
Standard clinical metrics/assessment
The Five to Fifteen (FTF/5–15) questionnaire (Kadesjö et al., Citation2004) was given at the follow up. The FTF is a parental questionnaire developed to assess development and behavioral difficulties in children and adolescents consisting of the following eight domains: motor function, attention/executive function, language, memory, learning, social competence, internalizing and externalizing behavior problems. For the purposes of this study, the social competence scores were used in data analysis. Items are scored from 0 (does not apply), 1 (applies sometimes or to some extent), or 2 (definitely applies); and thus, the higher the number of a patient’s score, the lower the functioning of the child within the given domain. Scores are unreported for three individuals in the non-ASD group. In this study sample, FTF social competence scores in the ASD group ranged from 0.19 to 1.37 (M= 0.83; SD = 0.34) and in the non-ASD group scores were 0–0.63 (M = 0.17; SD = 0.21). The difference was significant (p < .001) between groups, which is to be expected since a key diagnostic factor in ASD is poor social functioning.
The Global Assessment of Functioning (GAF) (Yamauchi, Ono, & Ikegami, Citation2001) is a clinical assessment of a patient’s overall level of functioning, on a scale ranging from 1 to 100 (ranging from extremely low functioning/risk for one’s own life to superior functioning). Physical and environmental limitations are not assessed; rather it is a scale of a patient’s social, communication, psychological, and occupational functioning. In the ASD group, the GAF scores ranged from 45 to 65 (M= 54.83; SD = 6.01). In the non-ASD group, GAF scores ranged from 45 to 75 (M = 61.92; SD = 9.67). There was a between-group difference (p < .05) for GAF scores in this sample, with the ASD group overall having lower functioning that the non-ASD group.
The Vineland Adaptive Behavioral Scale (VABS) (Sparrow, Cicchetti, & Balla, Citation2005) is a ranking of adaptive functioning given by a patient’s caregiver and covers four general domains: Daily Living, Communication, and Socialization. This study utilized the patients’ socialization scores on the VABS scale. Scores are unreported for six individuals (two ASD and four non-ASD). In the ASD group, the VABS social scores ranged from 56 to 107 (M = 80.48; SD = 15.52). The non-ASD group scores ranged from 92 to 113 (M = 106.00; SD = 8.35). There was a between-group difference on this scale as well (p < .001), again expected due to the overall low social functioning that is a defining characteristic of ASD.
Apparatus
Gaze and pupil information were measured with a Tobii T120 (Tobii Technology Inc., Stockholm, Sweden), which records near-infrared reflections of both eyes at 60 Hz as the subject watches an integrated 17-in. monitor. Subjects were seated 60 cm away from the monitor. A 9-point calibration procedure was used before the experiment, in which a small animated object is shown to the participant and collects data at nine points on the screen, repeating until data are collected for all points to ensure proper calibration.
Stimuli
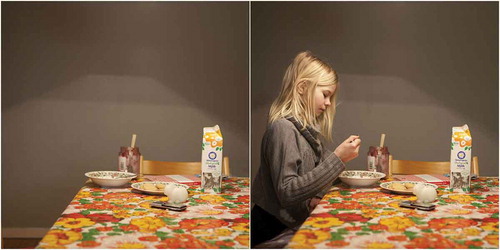
We developed and used a total of 22 images, divided into 11 pairs. Each pair consisted of the same scene with (social) and without (non-social) a person present in the image. Stimuli were tightly controlled: other than presence or absence of a person, the scenes within each pair were identical (see ). Subjects were divided into two groups, version A and version B, and shown a series of 11 images. Version A contained six social images and five non-social images, and version B contained five social images and six non-social images. No subject was shown two images within the same pair to avoid conflicting gaze patterns due to image recognition.
Figure 1. Examples of the non-social (left) and social (right) images used in the study.
Procedure
After arriving at the Gillberg Neuropsychiatry Centre, subjects were seated approximately 60 cm from a monitor in a dimly lit, sound-proof testing room which had no natural light source. All participants completed and passed the standard 9-point calibration procedure in which a small animated object is presented at nine different positions on the screen. Gaze position relative to the position of the animated object is calculated and the resulting error vectors are presented schematically. Unfortunately, the version of Tobii studio used in our study does not allow formal calculations of calibration quality. Instead, calibration data were inspected visually where large error vectors signaled need for recalibration.
Following calibration, subjects were instructed to look freely at the photographs presented on the monitor. Stimuli were presented for 12 s each, a time course not uncommon for scene scanning studies that entail memorization (e.g., Birmingham et al., Citation2009; Hayes & Henderson, Citation2018) but relatively long for free-viewing studies of scene perception as well as pupillometric studies (e.g., Martineau et al., Citation2011); for this reason, in our study we focus our pupil data analyses on the first 5 s. Moreover, as pupillary responses have rapid onset (even before conscious awareness in some cases, Laeng et al., Citation2012) and return to baseline over time (Bast, Poustka, & Freitag, Citation2018), analyzing the onset rather than a longer period of time is more telling for the purposes of our study.
Data analysis
Pupil data were exported from Tobii studio and reduced using TimeStudio extension for MATLAB, an open-access analysis tool designed specifically for analyzing time series data (Nyström, Falck-Ytter, & Gredebäck, Citation2016). Data were inspected for various artifacts such as blinks and head movements, and rejected if these artifacts were present for more than 50% of the trace duration within the analyzed time frame (0–5 s). As recommended (Nyström et al., Citation2016), gaps with five or fewer consecutive poor data points were interpolated, and moving average was filtered with a five-sample window. Pupil size was averaged for each subject across both eyes. To eliminate individual differences within subjects and trials, the data were adjusted and normalized according to a baseline calculation over the initial first second (0–1 s) after stimulus onset to account for the pupil’s luminance response (e.g., Mathot, Citation2018). Mean pupil size for each subject was then calculated over social and non-social images over the period of 1–5 s in order to observe the response onset rather than the entirety of the relatively long time course for examining pupil data. Due to lack of sufficient quality according to the description above, pupil data were missing for both the social and the non-social condition in one individual, and in the social condition for an additional one. Note that fixation data for these individuals were included. These data were imported into SPSS (version 24) for analysis. A related samples Wilcoxon Signed-Rank test was performed within each group to test a difference between social and non-social pupillary response, and a Mann–Whitney U test was performed to test for between-group differences. Spearman’s rank correlations were used to test the relationships between pupil data and eye tracking data as well as clinical metrics.
Eye tracking data were exported from Tobii studio for latency (on trials with latency > 0 seconds) and total fixation duration. Areas of interest (AOI) were defined by hand around the location of the person in the social images. Because of the differences in proportions between the images all social AOIs comprised of 3–5% of the total image. On average, the AOIs were 5.46 horizontal (range 4.13 to 7.28) by 7.20 degrees (range 4.93 to 9.15) in the vertical plane (see Supplementary Materials for individual measures). Resulting fixation and latency measured were imported into SPSS software (version 24) for statistical analysis. Mann–Whitney U tests were performed to test for between-group differences. Wilcoxon Signed-Rank tests were run to test for within-group differences. Spearman’s rank correlations were used to test the relationships between latency and/or fixation duration and the established clinical metrics.
Nonparametric tests were used throughout analyses to mitigate the effect of the small sample size and any outliers.
Ethics
Written informed consent was collected. The study was approved by the Ethics Committee in Västra Götaland (ref no 052–12). No conflicts of interest have been declared by any of the researchers associated with the study.
Results
Pupil reactions
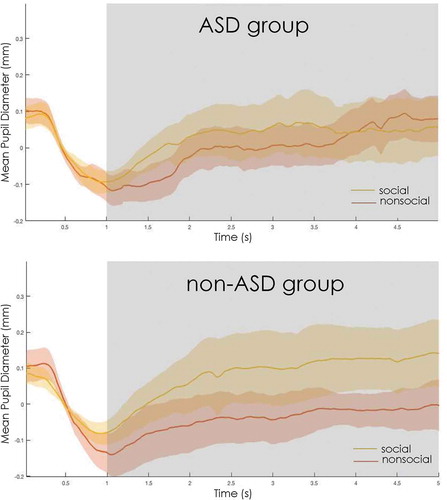
A Wilcoxon signed-rank test was run to determine if there was a within-group difference in each group for pupil size in response to social versus non-social scenes. In the ASD group (social pupil M= 0.030 mm, SD = 0.156; non-social pupil M= −0.007, SD = 0.119) the test showed no significant difference between scene types (p = 0.394). By contrast, in the non-ASD group, a difference was found (social pupil M= 0.083, SD = 0.145; non-social pupil M= −0.042, SD = 0.089, p = 0.019), such that there was larger mean pupil size for social than the non-social scenes.
Figure 2. Mean change in pupil size from baseline to 5 seconds after stimulus onset for subjects with ASD (top) and without (bottom). For the non-ASD group, within group differences for non-social and social pupil were found at p < 0.05.
Group differences and correlations with regards to gaze latency to the person in the scene
A Mann–Whitney U test was run to determine whether the mean latency to the first fixation on the social AOI differed between both groups (ASD M = 0.87 s, SD = 0.80; non-ASD M = 0.45, SD = 0.20). While the mean difference was in the expected direction, the difference was not significant (Z = – 2.03; p = 0.04).
Spearman’s correlations were run across the full sample to assess the relationship between social gaze latency and clinical measures. Correlations were found between the latency to social stimuli and the clinical measures of GAF (rho = −.418, p = 0.012), VABS social (rho = −0.558, p = 0.001), and FTF social competence scores (rho= 0.479, p = 0.005). The directions of these correlations confirm that with increasing social impairments, the longer time it took for the participants to orient towards the person in the scene.
Gaze duration to social AOIs
A Mann–Whitney U test was run to determine differences for mean total duration of fixations for social AOIs between the ASD group (total duration M= 2.36 s, SD = 1.51) and the non-ASD group (total duration M= 2.83, SD = 0.93). No significant difference was found (p = 0.09).
Spearman’s correlations did not show significant relationships between total duration (s) and any of the clinical measures (all ps > 0.16).
Discussion
This study aimed to investigate the gaze patterns and pupil dilation in response to social and non-social scene images in a clinical group of adolescents with neurodevelopmental disorders, divided into subgroups depending on presence or absence of an ASD diagnosis. Based on findings from previous research, it was expected that the ASD group would attend less to the social (face) information in the scenes. Arousal-related reactions to social stimuli were difficult to predict from previous research that have provided evidence in favor of both reduced social motivation/reactivity and in favor of theories of over-sensitivity to social information in ASD. The present study also made comparisons between clinical and empirical measures to determine whether participants’ symptom severity correlated with their response to social stimuli. With regard to methodology, a considerable strength of our study in comparison to previous work of scene processing is the tight control of the characteristics of the scenes, where the presence or absence of a person constitutes the only difference between the two scene conditions.
For the ASD group, there was no significant difference in the physiological reaction measured through pupil size between images that contained a social component versus those that did not, indicating a relative reduction in attention and cognitive/affective arousal and load when viewing these types of stimuli. At the same time, pupil size differences were evident in the non-ASD clinical group, suggesting that the lack of a pupillary response seems to be indicative of autism in particular. The ASD group was also slower at fixating on the social information within the images compared with the non-ASD group. In line with most current research the slowed fixation to social information in individuals with ASD in particular, especially young children, serves as another distinguishing factor between those with an autism diagnosis and other neurodevelopmental/ESSENCE disorders (for a meta-analysis, see Guillon, Hadjikhani, Baduel, & Rode, Citation2014).
Finally, for all participants (regardless of diagnosis) correlations were found between various social clinical measures (specifically VABS social and FTF social competence) and a participant’s latency to social AOIs. This has important clinical implications, mainly in reinforcing the clinical relevance and external validity of these assessments.
Interestingly, though there was a possible trend, no significant difference was found between groups for the total amount of time spent fixating to social information. This contradicts results from some (Guillon et al., Citation2014), but certainly not all earlier studies (e.g., Anderson et al., Citation2006). Methodological differences may potentially explain this variability among studies: we used static images, whereas some previous studies have used multimodal and/or dynamic social stimuli in their studies. Similar to us, Anderson et al. (Citation2006) used static social and non-social images and did not see decreased looking time to social images in participants with ASD. Baranek et al. (Citation2013), however, used a combination of social and non-social tactile, auditory, and visual stimuli and found decreased response to social stimuli in all categories. A meta-analysis of eye tracking studies by Guillon et al. (Citation2014) revealed that in infants and young children, ASD patients showed decreased looking time to social information in general when the stimuli were dynamic and/or interactive, and showed no clear difference from controls when the stimuli were static images.
An additional methodological consideration in our study was the use of complex social scenes where faces occupied only 3–5% of the total image many existing studies have used only faces as stimuli in their experiments. Freeth et al. (Citation2010) found that in response to static pictures of complex scenes, ASD adolescents spent a similar amount of time fixating to faces as adolescents without ASD. Fletcher-Watson, Leekam, Benson, Frank, and Findlay (Citation2008) also found that ASD spent a normative amount of time looking at faces within social scenes, and when person-present scenes were presented alongside person-absent scenes, ASD adults showed preference for the person-present scenes. There are several other studies with scenes, however, which show that ASD patients attend less to social information (Guillon et al., Citation2014), so this may be an incomplete explanation. Even so, the fact that we observed correlations between various clinical measures and social orienting (latency) but not with total fixation time further reinforces the conclusion that it is important to distinguish between these two types of eye-tracking metrics in autism research on social perception, and that clear associations with social impairments might only be apparent for latency measures. One also should keep in mind the fact that some individuals with ASD are being actively trained to look at faces throughout their education, and though this practice may be less common in Sweden, it may have impacted the fixation time findings, causing them to perform better with age.
Two potential caveats of this study have to do with combining pupillometric analysis with unconstrained scanning of natural scenes. First, luminosity might be an issue. If the two subgroups (ASD and no-ASD) do not all the time attend to the same places on the screen, differences in luminosity on these diverging areas of interest would potentially influence pupil dilation over and above the role of social arousal. We attempted to control for this by calculating the luminosity on most-viewed areas of each social (p = .692) and non-social image (p = .879) in both groups and found that did not differ. Also, important to highlight is that the key comparison in our study was between the social and the non-social scenes, and from this perspective, it is hard to imagine a study with greater control of lower-level features of the scenes. Even so, differences in luminosity may still have introduced noise in the data set.
The second potential concern of this study is the pupil foreshortening error, i.e., the error in pupil diameter measurement having to do with gaze location (Brisson et al., Citation2013; Gagl, Hawelka, & Hutzler, Citation2011; Hayes & Petrov, Citation2016). Specifically, the fact that the screen and the camera are flat while the eye rotates means that if the gaze angle changes so might the precision in the pupil measurement. However, we do not think this error severely skews the results in our study since unconstrained scanning of natural scenes – while potentially problematic from the perspective of luminosity – do not introduce any systematic errors arising from PFE provided that certain areas of interests are not placed at only one part of the scene. That being said, some error related to pupil foreshortening have likely added further noise in the dataset. These potential drawbacks are not unique to this particular study, but characteristic of most research in the field. A parallel to further application of pupillometry and gaze tracking in clinical research and clinical settings is a great need to understand more the nature, and ways of overcoming, such technical confounds.
In addition to examining pupillary reactions to natural scenes, the present study differed in that typically developing controls were not used. Instead, the comparison group was composed of individuals with other neurodevelopmental/ESSENCE diagnoses. This was done because ASD is highly comorbid with other developmental disorders, and these disorders often display similar symptoms. In order to outline subtle, more exact differences and provide a clear picture of social processing in ASD that is relevant for clinical work, it is necessary to compare an ASD group with individuals who have similar challenges but not ASD. For diagnostic and research purposes, it is thus valuable to utilize a neurodevelopmental/ESSENCE control group to identify ASD specific markers and differences. That being said, the non-ASD subgroup in the current study was rather small and in future research larger groups and an additional “TD” comparison group would be preferable.
In the introduction, we discussed a contested and highly fundamental issue in current autism research, namely whether the atypical social behavior of individuals with ASD reflects an indifference versus overarousal/oversensitivity to socio-affective information. The efforts to unravel that issue has led researchers in different directions, and we have previously reported several kinds of data pointing towards oversensitivity or over-arousal being a central response in ASD during processing of emotionally expressive faces with direct gaze (e.g., Hadjikhani et al., Citation2018; Lassalle et al., Citation2017), a profile that is particularly clear when the participants are asked to focus their attention at the eye region. Indeed, these stimuli may be perceived as threatening, as corroborated by increased amygdala activation (Lassalle et al., Citation2017). By contrast, the current study, which utilized information from spontaneous eye-tracking and pupil dilations, aligns more with those studies that suggest a lack of interest and a lack of prioritized attention to social information in ASD (e.g., Chevalier, Kohls, Troiani, Brodkin, & Schultz, Citation2012; Moriuchi et al., Citation2016). We speculate that part of the reason why there are so many conflicting results related to this topic could be vastly different stimuli used across studies, the components of which can lead to different engagement and arousal levels in ASD participants. First, visuospatial constraints of the scene might make a difference, such as the complexity of the scene and/or the scale and centrality of the social information (e.g., the face) in the scene. Second, the socio-affective intensity of the scenes also varies from one study to another with regard to i) the emotionality of the socio-affective information, and ii) the gaze direction of the faces in the scenes. We posit that people with ASD react more strongly compared to typically developing individuals to social information in some types of scenes (e.g., of emotionally expressive faces with direct gaze), and that they may react less strongly toward other social stimuli, including the ones used in the current experiment (e.g., in bigger scenes that include a lot of background and people without direct gaze), as a consequence of reduced development of the social brain that results from gaze avoidance and less time spent learning from facial expressions (Hadjikhani et al., Citation2017). Also, the heterogeneity of autism might contribute to the inconsistency of previous findings in research on arousal levels during social processing. Future research using eye-tracking and pupillometric data should systematically explore these ideas in order to shed further light on the social impairment in autism, including the cascading effects of social processing differences in autism in response to different kinds of social stimuli.
In sum, our study revealed subtle differences in the way adolescents with ASD visually attend and physiologically react to social scenes. Our findings have both clinical and experimental implications since these features were observed to align with both standard clinical measures of social functioning and to distinguish ASD from a clinical comparison group without ASD.
CEN-OA_18-167-File004.docx
Download MS Word (9.9 MB)Acknowledgments
We would like to express our gratitude to the participants in this study.
Disclosure statement
No potential conflict of interest was reported by the authors.
Supplementary material
Supplementary data can be accessed here.
Additional information
Funding
References
- Adolphs, R. (2009). The social brain: Neural basis of social knowledge. Annual Review of Psychology, 60, 693–716.
- American Psychiatric Association. (2013). Diagnostic and statistical manual of mental disorders, DSM-5 (5th ed.). Arlington, VA: American Psychiatric Publishing.
- Amso, D., Haas, S., & Markant, J. (2014). An eye tracking investigation of developmental change in bottom-up attention orienting to faces in cluttered natural scenes. PloS One, 9(1), e85701.
- Anderson, C., Colombo, J., & Shaddy, D. J. (2006). Visual scanning and pupillary responses in young children with autism spectrum disorder. Journal of Clinical and Experimental Neuropsychology, 28(7), 1238–1256.
- Baranek, G. T., Watson, L. R., Boyd, B. A., Poe, M. D., David, F. J., & McGuire, L. (2013). Hyporesponsiveness to social and non-social sensory stimuli in children with autism, children with developmental delays, and typically developing children. Developmental Psychopathology, 25(2), 307–320.
- Bast, N., Poustka, L., & Freitag, C. (2018). The locus coeruleus- norepinephrine system as pacemaker of attention- a developmental mechanism of derailed attentional function in autism spectrum disorder. European Journal of Neuroscience, 47, 115–125.
- Birmingham, E., Bischof, W. F., & Kingstone, A. (2009). Saliency does not account for fixations to eyes within social scenes. Vision Research, 49, 2992–3000.
- Bradley, M. M., Miccoli, L., Escrig, M. A., & Lang, P. J. (2008). The pupil as a measure of emotional arousal and autonomic activation. Psychophysiology, 45(4), 602–607.
- Brisson, J., Mainville, M., Mailloux, D., Beaulieu, C., Serres, J., & Sirois, S. (2013). Pupil diameter measurement errors as a function of gaze direction in corneal reflection eyetrackers. Behavior Research Methods, 45(4), 1322–1331.
- Chawarska, K., Macari, S., & Shic, F. (2012). Context modulates attention to social scenes in toddlers with autism. Journal of Child Psychology and Psychiatry, 53(8), 1–19.
- Chevalier, C., Kohls, G., Troiani, V., Brodkin, E. S., & Schultz, R. T. (2012). The social motivation theory of autism. Trends in Cognitive Science, 16(4), 231–239.
- Chita-Tegmark, M. (2016). Social attention in ASD: A review and meta-analysis of eye-tracking studies. Research in Developmental Disabilities, 48, 79–93.
- Constantino, J. N., Kennon-McGill, S., Weichselbaum, C., Marrus, N., Haider, A., Glowinski, A. L., ..., Jones, W. (2017). Infant viewing of social scenes is under genetic control and is atypical in autism. Nature, 547(7663), 340.
- Crawford, H., Moss, J., Oliver, C., Elliot, N., Anderson, G. M., & McCleary, J. P. (2016). Visual preference for social stimuli in individuals with autism or neurodevelopmentaldisorders: An eye-tracking study. Molecular Autism, 7(24), 1–12.
- Emery, N. J. (2000). The eyes have it: The neuroethology, function and evolution of social gaze. Neuroscience & Biobehavioral Reviews, 24(6), 581–604.
- Fitzgerald, H. E. (1968). Autonomic pupillary reflex activity during early infancy and its relation to social and non-social visual stimuli. Journal of Experimental Child Psychology, 6, 470–482.
- Fletcher-Watson, S., Leekam, S. R., Benson, V., Frank, M. C., & Findlay, J. M. (2008). Eye-movements reveal attention to social information in autism spectrum disorder. Neuropsychologia, 47, 248–257.
- Freeth, M., Chapman, P., Ropar, D., & Mitchell, P. (2010). Do gaze cues in complex scenes capture and direct the attention of high functioning adolescents with ASD? Evidence from eye-tracking. Journal of Autism and Developmental Disorders, 40(5), 534–547.
- Gagl, B., Hawelka, S., & Hutzler, F. (2011). Systematic influence of gaze position on pupil size measurement: Analysis and correction. Behavior Research Methods, 43(4), 1171–1181.
- Gillberg, C. (2010). The ESSENCE in child psychiatry: Early symptomatic syndromes eliciting neurodevelopmental clinical examinations. Research in Developmental Disabilities, 31(6), 1543–1551.
- Graur, S., & Siegle, G. (2013). Pupillary motility: Bringing neuroscience to the psychiatry clinic of the future. Current Neurology and Neuroscience Reports, 13(8), 365.
- Guillon, Q., Hadjikhani, N., Baduel, S., & Rode, B. (2014). Visual social attention in autism spectrum disorder: Insights from eye tracking studies. Neuroscience and Biobehavioral Reviews, 42, 279–297.
- Hadjikhani, N., Åsberg Johnels, J., Lassalle, A., Zürcher, N., Hippolyte, L., Gillberg, C., … Yehezkel, B. (2018). Bumetanide for autism: More eye contact, less amygdala activation. Nature Scientific Reports, 8, 3602.
- Hadjikhani, N., Åsberg Johnels, J., Zürcher, N., Lassalle, A., Guillon, Q., Hippolyte, L., … Gillberg, C. (2017). Look me in the eyes: Constraining gaze in the eye-region provokes abnormally high subcortical activation in autism. Nature Scientific Reports, 7(3163), 1–7.
- Hayes, T. R., & Henderson, J. M. (2018). Scan patterns during scene viewing predict ‘individual differences in clinical traits in a normative sample. PloS One, 13(5), e0196654.
- Hayes, T. R., & Petrov, A. A. (2016). Mapping and correcting the influence of gaze position on pupil size measurements. Behavior Research Methods, 48(2), 510–527.
- Hutt, C., & Ounsted, C. (1966). The biological significance of gaze aversion with particular reference to the syndrome of infantile autism. Behavioral Science, 11(5), 346–356.
- Kadesjö, B., Janols, L. O., Korkman, M., Mickelsson, K., Strand, G., Trillingsgaard, A., & Gillberg, C. (2004). The FTF (Five to Fifteen): The development of a parent questionnaire for the assessment of ADHD and comorbid conditions. European Child & Adolescent Psychiatry, 13, 3–13.
- Kanner, L. (1944). Early infantile autism. Journal of Pediatrics, 25, 211–217.
- Kelly, D. J., Duarte, S., Meary, D., Bindemann, M., & Pascalis, O. (2019). Infants rapidly detect human faces in complex naturalistic visual scenes. Developmental Science, e12829.
- Klin, A., Jones, W., Schultz, R., Volkmar, F., & Cohen, D. (2002). Visual fixation patterns during viewing of naturalistic social situations as predictors of social competence in individuals with autism. Archives of General Psychiatry, 59, 809–816.
- Laeng, B., Sirois, S., & Gredebäck, G. (2012). Pupillometry: A window to the preconscious? Perspectives on Psychological Science, 7(1), 18–27.
- Lassalle, A., Åsberg Johnels, J., Zurcher, N. R., Hippolyte, L., Billstedt, E., Ward, N., … Hadjikhani, N. (2017). Hypersensitivity to low intensity fearful faces in autism when fixation is constrained to the eyes. Human Brain Mapping, 38, 5943–5957.
- Martineau, J., Hernandez, N., Hiebel, L., Roche, L., Metzge, A., & Bonnet-Brilhault, F. (2011). Can pupil size and pupil responses during visual scanning contribute to the diagnosis of autism spectrum disorder in children? Journal of Psychiatry Research, 45, 1077–1082.
- Mathot, S. (2018). Pupillometry: Psychology, physiology, and function. Journal of Cognition, 1(1), 16.
- Moriuchi, J. M., Klin, A., & Jones, W. (2016). Mechanisms of diminished attention to eyes in autism. American Journal of Psychiatry. doi:10.1176/appi.ajp.2016.15091222
- Muller, N., Baumeister, S., Dziobek, I., Banaschewski, T., & Poustka, L. (2016). Validation of the movie for the assessment of social cognition in adolescents with ASD: Fixation duration and pupil dilation as predictors of performance. Journal of Autism and Developmental Disorders, 46, 2831–2844.
- Nyström, P., Falck-Ytter, T., & Gredebäck, G. (2016). The timestudio project: An open source scientific workflow system for the behavioral and brain sciences. Behavioral Research Methods, 48, 542–552.
- Rajkowski, J., Majczynski, H., Clayton, E., & Aston-Jones, G. (2004). Activation of monkey locus coeruleus neurons varies with difficulty and performance in a target detection task. Journal of Neurophysiology, 92(1), 361–371.
- Reid, V. M., Dunn, K., Young, R. J., Amu, J., Donovan, T., & Reissland, N. (2017). The human fetus preferentially engages with face-like visual stimuli. Current Biology, 27, 1825–1828.
- Riby, D. M., & Hancock, P. J. B. (2008). Viewing it differently: Social scene perception in Williams syndrome and Autism. Neuropsychologia, 46, 2855–2860.
- Senju, A., & Johnson, M. H. (2009). Atypical eye contact in autism: Models, mechanisms, and development. Neuroscience and Biobehavioral Reviews, 33, 1204–1214.
- Sparrow, S. S., Cicchetti, D. V., & Balla, D. A. (2005). Vineland adaptive behavior scales (2nd ed.). Circle Pines, MN: AGS.
- Wagner, J. B., Luyster, R. J., Tager‐Flusberg, H., & Nelson, C. A. (2016). Greater pupil size in response to emotional faces as an early marker of social‐communicative difficulties in infants at high risk for autism. Infancy, 21(5), 560–581.
- Wechseler, D. (2003a). The wechsler intelligence scale for children (4th ed.). Texas: The Psychological Corporation.
- Wechseler, D. (2003b). The Wechsler adult intelligence scale (3rd ed). Swedish Version. Stockholm, Sweden: Psykologiforlaget.
- Yamauchi, K., Ono, Y., & Ikegami, N. (2001). The actual process of rating the global.