
ABSTRACT
Purpose: Maternally inherited diabetes and deafness (MIDD) is caused by a heteroplasmic m.3243A>G mutation in the mitochondrial DNA. The main ocular feature in MIDD is macular dystrophy. The purpose of this study was to identify the phenotypical characteristics of a patient with MIDD by multimodal high-resolution imaging analyses.
Methods: A detailed history and ophthalmic examination were performed on a 39-year-old patient with MIDD. Multi-modal imaging included fundus photography, fundus autofluorescence imaging, fluorescein angiography, spectral-domain optical coherence tomography, OCT-angiography, and adaptive optics imaging. The PCR-invader and whole exome sequencing (WES) methods were performed on the DNA of the patient.
Results: A 39-year-old woman with sensorineural hearing loss, diabetes mellitus presented with atrophic perifoveal changes and MIDD was suspected. The PCR-invader and WES methods showed that the patient had a m.3243A>G mutation in the mitochondrial DNA with 29% and 16.7% of the heteroplasmy in the peripheral blood, respectively. Morphological analyses revealed that the areas of photoreceptor degeneration and chorioretinal atrophy were present mainly in the perifoveal region. Multifocal ERGs showed that the perifoveal responses were reduced. Goldmann visual field was significant for a cecocentral scotoma in the right eye and an enlarged blind spot in the left eye. The central isopter was constricted bilaterally. The results of high-resolution retinal imaging by AO revealed that the densities of the cone photoreceptor were significantly reduced in the fovea where no obvious atrophy of the RPE and choroid was observed.
Conclusions: Our findings indicate that WES analysis can be used to detect the m.3243A>G mutation in the mtDNA. The results of multimodal imaging analyses indicated that the primary dysfunction of the photoreceptors in the fovea might precede the dysfunction of the RPE in patient with MIDD.
Introduction
The mitochondria are involved in various cellular functions including energy production, metabolic regulation, apoptosis, calcium homeostasis, cell proliferation and motility, and free radical generation (Citation1,Citation2). The mitochondria are called the energy source for eukaryotic cells because they metabolize nutrients to produce adenosine triphosphate (ATP) (Citation3,Citation4). Genetic mutations in the mitochondrial DNA (mtDNA) that impair ATP production cause mitochondrial disorders (Citation5). During fertilization, the maternal mitochondria are retained in the oocyte and there is no paternal mitochondria entry from the sperm. Thus, the gamete contains only maternal mitochondria that propagate within all cells (Citation6,Citation7).
Maternally inherited diabetes and deafness (MIDD, OMIM; #520000) disorder and mitochondrial encephalomyopathy with lactic acidosis and stroke-like episodes (MELAS, OMIM; #540000) disorder are both caused by a maternally inherited m.3243A>G mutation in the mitochondrially encoded leucine transfer RNA (Citation8–10). Mutations for MIDD account for 0.5–3% of diabetes mellitus (DM), and patients with MIDD are characterized by decreased insulin secretion and sensorineural hearing loss (Citation10–12). In contrast, MELAS is a more severe syndrome that is characterized by stroke-like episodes, encephalopathy, myopathy, and lactic acidosis of the blood and/or cerebral spinal fluid (Citation8,Citation13,Citation14). Both syndromes are associated with a broad spectrum of other symptoms and signs including cardiomyopathy, renal disease, short stature, and low body mass index (BMI) (Citation11–14). It is not clear why some patients develop MIDD and others MELAS, but it has been suggested that the degree of heteroplasmy, the presence of a mixture of mutant and normal mtDNA in a cell may play a role (Citation14–16). Although the relationship between the heteroplasmy level and clinical phenotype is not straightforward, it has been hypothesized that a high mtDNA heteroplasmy exceeding a critical threshold, typically >85%, causes the MELAS syndrome whereas a low mtDNA heteroplasmy, typically <45%, causes the MIDD syndrome (Citation4,Citation8,Citation9,Citation17–20).
The main ocular feature in MIDD is a macular dystrophy (Citation21,Citation22). The ocular findings of MELAS include macular dystrophy, external ophthalmoplegia, ptosis, and posterior subcapsular cataract (Citation23,Citation24). The macular dystrophies associated with both syndromes have heterogeneous presentations with varying degrees of retinal pigment epithelium atrophy and hyperpigmentation of the posterior pole (Citation21–23,Citation25,Citation26).
The purpose of this study was to determine the multimodal imaging characteristics of the macular dystrophy in a patient with MIDD caused by a m.3243A>G mutation.
Methods
This study conformed to the tenets of the Declaration of Helsinki and was approved by the Institutional Review Board of the Nippon Medical School. Informed consent was obtained from the patient.
A detailed medical and family history was obtained. The ophthalmological examinations included measurements of the best-corrected visual acuity (BCVA) and refractive error (spherical equivalent), slit-lamp biomicroscopy, ophthalmoscopy, Goldman kinetic perimetry, fundus photography (CLARUS, Carl Zeiss Meditec), fundus autofluorescence imaging (FAF; CLARUS, Carl Zeiss Meditec), fluorescein angiography (FA; CLARUS, Carl Zeiss Meditec), spectral-domain optical coherence tomography (SD-OCT; Cirrus HD-OCT 5000, Carl Zeiss Meditec), OCT-angiography (OCTA; Cirrus HD-OCT 5000, Carl Zeiss Meditec), full-field electroretinography (ERG), and multifocal ERGs (mfERGs). The ERGs were recorded using the extended testing protocol conforming to the International Society for Clinical Electrophysiology of Vision protocol (Citation27). The ERGs were elicited and recorded with a built-in LED contact lens electrode (LE4000, TOMEY, JAPAN). The mfERGs were recorded with a commercial mfERG system (LE4100, TOMEY, JAPAN).
Adaptive optics (AO) image analysis
High-resolution retinal images were acquired with the Adaptive Optics Retina Camera (rtx1™, Imagine Eyes, Orsay, France). The AO images from one retina were stitched together with an automated image editing software (ImageJ, National Institute of Health, Bethesda, MD). We used a reported protocol of the peak density for the measurement of the cone density based on a technique described in detail by Feng et al. (Citation28,Citation29). The cone densities of the patient were compared to 34 healthy individuals (27 men and 7 women, mean age 37.4 ± 9.1 years, range 24 to 55 years) (Citation16).
Genetic analyses
The PCR-invader method (structure-specific 5 nuclease-based method) was used to detect mitochondrial mutations and their level of heteroplasmy (BML, INC. Japan). Whole exome sequencing was also performed according to described methods with the Agilent SureSelect Human v6 kit (Agilent Technologies, Santa Clara, CA) (Citation30). All called SNVs and INDELs of the 271 genes registered as retinal disease-causing genes on the RetNet database were selected for the analysis (https://sph.uth.edu/retnet/home.htm). Mitochondrial chromosomes (chrM) were made visible with the integrative Genomics Viewer (IGV) to investigate the variants in the chrM.
Results
Clinical findings
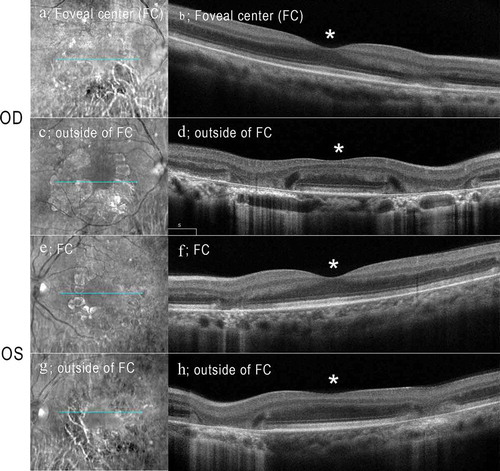
A 39-years-old woman (III-4; proband) presented to our hospital for an assessment for her of diabetic retinopathy (). She was diagnosed with diabetes when she was 26-years-old, and she had been treated with insulin since then. She denied a history or current use of retinal toxic medications including hydroxychloroquine. She reported that she had sensorineural hearing loss (SNHL) and underwent cochlear implant surgery when she was 37-years-old. Her height/weight/body mass index (BMI) was 132 cm/34.0 kg/19.57 kg/m2, respectively. She stated that her mother (II-5) and uncle (II-2) had also been diagnosed with diabetes and SNHL (). She reported that she had no visual symptoms. Her logMAR BCVA was 1.0 in both eyes, and no cataracts were present. Fundus examination demonstrated focal and well-defined chorioretinal atrophy around the fovea (). FAF images of the patient showed hypo-autofluorescence corresponding to the chorioretinal atrophy that was visible in the color photographs (). Hyperfluorescent spots were seen within the area of atrophy as well as within and around the vascular arcades with mottled areas of hypofluorescence. FA of the retina showed staining in the late phases surrounding the chorioretinal atrophy (). The SD-OCT images from the foveal center of the patient were significant for the focal absence of the ellipsoid zone (EZ) and interdigitation zones (IZ) and a thinning of the outer nuclear layer (ONL) on the nasal sides of both eyes (). The SD-OCT images from outside the foveal center showed focal but wider attenuations of the outer layers at both nasal and temporal side of the retina in both eyes (). In the same region, a hyperreflective choriocapillaris layer was observed. The retinal pigment epithelium (RPE) in this region was thinner and only Bruch’s membrane could be seen. Hyporeflective cavities at the boundaries between the normal and abnormal retinas were present (. No obvious atrophy of the RPE and choroid were present in the fovea by fundus examination, FAF imaging, FA, and OCT. OCT angiography (OCTA) of the superficial capillary plexus was normal, while the deep capillary plexus had an enlarged foveal avascular zone (Suppl ). OCTA of the choriocapillaris and the choroidal vessels showed atrophy of RPE and choriocapillaris in the perifovea (Suppl ).
Figure 1. Pedigree chart and an integrative Genomics Viewer (IGV) image
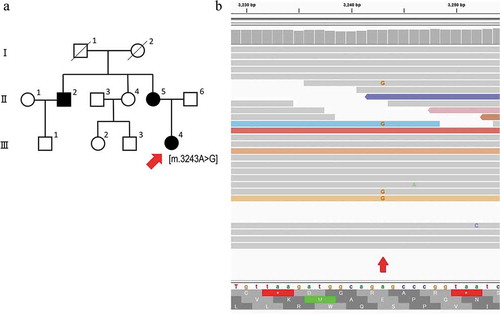
Figure 2. Widefield fundus photographs, fundus autofluorescence (FAF), and fluorescein angiography (FA) of patient with maternally inherited diabetes and deafness (MIDD)
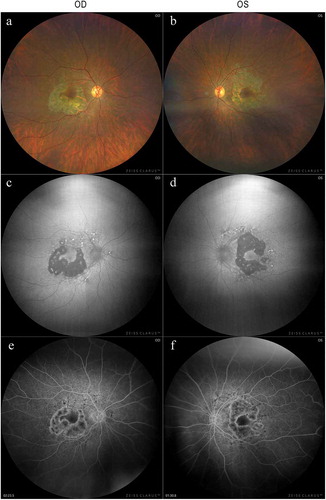
Figure 3. Spectral-domain optical coherence tomographic (SD-OCT) images of the patient with MIDD
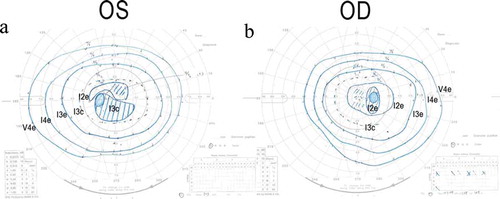
Full-field ERGs showed that the b-wave amplitude of dark-adapted 0.01 was reduced in the right eye (). The a- and b-wave amplitudes of dark-adapted 3.0 were normal in both eyes (). The implicit times of the light-adapted 3.0 ERGs were slightly prolonged in both eyes (). The b-wave amplitude of light-adapted 3.0, and light-adapted 3.0 flicker ERGs were reduced in both eyes (). The amplitudes of the mfERGs in the perifoveal area and foveal center were slightly reduced with a greater reduction in the parafoveal region (). Goldmann visual field revealed cecocentral scotomas in the right eye and an enlarged blind spot in the left eye with constriction of the central isopter bilaterally ().
Figure 4. Full-field electroretinograms (ERGs) of the patient with MIDD
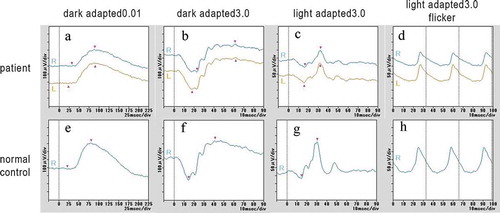
Figure 5. Multifocal ERGs (mfERGs) of the patient with MIDD
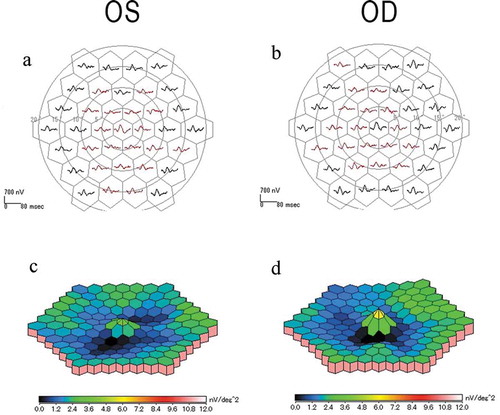
Figure 6. Goldmann kinetic visual field test of the patient with MIDD
Molecular genetic analyses
Before the cochlear implant surgery by an otolaryngologist, she underwent genetic tests to detect the mutation responsible for sensorineural hearing loss. The results obtained by the PCR-invader method indicated that she had an m.3243A>G mutation in the mitochondrial tRNA-Leu (UUR) gene with 29% of the heteroplasmy in the peripheral blood. WES analyses on the DNA samples of the patient also identified a variant, m.3243A>G in the DNA samples obtained from peripheral blood (). IGV revealed 4 mutated leads out of 19 leads (16.7%) aligned on the area (). None of the pathogenic variants in the 271 RetNet genes identified on WES were consistent with this patient’s phenotype.
Analyses of high-resolution images obtained by adaptive optics (AO) fundus camera
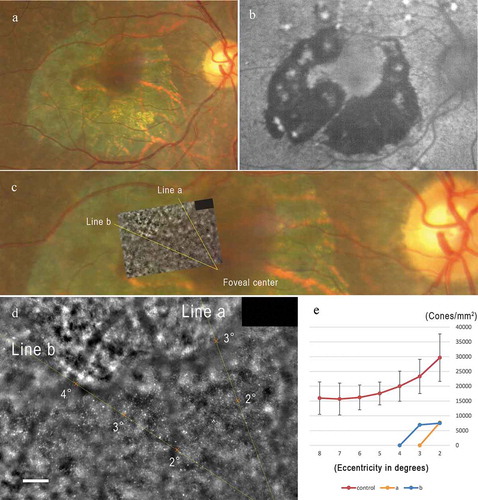
High-resolution images obtained by AO revealed that the cone mosaic observed between the chorioretinal atrophy and the foveal center could be analyzed (). Our peak density analyses showed that the cone densities at 2 and 3 degrees from the foveal center were lower by more than 2 standard deviations from that of the normal controls (). The cone densities in the region of chorioretinal atrophy could not be enumerated ().
Figure 7. High-resolution multimodal image analysis including adaptive optics images of the patient
Discussion
A heteroplasmic m.3243A>G mutation in the mitochondria was found in a Japanese woman with MIDD. The mitochondrial mutation and its level of hetroplasmy were detected not only by the PCR-invader method but also by WES analysis. In our case, only four mutated leads were detected by IGV. Our results showed that WES analysis could be used to detect an m.3243A>G mutation in the mtDNA, but researchers need to be careful in evaluating the WES results because lower heteroplasmy levels make it difficult to detect the mutation. Both methods showed a heteroplasmy level of m.3243A>G to be less than 45%. Because our patient had diabetes and deafness with short stature and low BMI, and her mother and maternal uncle also had diabetes and deafness, the diagnosis of the patient is consistent with MIDD.
An earlier report by Rath et al. described two distinctive phenotypes of the macular dystrophy associated with the m.3243A>G mutation (Citation25,Citation31,Citation32). The first phenotype (Type 1) was characterized by a discontinuous perifoveal atrophy that had a circumferential distribution. With time, the areas of atrophy coalesced into a ring of pericentral atrophy. Occasionally, pale deposits could be detected at the level of the RPE, and the RPE had a granular appearance, and subretinal pigment clumping was found adjacent to the areas of atrophy. The second phenotype (Type 2) was consistent with a pattern dystrophy. It included granularity of the RPE, pale deposits and pigment clumping at the level of the RPE without any significant atrophy. In both MD phenotypes, the majority of the fundus changes occurred within the temporal vascular arcades although the RPE changes were also seen outside of the arcades and nasal to the optic disc (Citation25,Citation31,Citation32).
Our morphological analyses by FAF, FA, OCT, and OCTA imaging revealed that the areas of photoreceptor degeneration and chorioretinal atrophy were observed mainly in the perifoveal region, although pan-retinal cone dysfunction was suggested by the full-field ERG. Multifocal ERGs revealed that the perifoveal function was decreased while the foveal function was only slightly reduced. According to an earlier classification, our case exhibited Type 1 macular dystrophy with the m.3243A>G mutation.
Outer retinopathy could result from a primary dysfunction of the photoreceptors, a primary dysfunction of the RPE, or a dysfunction of both retinal layers. Whether these two cell layers are equally susceptible to the effects of the m.3243A>G mutation or whether the photoreceptor damage is a consequence of the RPE disease, is not known (Citation32). The outermost part of the photoreceptor inner segment is the ellipsoid which contains numerous thin mitochondria. Mitochondria fill approximately 75% of the ellipsoid volume and account for the enormous oxygen use by photoreceptors (Citation33). Histopathologically, Rummelt et al. described the retinal findings in a patient with MELAS with severe retinal dystrophy (Citation24). At the posterior pole, the RPE cells were depleted of apical microvilli, melanosomes, and phagosomes, and contained abnormal mitochondria. Mitochondria in the inner photoreceptor segments were also abnormal and the outer segments were atrophic. The retinal pigment epithelium and photoreceptor cells in the retinal periphery were unaffected (Citation24). Bellmann et al. proposed that a localized loss of photoreceptor function in MIDD detected by mfERGs indicated that there were damages to the cone photoreceptor outer segments or cone photoreceptor loss, although both photoreceptor outer segments and RPE cells are involved in the pathogenesis of MIDD (Citation34). Our results of high-resolution retinal imaging by AO revealed that the cone photoreceptor densities were significantly reduced in the fovea where no obvious atrophy of the RPE and choroid were observed. These results may indicate that a primary dysfunction of the photoreceptors in the fovea preceded the dysfunction of the RPE and choroid in eyes of patients with MIDD.
There are limitations in this study. Although this is the first report to present a detailed ophthalmic analysis including high-resolution imaging of the retina and photoreceptors in an MIDD patient with the m.3243A>G mutation, this cross-sectional study was performed on only one patient. A longitudinal study of a larger number of patients is needed to determine a more accurate relationship between the m.3243A>G mutation and photoreceptor degenerations and chorioretinal atrophy.
In conclusion, our findings indicate that WES analysis could be used to detect m.3243A>G mutation in the mtDNA; however, researchers should be careful in evaluating the WES results especially in cases of low heteroplasmy level. The results of our multimodal imaging analysis of the patient indicated that a primary dysfunction of the photoreceptors in the fovea may precede the dysfunction of the RPE in MIDD.
Disclosure of interest
Spouse of Dr. Kiyoko Gocho is Co-founder and CEO of Imagine eyes. Other authors declare that they have no competing interests.
Ethical approval
All procedures performed in studies involving human participants were in accordance with the ethical standards of the institutional research committee and with the 1964 Helsinki declaration and its later amendments or comparable ethical standards.
Informed consent
Informed consent was obtained from all individual participants included in the study.
Supplementary Figure
Download TIFF Image (11.4 MB)Acknowledgments
We thank Professor Emeritus Duco Hamasaki of the Bascom Palmer Eye Institute, University of Miami School of Medicine, Miami, FL for discussions and editing our manuscript.
Supplementary material
Supplemental data for this article can be accessed on the publisher’s website.
Additional information
Funding
References
- O’Hara R, Tedone E, Ludlow A, Huang E, Arosio B, Mari D, Shay JW. Quantitative mitochondrial DNA copy number determination using droplet digital PCR with single-cell resolution. Genome Res. 2019 Nov;29(11):1878–88. doi:10.1101/gr.250480.119. Epub 2019 Sep 23. PMID: 31548359; PMCID: PMC6836731.
- Scholle LM, Zierz S, Mawrin C, Wickenhauser C, Urban DL. Heteroplasmy and copy number in the common m.3243A>G Mutation-A post-mortem genotype-phenotype analysis. Genes (Basel). 2020 Feb 18;11(2):212. doi:10.3390/genes11020212. PMID: 32085658; PMCID: PMC7073558.
- Wallace DC, Fan W, Procaccio V. Mitochondrial energetics and therapeutics. Annu Rev Pathol. 2010;5:297–348. doi:10.1146/annurev.pathol.4.110807.092314. PMID: 20078222; PMCID: PMC3245719.
- McMillan RP, Stewart S, Budnick JA, Caswell CC, Hulver MW, Mukherjee K, Srivastava S. Quantitative variation in m.3243A > G Mutation produce discrete changes in energy metabolism. Sci Rep. 2019 Apr 8;9(1):5752. doi:10.1038/s41598-019-42262-2. PMID: 30962477; PMCID: PMC6453956.
- DiMauro S, Schon EA. Mitochondrial DNA mutations in human disease. Am J Med Genet. 2001;106(1):18–26. doi:10.1002/ajmg.1392. PMID: 11579421.
- Giles RE, Blanc H, Cann HM, Wallace DC. Maternal inheritance of human mitochondrial DNA. Proc Natl Acad Sci U S A. 1980 Nov;77(11):6715–19. doi:10.1073/pnas.77.11.6715. PMID: 6256757; PMCID: PMC350359.
- Kisilevsky E, Freund P, Margolin E. Mitochondrial disorders and the eye. Surv Ophthalmol. 2020 May-Jun;65(3):294–311. doi:10.1016/j.survophthal.2019.11.001. Epub 2019 Nov 27. PMID: 31783046.
- Goto Y, Nonaka I, Horai S. A mutation in the tRNA(Leu)(UUR) gene associated with the MELAS subgroup of mitochondrial encephalomyopathies. Nature. 1990 Dec 13;348(6302):651–53. doi:10.1038/348651a0. PMID: 2102678.
- van den Ouweland JM, Lemkes HH, Ruitenbeek W, Sandkuijl LA, de Vijlder MF, Struyvenberg PA, van de Kamp JJ, Maassen JA. Mutation in mitochondrial tRNA(Leu)(UUR) gene in a large pedigree with maternally transmitted type II diabetes mellitus and deafness. Nat Genet. 1992 Aug 1;5:368–71. doi:10.1038/ng0892-368. PMID: 1284550.
- de Wit HM, Westeneng HJ, van Engelen BG, Mudde AH. MIDD or MELAS: that’s not the question MIDD evolving into MELAS: a severe phenotype of the m.3243A>G mutation due to paternal co-inheritance of type 2 diabetes and a high heteroplasmy level. Neth J Med. 2012 Dec;70(10):460–62. PMID: 23230016.
- Guillausseau PJ, Massin P, Dubois-LaForgue D, Timsit J, Virally M, Gin H, Bertin E, Blickle JF, Bouhanick B, Cahen J, et al. Maternally inherited diabetes and deafness: a multicenter study. Ann Intern Med. 2001 May 1;134(9 Pt 1):721–28. doi:10.7326/0003-4819-134-9_part_1-200105010-00008. PMID: 11329229.
- Suzuki S, Oka Y, Kadowaki T, Kanatsuka A, Kuzuya T, Kobayashi M, Sanke T, Seino Y, Nanjo K. Research committee or specific types of diabetes mellitus with gene mutations of the Japan diabetes society. Clinical features of diabetes mellitus with the mitochondrial DNA 3243 (A-G) mutation in Japanese: maternal inheritance and mitochondria-related complications. Diabetes Res Clin Pract. 2003 Mar;59(3):207–17. doi:10.1016/s0168-8227(02)00246-2. PMID: 12590018.
- Hirano M, Ricci E, Koenigsberger MR, Defendini R, Pavlakis SG, DeVivo DC, DiMauro S, Rowland LP. Melas: an original case and clinical criteria for diagnosis. Neuromuscul Disord. 1992;2(2):125–35. doi:10.1016/0960-8966(92)90045-8. PMID: 1422200.
- Sproule DM, Kaufmann P. Mitochondrial encephalopathy, lactic acidosis, and strokelike episodes: basic concepts, clinical phenotype, and therapeutic management of MELAS syndrome. Ann N Y Acad Sci. 2008 Oct;1142:133–58. doi:10.1196/annals.1444.011. Erratum in: Ann N Y Acad Sci. 2009 Apr;1161:601.PMID: 18990125.
- Maassen JA, T Hart LM, Van Essen E, Heine RJ, Nijpels G, Jahangir Tafrechi RS, Raap AK, Janssen GM, Lemkes HH. Mitochondrial diabetes: molecular mechanisms and clinical presentation. Diabetes. 2004 Feb;53(Suppl 1):S103–9. doi:10.2337/diabetes.53.2007.s103. PMID: 14749274.
- Laloi-Michelin M, Meas T, Ambonville C, Bellanné-Chantelot C, Beaufils S, Massin P, Vialettes B, Gin H, Timsit J, Bauduceau B, et al. The clinical variability of maternally inherited diabetes and deafness is associated with the degree of heteroplasmy in blood leukocytes. J Clin Endocrinol Metab. 2009 Aug;94(8):3025–30. doi:10.1210/jc.2008-2680. Epub 2009 May 26. PMID: 19470619.
- Chinnery PF, Howell N, Lightowlers RN, Turnbull DM. Molecular pathology of MELAS and MERRF. The relationship between mutation load and clinical phenotypes. Brain. 1997 Oct;120(Pt 10):1713–21. doi:10.1093/brain/120.10.1713. PMID: 9365365.
- Fayssoil A, Laforêt P, Bougouin W, Jardel C, Lombès A, Bécane HM, Berber N, Stojkovic T, Béhin A, Eymard B, et al. Prediction of long-term prognosis by heteroplasmy levels of the m.3243A>G mutation in patients with the mitochondrial encephalomyopathy, lactic acidosis and stroke-like episodes syndrome. Eur J Neurol. 2017 Feb;24(2):255–61. doi:10.1111/ene.13176. Epub 2016 Nov 21. PMID: 27869334.
- Grady JP, Pickett SJ, Ng YS, Alston CL, Blakely EL, Hardy SA, Feeney CL, Bright AA, Schaefer AM, Gorman GS, et al. mtDNA heteroplasmy level and copy number indicate disease burden in m.3243A>G mitochondrial disease. EMBO Mol Med. 2018 Jun;10(6):e8262. doi:10.15252/emmm.201708262. PMID: 29735722; PMCID: PMC5991564.
- Kadowaki T, Kadowaki H, Mori Y, Tobe K, Sakuta R, Suzuki Y, Tanabe Y, Sakura H, Awata T, Goto Y, et al. A subtype of diabetes mellitus associated with a mutation of mitochondrial DNA. N Engl J Med. 1994 Apr 7;330(14):962–68. doi:10.1056/NEJM199404073301403. PMID: 8121460.
- Smith PR, Bain SC, Good PA, Hattersley AT, Barnett AH, Gibson JM, Dodson PM. Pigmentary retinal dystrophy and the syndrome of maternally inherited diabetes and deafness caused by the mitochondrial DNA 3243 tRNA(Leu) A to G mutation. Ophthalmology. 1999 Jun;106(6):1101–08. doi:10.1016/S0161-6420(99)90244-0. PMID: 10366077.
- Massin P, Virally-Monod M, Vialettes B, Paques M, Gin H, Porokhov B, Caillat-Zucman S, Froguel P, Paquis-Fluckinger V, Gaudric A, et al. Prevalence of macular pattern dystrophy in maternally inherited diabetes and deafness. GEDIAM Group. Ophthalmology. 1999 Sep;106(9):1821–27. doi:10.1016/s0161-6420(99)90356-1. PMID: 10485557.
- Sue CM, Mitchell P, Crimmins DS, Moshegov C, Byrne E, Morris JG. Pigmentary retinopathy associated with the mitochondrial DNA 3243 point mutation. Neurology. 1997 Oct;49(4):1013–17. doi:10.1212/wnl.49.4.1013. PMID: 9339682.
- Rummelt V, Folberg R, Ionasescu V, Yi H, Moore KC. Ocular pathology of MELAS syndrome with mitochondrial DNA nucleotide 3243 point mutation. Ophthalmology. 1993 Dec;100(12):1757–66. doi:10.1016/s0161-6420(13)31404-3. PMID: 8259272.
- Michaelides M, Jenkins SA, Bamiou DE, Sweeney MG, Davis MB, Luxon L, Bird AC, Rath PP. Macular dystrophy associated with the A3243G mitochondrial DNA mutation. Distinct retinal and associated features, disease variability, and characterization of asymptomatic family members. Arch Ophthalmol. 2008 Mar;126(3):320–28. doi:10.1001/archopht.126.3.320. PMID: 18332310.
- Zhu CC, Traboulsi EI, Parikh S. Ophthalmological findings in 74 patients with mitochondrial disease. Ophthalmic Genet. 2017 Jan-Feb;38(1):67–69. doi:10.3109/13816810.2015.1130153. Epub 2016 Mar 30. PMID: 27029465.
- McCulloch DL, Marmor MF, Brigell MG, Hamilton R, Holder GE, Tzekov R, Bach M. ISCEV Standard for full-field clinical electroretinography (2015 update). Doc Ophthalmol. 2015 Feb;130(1):1–12. doi:10.1007/s10633-014-9473-7. Epub 2014 Dec 14. Erratum in: Doc Ophthalmol. 2015 Aug;131(1):81-3. PMID: 25502644.
- Feng S, Gale MJ, Fay JD, Faridi A, Titus HE, Garg AK, Michaels KV, Erker LR, Peters D, Smith TB, et al. Assessment of different sampling methods for measuring and representing macular cone density using flood-illuminated adaptive optics. Invest Ophthalmol Vis Sci. 2015 Sep;56(10):5751–63. doi:10.1167/iovs.15-16954. PMID: 26325414; PMCID: PMC4559213.
- Gocho K, Akeo K, Itoh N, Kameya S, Hayashi T, Katagiri S, Gekka T, Ohkuma Y, Tsuneoka H, Takahashi H. High-resolution adaptive optics retinal image analysis at early stage central areolar choroidal dystrophy with PRPH2 mutation. Ophthalmic Surg Lasers Imaging Retina. 2016 Dec 1;47(12):1115–26. doi:10.3928/23258160-20161130-05. PMID: 27977834.
- Kubota D, Gocho K, Kikuchi S, Akeo K, Miura M, Yamaki K, Takahashi H, Kameya S. CEP250 mutations associated with mild cone-rod dystrophy and sensorineural hearing loss in a Japanese family. Ophthalmic Genet. 2018 Aug;39(4):500–07. doi:10.1080/13816810.2018.1466338. Epub 2018 May 2. PMID: 29718797.
- Rath PP, Jenkins S, Michaelides M, Smith A, Sweeney MG, Davis MB, Fitzke FW, Bird AC. Characterisation of the macular dystrophy in patients with the A3243G mitochondrial DNA point mutation with fundus autofluorescence. Br J Ophthalmol. 2008 May;92(5):623–29. doi:10.1136/bjo.2007.131177. PMID: 18441172; PMCID: PMC2569141.
- Daruich A, Matet A, Borruat FX. 2014 Jun 6. Macular dystrophy associated with the mitochondrial DNA A3243G mutation: pericentral pigment deposits or atrophy? Report of two cases and review of the literature. BMC Ophthalmol. 14:77. doi:10.1186/1471-2415-14-77. PMID: 24906873; PMCID: PMC4059104.
- Spaide RF, Curcio CA. Anatomical correlates to the bands seen in the outer retina by optical coherence tomography: literature review and model. Retina. 2011 Sep;31(8):1609–19. doi:10.1097/IAE.0b013e3182247535. PMID: 21844839; PMCID: PMC3619110.
- Bellmann C, Neveu MM, Scholl HP, Hogg CR, Rath PP, Jenkins S, Bird AC, Holder GE. Localized retinal electrophysiological and fundus autofluorescence imaging abnormalities in maternal inherited diabetes and deafness. Invest Ophthalmol Vis Sci. 2004 Jul;45(7):2355–60. doi:10.1167/iovs.03-1090. PMID: 15223817.