Abstract
Physico-chemical processes on the micro-scale require new modelling concepts because some effects become dominating that are negligible for macroscopic systems. This is illustrated by a new method for the production of micro-wells based on the placement of a small drop of toluene on a plate of polystyrene. After droplet evaporation, a micro-well is left. A mathematical model has been developed to understand the elementary processes of the micro-well formation. The model accounts for: (1) growth of the drop on the substrate, (2) evaporation process of the solvent, (3) dissolution of the substrate, (4) flow rate in the evaporating drop caused by the pinning effect, including the vertical velocity profile, and (5) increase in the concentration of dissolved material followed by precipitation. In the modelling and simulation process, it could be shown that the method of drop production also has a significant influence on the shape of the micro-wells.
1 Introduction
In many fields of modern engineering, miniaturization has become increasingly important. The same holds for different fields in chemistry. Methods for micro-structuring surfaces are required, such as ‘High-Throughput Screening’ in the pharmaceutical industry. Even though there are already several methods for surface engineering, not all demands can be satisfied by any one of these procedures. Thus, new methods in this field are still of high interest for research and industrial production. With the method presented here, it is possible for instance to provide the pharmaceutical industry with ‘test boards' with several hundreds of test facilities on a few square centimetres. In particular, expensive experiments can become much cheaper by miniaturization. Owing to improved understanding of the processes in production of the micro-structured surfaces, the processes in the cavities themselves (e.g. crystallization) can also be better understood.
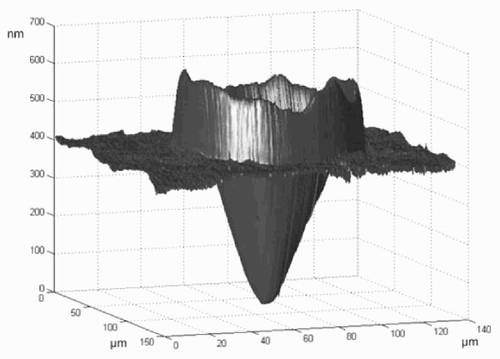
As shown in , it is possible to form micro-wells by placing solvent drops on to a polymer substrate. In contrast to the procedures described in the literature [Citation1 – Citation Citation Citation4], here the bottom is dissolved by the liquid. The solute remains after the drying process as a ring stain, and a micro-well is left. The process of evaporation is the subject of many publications [Citation3, Citation4], as is the precipitation of dissolved materials [Citation1, Citation2, Citation5]. An understanding of the influence of physical and chemical parameters such as concentration of the solvent in the vicinity, composition of the liquid phase, etc. is of high interest for the optimization of the process.
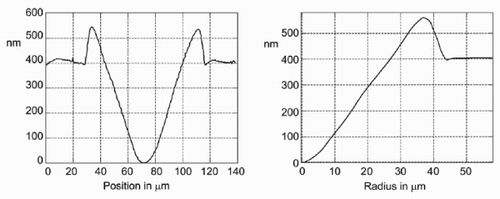
Figure 1. Atomic force microscope (AFM) image of a micro-well produced with the ‘sessile drop method’ (note the different scale on the z-axis).
The micro-wells can be used as small cavities for chemical experiments or for example as masks for the production of micro-lenses. Thus, it is also possible to think about forming micro-landscapes on demand for chemical processes and micro-reactors.
Though the process of diffusion of the solute molecules in the solvent is very well known, there is surprisingly no model for the solving step itself, i.e. the change from the solid phase into the liquid phase (see Section 3.2). Here, a model analogue to the heat transfer between two materials and the subsequent heat transfer in the materials was used. The constant describing this process was subjected to a fitting procedure.
2 Experimental results and methods
Several methods have been studied to investigate the major influences on the shape and the depth of the micro-wells produced, one of which will be presented here, namely, the ‘sessile drop method’. This will be explained in detail in the following, as well as the simulations concerned with this method.
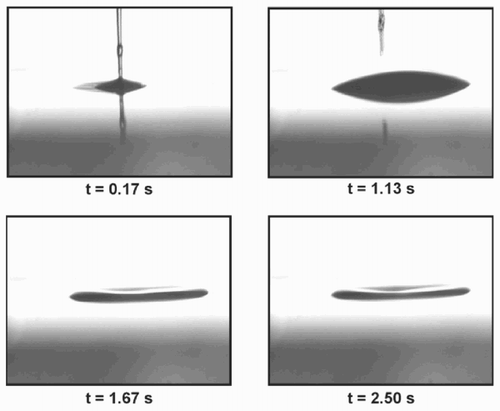
With a syringe, a small amount of solvent (toluene) is placed onto the polymer substrate (polystyrene). The needle is almost in contact with the substrate. The toluene is brought to the surface with some pressure. The photographs in were taken from a video sequence of about 2 s. The diameter of the micro-well was about 300 μm. A smaller micro-well (diameter = 88 μm) was imaged with an atomic force microscope (see ).
3 Theoretical background
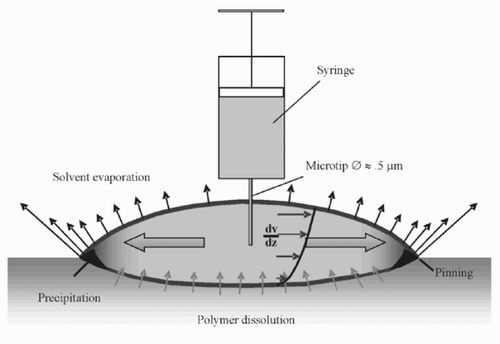
The mathematical model developed to understand the process of micro-well formation recognizes the following physical and chemical effects of the system ():
| 1. | creation of the drop; | ||||
| 2. | evaporation process of the solvent; | ||||
| 3. | dissolution process of the substrate; | ||||
| 4. | flow in the evaporating drop caused by the pinning effect, including the vertical velocity profile; | ||||
| 5. | increase in the concentration of dissolved material followed by precipitation. | ||||
3.1 Evaporation process
The process of evaporation starts when molecules of the solvent pass the liquid – gas interface. After this, the vapour molecules disappear in a diffusion process. Directly above the drop surface, the maximum possible concentration in air is reached. From here, the concentration decreases with increasing distance from the drop until the concentration of the environment is reached (normally 0 for toluene) [Citation6]. If the concentration in the solvent in air is denoted by c, the diffusion constant with D and the vapour flow rate with J, the following equations are obtained:
Hu and Larson [Citation3] have developed the following formula for the calculation of mass loss rate
3.2 Dissolution process of the substrate
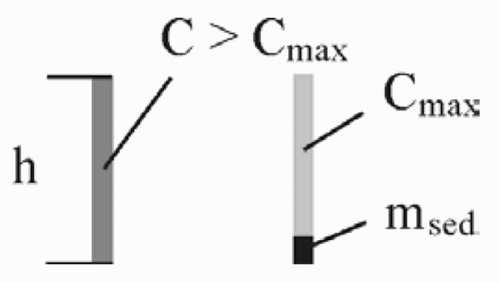
Molecules of the substrate change into the liquid phase. Quantitatively, this is described by a desorption constant D esorp. Up to the factor AΔt (area and time interval), the amount of material that is dissolved is proportional to the difference between the maximum possible concentration C max of the solute in the solvent and the actual concentration C
3.3 Flow in the evaporating drop
In the process of evaporation, the volume of the drop is decreased. At the same time, the three-phase border line remains fixed (pinning effect). Thus, the diameter of the drop stays (nearly) constant, and liquid has to be transported to the border. This causes the flow inside the drop. If the black line in below represents the shape of the drop at a time t, the dash-dotted line is its shape—if it were not pinned—after some of the solute has evaporated. In contrast, if the drop is pinned, the grey line will emerge.
Owing to the assumption that the flow rate near the liquid – substrate interface of the drop is almost 0, the profile of the flow rate is basically a function of the position in the drop. Hu and Larson [Citation3] have given the following result for the profile of the radial component.
3.4 Increase in concentration of dissolved material followed by precipitation
Beginning at the border of the drop, the missing liquid has to be transported from the inner part of the drop. This flow mixes liquid with different concentrations of the solute. Owing to the pinning effect, solvent and dissolved material are thus transported to the outer region of the drop. The amount of dissolved material in the drop and the concentration of the solute, respectively, are increased due to
| 1. | the dissolution process; | ||||
| 2. | the fact that the amount of liquid is decreased by the evaporation process and; | ||||
| 3. | especially in the outer part of the drop, the transport of dissolved material. | ||||
4 Data processing
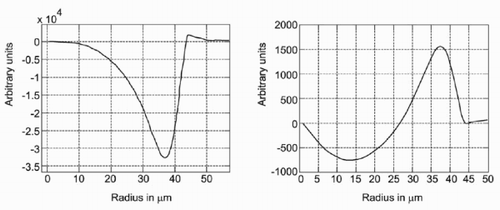
Since the radial symmetry of the problem is exploited in the simulations, the measured data are averaged as described below to be able to compare the measured and the simulated data. For the preparation of the chart at the right of , the centre of the micro-well has been determined by a fitting procedure. After this, the height of the different pixels at a given distance from that point has been averaged.
To determine whether the pinning of the drops has taken place directly or after some solvent has already evaporated, and whether dissolved material has its origin outside the micro-well, the mass conservation was checked. This procedure also checks if the density of the precipitated material agrees with that of the substrate material. To do this, the following integral is calculated as a function of its upper border
5 Simulation steps and parameter
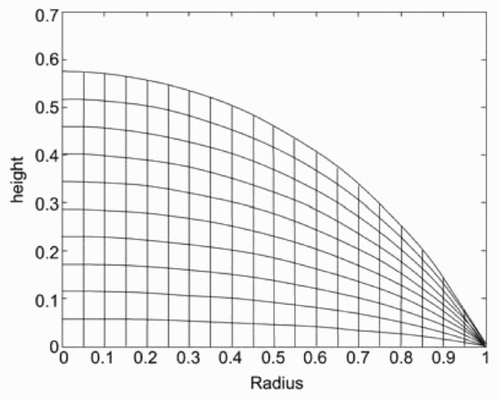
The implementation of the simulation algorithm was done in MATLAB. The description of the simulation steps follows the order in Section 3. Since no dependency in the azimuth was expected, the calculations were performed in a cylindrical coordinate system. To be able to simulate the diffusion process of the dissolved material and to take into account the profile of the flow rate, the drop was discretized not only in the r-direction but also in the z-direction ().
The height of the drop at a given radius r from the centre is due to the spherical assumption (see Section 3):
5.1 Growth of the drop
Since the flow rate of the solvent from the syringe is not known precisely at present, this was a parameter in the program which was successively adapted. For the initialization, the drop was assumed to have a volume that was below 0.001 of the maximum volume, after which the process of drop growing was stopped. To take into account the fact that the solvent is injected with some pressure, the added solvent is put into the lowest cell of the computational grid in the centre of the drop. Thus, it is possible to use the flow model that is used for the description of the pinning effect for the spreading of the liquid. Since the drop now is considered not to be pinned, the radius of the drop is increased with increasing volume such that the contact angle ϑ is kept constant. The other processes (evaporation, etc.) are, of course, simulated, too. The flow rate was kept constant while the drop was filled.
5.2 Evaporation process of the solvent
From the formula (1) for the mass loss, the evaporation volume can be calculated, since the density of the liquid is known. In the program, the mass loss for the full surface was compared with Equationequation (2). Discrepancies owing to numerical discretization errors could be avoided by rescaling the evaporated amount of liquid after each step. This is especially important for small radii, because the number of intervals in radial direction is low. The contact angle changes after the growing drop process has ended due to evaporation and the pinning effect. The angle is calculated from the drop radius and the height in the centre of the drop
5.3 Dissolution process of the substrate
The amount of material from the substrate that is dissolved is determined by Equationequation (3). In the liquid phase, the solute drifts to regions with a lower concentration by the diffusion process. In the program, this diffusion process was implemented with the implicit Euler method for Equationequation (4).
5.4 Flow in the evaporating drop
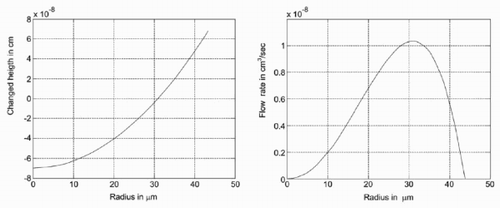
The height of the drop at a distance r from the centre is changed by the injection of liquid, the evaporation, the dissolution of the substrate and the deposition of material that precipitates. It should be taken into account that some volume of the liquid is in the hole formed by the dissolution process, and the deposited material also forms a socket (see also ). The shape of the drop is determined for the remaining volume as a sphere. On the other hand, the remaining height in the calculation (that reflects all described processes) at a given radius is different (see left). Thus, the amount of liquid that has to flow to this interval is determined (see also ). The resulting flow is shown on the right-hand side in .
5.5 Increase in concentration of dissolved material followed by precipitation
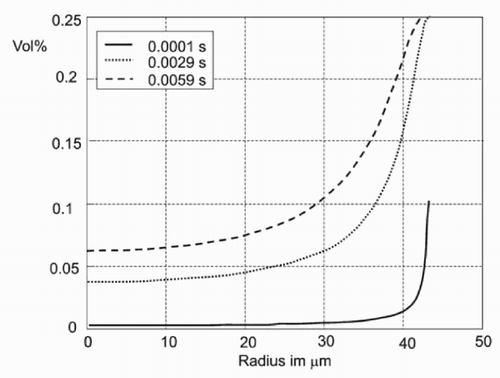
The concentration of the solute in the outer region of the drop is drastically increased ().
The amount of material that is deposited in the outer part of the drop is higher than the liquid after some of the volume has evaporated. In the program, the diameter of the drop is reduced at that moment. For the calculation of the sphere, the volume in the remaining socket and also in the ‘hole’ in the substrate has to be taken into account.
5.6 Parameters used in the program
The simulation was terminated as soon as the remaining volume of the drop was below 10 – 4 of the maximum volume of the drop (see ).
Table 1. Physical parameters.
6 Comparison of the experimental and simulated results
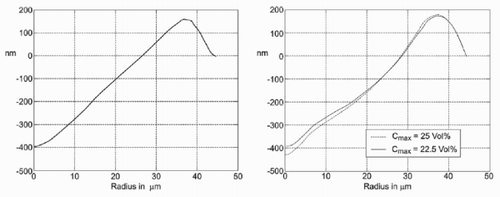
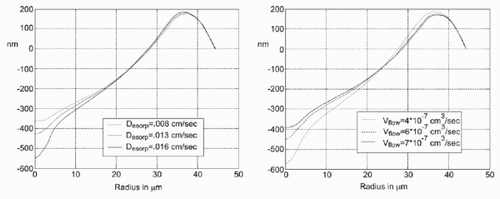
To compare the simulated results with the experimental results, the parameters for flow rate of the solvent V flow, the desorption constant D esorp (), and the maximum possible concentration C max () are changed.
The results from the simulations are in reasonable agreement with the experiments. With a more sophisticated and detailed model of the flow in the drop, especially during the formation process of the drop, the accuracy can certainly be increased, and the results will even fit the experimental data better. The mismatch between simulated and measured evaporation time indicates that the concentration change at the drop surface should be considered in a refined model.
7 Conclusion
It turns out from the simulation that the drop growth is crucial for the shape of the micro-well. This is because in the centre of the drop near the liquid – solid interface, the concentration of the dissolved material in the solvent is always low. This results in a high dissolution rate of the polymer into the solvent drop and thus increases the amount of polymer deposited at the drop rim. Thus, it is possible to ‘drill’ deep holes into the substrate.
By combining simulation and experiment, it is possible to determine the dissolution constant of a polymer into a solvent. This constant is experimentally difficult to measure because the dissolution in general is accompanied and determined by a diffusion of the polymer. Thus, the dissolution constant and the diffusion constant are strongly coupled in generally.
8 Outlook
The work will be continued as a part of research group founded by the Deutsche Forschungsgemeinschaft (DFG) FOR 516/1 in the projekt WI 1705/7-1. Subject of the further analysis will be a detailed parameter study to determine the experimental sensitivity of the whole system with respect to the chosen parameters values and related processes. These theoretical efforts will be accompanied by experimental investigations. Hence, the intention is to prove the valid range of the models presented before and especially to focus on arising discrepancies. From the viewpoint of simulation, it would seem worthwhile focusing on implementing more sophisticated numerical methods.
Acknowledgements
This work was partially funded by the Deutsche Forschungsgemeinschaft within the DFG research group 516 ‘Physical and chemical foundations, components and systems for lab-on-chip technology’. We gratefully thank Guangfen Li and Elmar Bonaccurso for providing us with the experimental data.
References
References
- Deegan , RD , Bakajin , O , Dupont , TF , Huber , G , Nagel , SR and Witten , TA . 2000 . Contact line deposits in an evaporating drop . Physical Review E , 62 : 756 – 765
- Deegan , RD , Bakajin , O , Dupont , TF , Huber , G , Nagel , SR and Witten , TA . 1997 . Capillary flow as the cause of ring stains from dried liquid drops . Nature , 389 : 827 – 829
- Hu , H and Larson , RG . 2002 . Evaporation of a sessile droplet on a substrate . Journal of Physical Chemistry B , 106b : 1334 – 1344
- Picknett , RG and Bexon , RJ . 1977 . The evaporation of sessile or pendant drops in still air . Journal of Colloid and Interface Science , 66 : 336 – 350
- Deegan , RD . 2000 . Pattern formation in drying drops . Physical Review E , 61 : 475 – 485
- Hu H Larson R 1998 Paper presented at the Proceedings of the Fourth Microgravity Fluid Physics and Transport Phenomena Conference, Cleveland, OH, 12 – 14 August 1998, pp 359 – 364
- Atkins PW de Paula J 2001 Physical Chemistry Oxford Oxford University Press
- Erbil , HY and Avci , Y . 2002 . Simultaneous determination of toluene diffusion coefficient in air from thin tube evaporation and sessile drop evaporation on a solid surface . Langmuir , 18 : 5113 – 5119
