Abstract
Because of the complexity of sports movements, biomechanical analyses contain many kinematical or dynamical parameters and characteristic curves. Principal component analysis (PCA) is a technique for simplifying a dataset by reducing multidimensional datasets to lower dimensions for analysis. The purpose of this article is the presentation of several studies which used the PCA to solve various problems in the movement science in sports. In particular, we interpret the number of the components or also named components with relatively high eigenvalues as the number of degrees of freedom. For cyclic and automated movements, the first PCA component is dominant. The PCA was successfully applied to gait analyses in rehabilitation and in triathlon as well as in riding. Phase plots could be used to quantify the variability of the movement coordination.
1. Introduction: using principal component analysis in movement science
Because of the complexity of sports movements, biomechanical analyses contain many kinematical or dynamical parameters and characteristic curves. From systems point of view, only a few quantities are sufficient to describe the movement coordination [Citation1,Citation2]. There are many methods for linear (time-invariant) component order reduction. An important class of techniques is known as projection method which attempts to find the best approximating subspace in terms of data variance upon which to project the system dynamics. The principal component analysis (PCA) is one popular method, partially because it is numerically feasible for large dimensional systems [Citation3–5]. It is data-driven, meaning that the results are inherently a function of a specific dataset. It can be declared that the PCA is a technique for simplifying a dataset by reducing multidimensional datasets to lower dimensions for analysis. In Ref. [Citation6], PCA was used for a constructive pattern analysis for gait. This technique was applied to 15 segmental angles, thereby reducing successfully the corresponding parameter set to only three components. The shapes of the phase plots of these variables allowed a discrimination of gaits under different neurophysiologic conditions [Citation6]. In Refs. [Citation7] and [Citation1] the authors assume that cyclic, learned and automatic movements are governed by only one order or systems parameter. They confirmed this hypothesis by a study of the learning process of driving a pedalo. An estimation of the number of order parameters was realized by means of the Karhunen–Loève (KL) method or PCA [Citation1]. Likewise in Ref. [Citation8], the linear and nonlinear PCA is applied to the learning process of driving a pedalo to determine the degrees of freedom during the learning process. Another example of using the PCA is the classification of the short and long serves in table tennis [Citation9].
The purpose of this article is the presentation of various studies which used the PCA to solve various problems in the biomechanics in sports. In particular, we interpret the number of the components or also named components with relatively high eigenvalues as the number of degrees of freedom.
2. Method of principal component analysis
Research by means of the PCA can be used to determine how the variance of a data vector is composed of the variances of the single components. This method is a linear transformation which transforms the data to a new coordinate system in such a way that the greatest variance by any projection of the data comes to lie on the first coordinate (called the first component), the second greatest variance on the second coordinate (called the second component) and so on. For the definition of the data vector or ‘pattern’ vector, it is assumed that its components are specific biomechanical parameters for this movement (angles, velocities, etc.). So the ‘pattern’ vector can be expressed as
The PCA then portrays the variance of the ‘pattern’ vector. For this decomposition, the ‘pattern vector’ is projected onto an arbitrary, time-independent vector of unit length. This time-dependent projection can be written as
The ‘pattern vector’ is then decomposed into two time-dependent series: one time series lying in the direction of the projection of the greatest variance and the other time series lying orthogonal to it. This procedure is repeated with this second orthogonal time series. This new direction of maximum variance logically is orthogonal to that of the first maximum variance. Consequently, iterating the entire algorithm yields further directions of relative maximum variance and leads to a series of monotonously decreasing values for the remaining variance of the pattern vector at the intersection of the orthogonal complements. The directions of maximal variance paired orthogonal to each other are called components. Each component contains a part of the total variance, which is defined by the belonging eigenvalue. For the purpose of clarity, the sum of the eigenvalues is normalized to 100%. So each eigenvalue indicates the percentage in the total variance of the related component. Generally components with eigenvalues less than 5% are disregarded.
The PCA can also be realized by the determination of the covariance matrix of the time series of the components (angles) of the ‘pattern vector’. The calculated components are called eigenvectors, the variances are the eigenvalues of the covariance matrix.
3. Results and discussion
3.1. Study 1: Transition from walking to running
The aim of this study is the characterization of the walking and running movements by means of an order parameter for analysing its changes under the condition of varying velocity. It is known that slight variations of external factors can lead to considerable effects in the movement. In this way, a gradual increasing of the treadmill velocity causes the transition from walking to running. Referring to this, empirical and theoretical researches were carried out [Citation10–13]. The investigations were carried out with two male students of sport science (CK and R), who were familiar with running on a treadmill. Several individual treadmill velocities were set, with duration of 3 min each. The velocities were chosen in such a way that the subject can walk comfortably at two to three velocities before the transition into running. After enough accommodation in the third minute, seven or more step cycles were recorded by a high-speed camera (200 Hz). The two-dimensional kinematical analysis was carried out by means of SIMI Motion software. Further on, the angles of the body, which are given in , were used for the PCA.
Table 1. Definitions of the angles of body in relation to the transversal plane (xz-plane) (study 1)
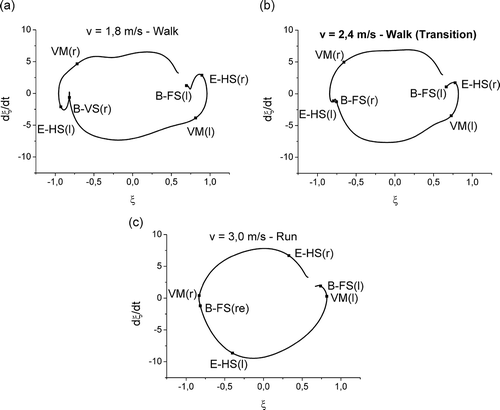
It can be discovered that the first component is distinguished by the greatest eigenvalues for both subjects and for all velocity steps (see ). Besides, small differences between the velocities and between walk and run can be observed. But these distinctions are inter-individual, so general evidence is not admissible. With this result the thesis that the movement coordination of walking and running can be described by only one systems parameter is confirmed. To determine the systems parameter ξ and the resulted phase plot (ξ vs. dξ/dt) to characterize its dynamics, ξ was calculated by means of the Haken–Friedrich–Uhl order parameter analysis [Citation1]. shows examples for phase plots dependent on the velocity for the subject CK with marked time points of the movement phases within the movement cycle. The closed curves refer to cyclic movements. In the phase plots for walking, additional ‘spikes’ could be found. These irregularities can be observed in particular in the phase of double support.
Figure 1. (a, b) Eigenvalues of the PCA components, calculated for single cycles in each velocity step. Left: subject CK; right: subject R (study 1).
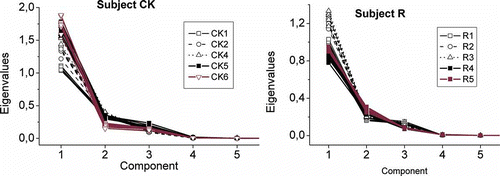
Figure 2. (a–c) Examples for phase portraits or phase plots dependent on the velocity for the subject CK. Left: walk; middle: walk (transition); right: run. In the movement phases drawn: VM, vertical moment; B-FS, beginning of the front supporting phase; E-HS, end of the behind supporting phase; r, right leg; l, left leg (study 1).
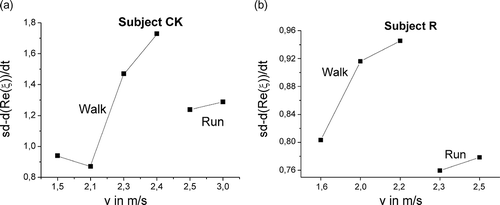
Another advantage of describing the movement coordination by means of a systems parameter is the possibility to quantify the variability of the movement. Of special interest is the dependency on the velocity and on the locomotion. The following analysis relates to the temporal derivation of the order parameter, which was calculated for all single cycles. The mean standard deviation of all single curves was used as a measure of the variability. The diagrams in show this mean standard deviation dependent on the velocity. We can see that the variability of the dynamics of the order parameter for walking increases with grown velocity. The variability is particularly high immediately before transition. These fluctuations known in synergetics are necessary for self-organization. They drive the system to discover new states and allow a phase change [Citation14]. In this way, the new state of the system, running, is characterized by a particularly high stability.
Figure 3. (a, b) Mean standard deviation of the temporal derivation of the systems parameter in dependence on the velocity. Left: subject CK; right: subject R (study 1).
3.2. Study 2: Characterization of walking coordination during rehabilitation of patients with a knee joint endoprosthesis
The purpose of this study was the estimation of the number of PCA components and their eigenvalues relating to the rehabilitation process. The determination of the ‘pattern’ vector was carried out on the basis of the 19 body angles. The angle–time courses resulted from a three-dimensional video analysis (SIMI Motion, sample rate: 50 Hz). Per researching time point six to eight steps were analysed. Nine (three females and six males) patients of ages from 45 to 70 years participated in this study.
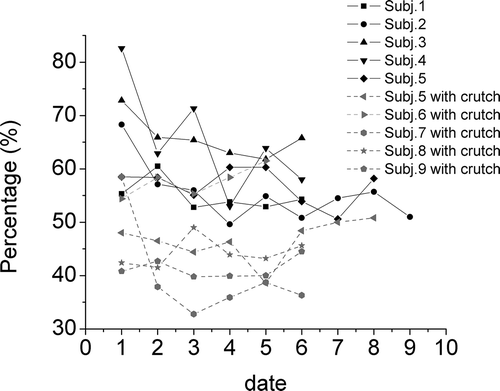
The diagrams in show for two patients the mean eigenvalues of the first PCA components dependent on the duration of the rehabilitation. The dominance of the first component is obvious. During the rehabilitation, the meaning of the first component increases. This can be interpreted that during the rehabilitation, the movement coordination gets more stable. In contrast to a normal walk of a healthy person, the second PCA components have relatively high eigenvalues. shows the percentage of the second component to the first component. It can be found that by using crutches the percentage of the second component in relation to the first component is lower than without crutches. A possible explanation is the influence on the individual gait coordination by using crutches.
Figure 4. (a, b) Mean eigenvalues of the first 10 PCA components for two patients (without crutch). At date 1 was the first research and at date 6 (subject 3) or date 8 (subject 5) was the last researching time point. Left: subject 3, right: subject 5 (study 2).
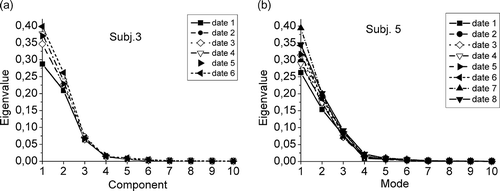
Figure 5. Percentage of the second component in relation to the first component during the rehabilitation for all patients (study 2).
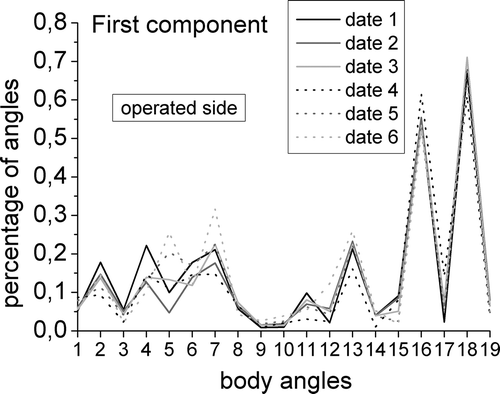
Of special interest is another issue: Which angles influence the first and the second component? The percentage of all considered angles is plotted for two examples in (patient with operated right leg) and 7 (with operated right leg). Both subjects used crutches. It is particularly noticeable that the body angles of the non-operated side have the largest percentage in the first component and the body angles of the operated side have the largest percentage in the second component. A possible explanation can be the characterization of the individual style of a human gait by the second PCA component.
Figure 6. Mean percentage of body angles in the first (a) and the second (b) component in dependence on the rehabilitation (data 1–6) for subject 6, operated right leg, with crutches. Angles: 1, elbow (left); 2, upper arm (left); 3, upper body (left); 4, hip (left); 5, knee (left); 6, ankle (left); 7, sole-horizontal plane (left); 8, sole-vertical plane (left); 9, shoulder grade (left); 10, pelvis grade (left); 11, pelvis rotation 12, elbow (right); 13, upper arm (right); 14, upper body (right); 15, hip (right); 16, knee (right); 17, ankle (right); 18, sole-horizontal plane (right); 19, sole-vertical plane (right) (study 2).
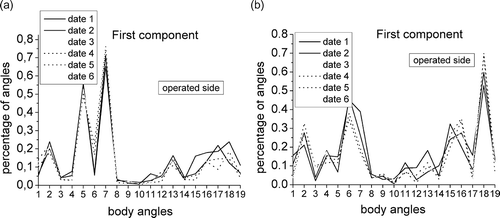
Figure 7. Mean percentage of body angles in the first (a) and the second (b) component in dependence on the rehabilitation (data 1–data 6) for subject 9, operated left leg, with crutches. Angles: 1, elbow (left); 2, upper arm (left); 3, upper body (left); 4, hip (left); 5, knee (left); 6, ankle (left); 7, sole-horizontal plane (left); 8, sole-vertical plane (left); 9, shoulder grade (left); 10, pelvis grade (left); 11, pelvis rotation 12, elbow (right); 13, upper arm (right); 14, upper body (right); 15, hip (right); 16, knee (right); 17, ankle (right); 18, sole-horizontal plane (right); 19, sole-vertical plane (right) (study 2).
3.3. Study 3: Characterization of running coordination after prior cycling exercise in triathlon
It is known that triathletes have the feeling of another coordination of running after prior cycling exercise than running under normal conditions. Therefore, the following question should be answered: Are there changes in the coordination of running after prior cycling exercise? Two groups participated in this study. Group 1 consisted of five male experienced triathletes and group 2 was built by five male sports students. After a pre-run test a cycling distance (40 km for group 1 and 20 km for group 2) was selected. A treadmill running for 2 km followed. By means of a kinematical video analysis system, 20 cycles were analysed for the following time points: pre-run test (PreRun), 30 s (Run 1), 2 min (Run 2), 4 min (Run 3) and 7 min (Run 4) after the beginning of the second run test.
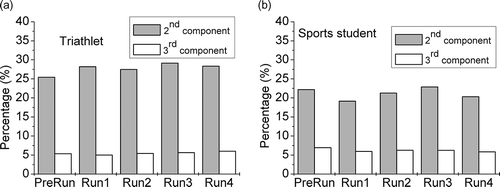
On consideration of Run 1 (), the dominance of the first component is evident. A slight change in movement coordination can be assumed because of the progressive running exercise. In relation to the first PCA component, the eigenvalues of the second KL component for the triathletes are higher than for the sports students. shows the percentage of the second and the third PCA component in relation to the first PCA component for one triathlete and one sports student. Significant differences between the single runs could not be found. In relation to the first component, the eigenvalues of the second component for the triathletes are higher than for the sports students. Also in this study we assume that the second PCA component characterizes the individual style of the movement.
Figure 8. Mean eigenvalues of the first three PCA components for run 1. (a) Triathlete; (b) sports student (study 3).
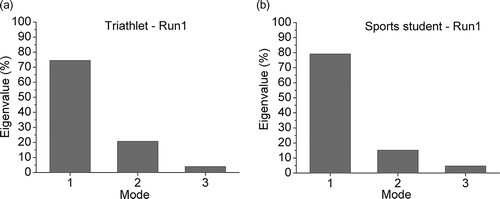
Figure 9. Percentage of the second and third PCA components in relation to the first component. (a) Triathlete; (b) sports student (study 3).
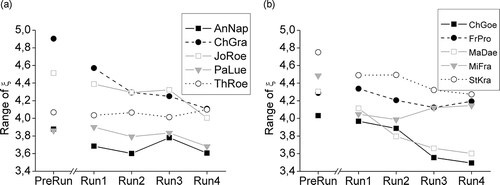
Another aspect is the calculation of the systems parameter in analogy to study 1. The determination of its range is a measure of the variability of the movement coordination. The diagrams in show that the variability of the movement coordination decreases immediately after the cycling exercise and in the further progress of the running, especially for sports students. Changes in single kinematical parameters of running immediately after a cycling exercise are only individual.
Figure 10. Mean ranges of the systems parameter to characterize the variability of the movement coordination. (a) Group 1 (triathletes); (b) group 2 (sports students) (study 3).
3.4. Study 4: Motion pattern analysis of gait in horseback riding
Horseback riding concerning the three interactive systems of horse, saddle and rider is a very complex movement which is difficult to characterize by single biomechanical parameter or characteristic curve. All these three components of the combined horse–rider system have their own geometry, inertia, elasticity, degrees of freedom, etc. Two components are moving actively driven by their intrinsic muscle system, the third moving passively, coupling the two active parts together. The horse and rider can learn to coordinate successfully their combined motion, which is intuitively felt by equestrians and described as ‘harmony’ [Citation15]. As mathematical procedure, the PCA was used. By means of this method, it should be proved whether the three gait patterns walk, trot and canter can be characterized by one or a few systems parameters. In the case that it is possible, the next step will be the determination of the systems parameter and the representation of its dynamics in a phase plane plot. On the basis of the qualitative description of the geometrical shape of the phase plot, identifications of differences between horseback ridings with two different saddles should be attempted. This could give a hint of the influence of the saddle type to the horse–rider system. For application of the PCA to horseback riding, the determination of a ‘pattern vector’ composed of the horizontal velocities of a set of 14 body markers was carried out. Thirteen sound horses were ridden with side saddle (SS) and English saddle (ES) at working walk, trot and canter in an indoor riding hall by the same horseman. The rider provoked the horses by increasing the velocity of different gaits. Motion was recorded with a motion analysis system consisting of six video cameras (sample frequency, 120 Hz).
shows the mean values of the eigenvalues for each horse according to saddle type. Only the first two components are shown, as the eigenvalues of the third component and those following all fall below 5%. In trot, the first component dominates in all 13 horses, all other components remain small. Therefore, it can be assumed that the movement coordination of trot can be described as sufficiently accurate with only one systems parameter.
Table 2. Averaged eigenvalues of the first and the second component for walk, trot and canter, separately for side saddle (SS) and English saddle (ES) (study 4)
Comparing the eigenvalues of the first component with Wilcoxon tests, no significant differences between SS and ES could be found for walk and canter. For trot, however, a potential influence of the saddle type on the eigenvalue of the first PCA component became apparent. The ES made the first component more pronounced. On the foundation of a study with 13 horses with the same rider, additional phase plane analyses related to the order parameter show a potential influence of the saddle type on movement coordination for the majority of horses [Citation16]. A more macroscopic speculative explanation might be that at trot horse and rider move in a more coordinated manner – a fact, however, which would appear rather counterintuitive to the general equestrian opinion frequently reporting that at trot it is more difficult to maintain a proper and stable sit than at walk or canter.
4. Conclusion
The study shows some examples for the practicability of the PCA in movement science. In particular, by means of this method the determination of only a few systems parameter helps to characterize the movement coordination. When only one parameter is satisfactory for describing the movement, the phase plots of this systems parameter can be used to distinguish between different movement patterns and to calculate the movement variability. Closed curves were obtained for walking and running, because they are cyclic and automated movements. The rehabilitation study shows in which way irregularities influence the gait pattern – particularly the PCA components. A qualitative relation between the rehabilitation process and the eigenvalue of the first component could be found. The range or the standard deviation of the systems parameter, which was calculated by the Haken–Friedrich–Uhl order parameter analysis, is useful to estimate the variability of the movement coordination. This was confirmed by the investigation of the transition from walking to running and the study of changes of running after cycling in triathlon. The PCA presents a useful method to characterize the movement coordination in its entirety. A specific application was the analysis of gait in horseback riding. By means of PCA, it was possible to find differences and similarities between walk, trot and canter. In addition, riding with different saddles shows variations in the movement coordination.
References
- Haken , H. 1996 . Principles of Brain Functioning , Berlin, Heidelberg : Springer .
- Kelso , J.A.S. 1997 . Relative timing in brain and behavior: Some observations about the generalized motor program and self-organized coordination dynamics . Hum. Mov. Sci. , 16 : 453 – 460 .
- Sadeghi , H. , Allard , P. and Duhaume , M. 1997 . Functional gait asymmetry in able-bodied subjects . Hum. Mov. Sci. , 16 : 243 – 258 .
- Braido , P. and Zhang , X. 2004 . Quantitative analysis of finger motion coordination in hand manipulative and gestic acts . Hum. Mov. Sci. , 22 : 661 – 678 .
- Wu , J. , Wang , J. and Liu , L. 2007 . Feature extraction via KPCA for classification of gait patterns . Hum. Mov. Sci. , 26 ( 3 ) : 393 – 411 .
- Mah , C.D. , Hulliger , M. and Lee , R.G. 1994 . Quantitative analysis of human movement synergies . J. Mot. Behav. , 26 ( 2 ) : 83 – 102 .
- Haas , R. 1995 . Bewegungserkennung und Bewegungsanalyse mit dem Synergetischen Computer . Shaker, Aachen ,
- Chen , H.H. and Saegusa , R. The quantification of PCA and NPLCA on change of DF in pedalo locomotion skill learning . 2nd International Congress of Complex Systems in Sport . Madeira.
- Chen , H.H. , Chuang , K.L. and Yang , L.C. The structured information for discriminating the table tennis services . 2nd International Congress of Complex Systems in Sport . Madeira.
- Candler , P.D. 1986 . Selected physiological, kinematical and psychological responses at the walk-to-run and run-to-walk interfaces . S. A. J. Res. Sport Phys. Educ. Recreation , 9 ( 2 ) : 15 – 26 .
- Hreljac , A. 1993 . Preferred and energetically optimal walk transition speeds in human locomotion . Med. Sci. Sports Exerc. , 25 ( 10 ) : 1158 – 1162 .
- Diedrich , F.J. and Warren , W.H. 1995 . Why change gaits? Dynamics of the walk-run transition . J. Exp. Psychol. Hum. Percept. Perform. , 21 ( 1 ) : 183 – 202 .
- Diedrich , F.J. and Warren , W.H. 1998 . The dynamics of gait transitions: effects of grade and load . J. Mot. Behav. , 30 : 60 – 78 .
- Haken , H. 1983 . Synergetics – An Introduction , Berlin, Heidelberg, NY : Springer .
- Peham , C. , Licka , T. , Kapaun , M. and Scheidl , M. 2001 . A new method to quantify harmony of the horse – rider system in dressage . Sports Eng. , 4 ( 2 ) : 95 – 101 .
- Witte , K. , Schobesberger , H. and Peham , C. 2009 . Motion pattern analysis of gait in horseback riding by means of principal component analysis . Hum. Mov. Sci. , 28 ( 3 ) : 394 – 405 .