
ABSTRACT
The interaction between teams behaviour is from high relevance for success in sports games. Since the analysis of this interaction is not well established, the present study attempts to model the interaction between opposing teams in team handball. Offensive and defensive playing patterns were determined by means of artificial neural networks from position data of 723 offensive action sequences and the corresponding defensive players, respectively. The most common combinations of these patterns were then analysed statistically. Pattern efficiency was assessed by scoring rate, distance between shooting position and nearest defensive player and distance to goal. No statistically significant relation between pattern combinations and efficiency was found. However, results revealed tendencies to higher efficiency of some tactical patterns. Furthermore, odds ratio analysis revealed advantageous defensive tactics against specific offensive behaviour. Summarizing, results indicate that artificial neural networks are appropriate to model the interaction between teams based on players’ positions.
Introduction
The causes for success in sports games are from high interest for practitioners as well as for scientists. In order to improve the efficiency of training and competition, performance indicators have to be evaluated to assess individual and team performance [Citation1]. Besides the development of physical skills like strength, endurance or agility, the technical and especially the tactical abilities are of prime importance. Therefore, the analysis of tactics in team sports is an essential factor for success.
In the analysis of sports performance, the application of computers for notational analysis enables the processing of a large amount of game elements [Citation2]. An early approach was to count specific actions, which can give a general overview about differences between players or teams and can reveal valuable information about the strengths and weaknesses [Citation3–Citation6]. However, the analysis of single actions can only give a superficial insight into the tactical behaviour of teams. Therefore, the analysis of actions sequences, i.e. chains of sequential single actions which are fundamental in sports games, has been suggested by Carling et al. [Citation7].
In the last years, different approaches were undertaken to get deeper insight into the complex behaviour of teams by analysing actions sequences. Koch and Tilp [Citation8] used qualitative information of actions within action sequences in order to conduct a quantitative analysis in beach volleyball. Other approaches analysed the chronological sequence of actions to find typical actions patterns, so-called ‘time-pattern’ (t-pattern). In a review, Jonsson et al. [Citation9] summarized the successful approaches in different types of sport where t-patterns were used. Such models of tactical behaviour advanced the insight into sports games by including the interaction of players of a team.
A challenge in performance analysis of sports games is to include accurate position data in the analysis. Due to the huge amount of different game situations and therefore unlimited different position combinations, classic statistical methods and above-mentioned approaches have limited applicability to gain suitable results.
In order to adequately model the behaviour, specifically the interaction within and between teams, the challenge of dealing with accurate position data is to simplify the huge amount of data. Therefore, different modelling solutions have been developed. Using non-linear statistical procedures like approximate entropy or relative phase analysis [Citation10–Citation13], movement patterns regarding the inter-player coordination and the interaction within the teams were examined by centroids of teams or groups of players and their distances among them. Furthermore, centroid positions and the surface area, changes in sub-group behaviour, and relations between groups and between teams were examined [Citation14–Citation18] for a better understanding of the inter-group and inter-team coordination. In another approach, Fonseca et al. [Citation19] focused on dominant regions by means of Voronoi diagrams and nearest teammate distances and thereby revealed different patterns of interaction between attackers and defenders.
Another possible solution for modelling players’ and teams’ behaviour by using accurate position data is the application of artificial neural networks. In several studies, it was shown that artificial neural networks are successful in classifying a huge amount of exact position data to patterns, which represent typical behaviour in game situations [Citation20–Citation24]. Typical playing patterns already help to understand teams’ tactics. Ultimately, a main goal of tactical analysis is to gain information of the team’s behaviour in dependence of the opponent’s behaviour. One approach analysing tactical interaction between groups like offence and defence was done by Perl and Memmert [Citation25] combining net-based pattern analysis with conventional statistical methods. In a first step, they pre-processed the huge amount of position data by means of the software tool SOCCER to get playground-independent position patterns. Subsequently, the self-organizing neural network DyCoN [Citation26] was fed with those patterns in order to group the formations into clusters. Recombining with the corresponding position and time data, SOCCER-based game analysis was realized concerning spatio-temporal distribution analysis, process analysis and tactics analysis. In a further study [Citation27], they enhanced their analyses by an automatic recognition of semantic information like ball win and loss, ball possessions, start of attacks and success of offence or defence activities. Grunz et al. [Citation28,Citation29] used a three-level design of artificial neural networks in order to analyse interaction between teams in soccer. In the first level, position data of subgroups are classified to get typical constellations. Within the second level, the analysis of the movement of the corresponding typified constellations is described separately for the opponent’s offence and defence with a pair of two networks. The complete typified description of the game situation is done at the third level by analysing the interaction between the typified movements of the defence, the offence and the ball. For semantic interpretation each neuron of the third level network was examined by an expert.
As successful behaviour is not restricted to the quantity of formations occurring in games, creative behaviour becomes important in order to produce rare and original decisions. Former approaches of artificial neural networks neglect the existence of this rare and original behaviour. Memmert and Perl [Citation30,Citation31] bridged this gap within a novel framework introducing the so-called quality neurons by combining the Dynamically Controlled Network and Growing Neural Gas. By classifying types of creativity learning, they showed the ability to analyse and simulate creative performance which may support trainers for optimizing individual training programmes.
In previous studies we already used artificial neural networks to identify offensive [Citation24,Citation32] and defensive [Citation33] playing patterns in team handball separately.
Whereas the success within a sports game depends on the interaction between offence and defence, it is necessary to combine both in the analysis. To the best of our knowledge, the interaction between offensive and defensive behaviour in team handball has not been modelled so far. Therefore, the aim of the present study is to merge the models of offensive and defensive behaviour in order to analyse the interaction between opposing teams.
Methods
For this study, the offensive as well as defensive behaviours of teams from 12 handball games from the EHF EURO-Men-18 Championship in Hard (Austria) were analysed. Using a custom-made measurement system, each game was recorded with eight cameras synchronously. Subsequently, the videos were analysed in a post-hoc process with the help of custom-made analysis software. Within this software, passing and shot actions were annotated and exact position data of the offensive as well as the defensive players were retrieved manually. A detailed description of the measurement system and its validity is described elsewhere [Citation32].
These actions were then connected to action sequences. Shot actions and the related previous five passes were considered for the analysis of the offensive tactics as shown in .
Figure 1. Schematic display of the ball path during the last five passes prior to the shot [P: pass; S: shot; solid line: running path; dashed line: passing path].
![Figure 1. Schematic display of the ball path during the last five passes prior to the shot [P: pass; S: shot; solid line: running path; dashed line: passing path].](/cms/asset/56e4f539-eeaa-42d9-9b16-936509e982a4/nmcm_a_1336733_f0001_oc.jpg)
In summary, 723 action sequences were obtained. Each action sequence includes the ground position of the shooting player as well as the passing players. For the latter, the ground positions of the passing and also of the receiving action are considered.
The position data of these action sequences were then analysed by means of artificial neural networks software (DYCON [Citation26]), in order to find typical patterns of offensive behaviour. The training of the artificial neural network follows the method used by Schrapf and Tilp [Citation24]. To obtain sufficient entropy for the training process of the network, the original data set of 723 action sequences was enlarged to a quantity of 7230 data sets, applying a noise of 5%. To minimize unwanted learning effects within the training process, data were also permutated. During the training process, the artificial neural network with a dimension of 400 neurons relates similar data sets to neurons. The assignment of the data sets to the neurons is adjusted by the parameters ‘tolerance’ and ‘similarity resolution’. The tolerance defines the similarity within the neurons, while the similarity resolution defines the alignment of neighbouring neurons to a cluster. A cluster itself then represents a typical pattern within the data set. For the determination of these parameters, different settings were tested and results were observed regarding the number of clusters and the difference between the patterns within a cluster. In order to point out typical offensive playing patterns, based on previously mentioned experiences, the tolerance was set to 9.0 and the similarity resolution was set to 53%.
Defensive behaviour was analysed similar to the pattern recognition of the offensive data. Position data of all defensive players at the instant of the shot were determined for each of the 723 action sequences used in the analysis of the offensive behaviour. Data sets were multiplied to a quantity of 7230 data set. In consequence of the minor distribution in the position data, a slightly higher noise of 10% and subsequent permutation was applied in order to gain suitable entropy within the training process of the network. Based on experiences from the offensive network, the parameters of the artificial neural network for the defensive analysis, which had also a dimension of 400 neurons, were set at 9.0 for the parameter tolerance and at 65% for the parameter similarity resolution.
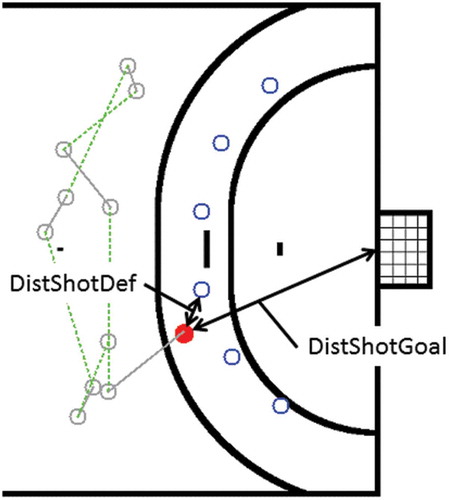
Thus, every rally could be related to an offensive cluster and its corresponding defensive cluster. In order to get meaningful results, only the pattern combinations which occurred eight times or more frequently were considered for further analysis. In order to estimate the success of each cluster combination, three criteria were defined. The basic criterion was if a goal was scored or not. Additionally, the distance between the shooting player and the nearest defending player (DistShotDef) as well as the distance of the shooting player to the centre of the goal (DistShotGoal) was calculated for every shot action as shown in .
Figure 2. Distance between the shooting player to the nearest defending player (DistShotDef) and distance between the shooting player and the centre of the goal (DistShotGoal).
Moreover, for each realized offensive–defensive cluster combination the mean values and the standard deviation (SD) of these parameters were calculated.
Finally, a statistical analysis of the pattern combinations, the scored goals and the calculated parameters were done. The relation between the pattern combinations of each offensive pattern and its corresponding defensive patterns was examined by Fisher’s exact tests regarding the goal success rate. Similarly, for each offensive cluster, odds ratios between the associated defensive patterns (=clusters) were calculated in order to assess the quality of different defensive patterns (=clusters). Differences regarding the DistShotDef parameter between the different defensive patterns of a corresponding offensive pattern were analysed by means of t-test and analysis of variance depending on the amount of defensive patterns.
Results
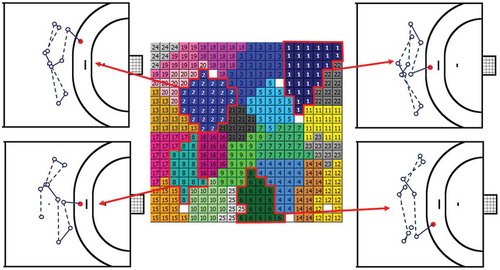
The training process of the artificial neural networks led to 25 offensive clusters, whereby 6 single neurons could not be assigned to a cluster. shows the network for the offensive data and exemplarily typical offensive patterns.
Figure 3. Result of the training process of the artificial neural network for the offensive position data. Clusters are represented by neurons with the same number. Exemplarily, some cluster representations (clusters 1, 2, 6 and 8) displaying the positions of the acting players (open circles, dashed and solid lines represent ball path and running path respectively, and solid circles represent shot position) are shown.
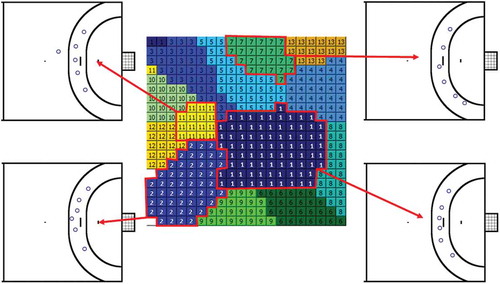
For the analysis of the defensive behaviour, the artificial neural network determined 13 defensive clusters and 2 neurons which could not be assigned to a cluster. Due to the smaller number of involved player positions in the defensive analysis (consideration of six positions towards 11 positions in the offensive analysis), the number of encountered defensive clusters is smaller than the number of offensive clusters. Moreover, the distribution of the players on a smaller area is also responsible for the smaller number of defensive patterns. The network for the defensive data and exemplarily typical defensive patterns are shown in .
Figure 4. Result of the training process of the artificial neural network for the defensive position data. Clusters are represented by neurons with the same number. Exemplarily, cluster representations (1, 2, 7 and 11) displaying the positions of the defensive players at the instant of the shot are shown.
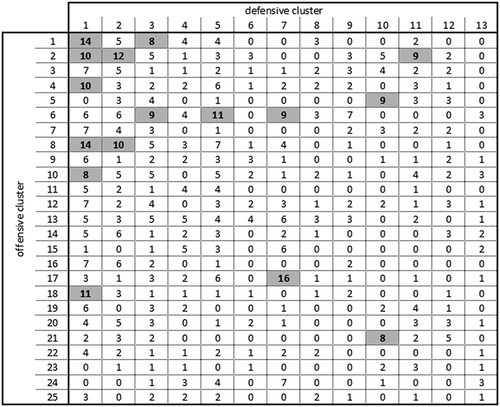
Out of 325 possible cluster combinations (25 offensive × 13 defensive), 214 combinations occurred within the analysed games. shows an overview of the frequencies of all combinations of offensive and defensive clusters, which occurred within the analysed games.
Figure 5. Overview of the frequencies of all cluster combinations. Combinations occurring eight times or more often are shaded in grey.
Of all realized cluster combinations, 16 combinations occurred 8 times or more often. The scoring rate of these combinations was between 30% and 90%. The average distance of the shooting player to the goal (DistanceShotGoal) for each cluster combination was in the range from 7.47 to 9.90 m, and the average distance between the shooting player and the nearest defending player (DistShotDef) was between 0.76 and 2.07 m. shows the number of goals scored, the scoring percentage, the average DistanceShotGoal (±SD) and the average DistShotDef (±SD) for each of these cluster combinations in detail.
Table 1. Frequency, goals scored, scoring rate, average distance (±SD) of the shooting player to the nearest defending player (DistanceShotDef) and to the goal (DistanceShotGoal).
No statistically significant relation between the cluster combinations and the goal success rate was found. However, results of the analysis of offensive cluster #1 revealed a tendency towards a higher effectiveness of the defensive cluster #1 compared to the defensive cluster #3 (p = 0.07).
Odds ratio analysis revealed that specific defensive behavioural patterns are favourable to others. As example, the chance to score with the offensive cluster #2 against the defensive cluster #1 was 6.43 times higher than against defensive cluster #2. shows the chances of success of different offensive patterns against defensive patterns by means of odds ratios.
Table 2. Odds ratios of the several offensive clusters against different corresponding defensive clusters (A and B).
For each offensive pattern, the DistShotDef parameter was compared between the corresponding defensive patterns. However, no significant differences were detected. Nevertheless, the results of the offensive clusters #6 and #1 showed a trend towards differences in the corresponding defensive patterns (p = 0.05 and 0.10, respectively).
Discussion
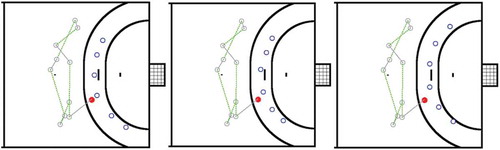
The results of the present study show that artificial neural networks are capable of determining offensive and defensive playing patterns in team handball based on player’s positions objectively. While several attempts to study offensive–defensive interaction processes have already been presented for soccer [Citation18,Citation22,Citation27–Citation29] or basketball [Citation15], to our knowledge this is the first study to address this topic in team handball. The combination of offensive and defensive patterns of the present study represents an adequate model for the analysis of interaction between handball teams. This allows studying the effectiveness (e.g. scoring rate, distance of shooting player to nearest defending player) of different defensive tactics against a specific offensive tactics ().
Figure 6. Offensive pattern #6 against corresponding defensive patterns. Please note that the indicated positions represent offensive and defensive patterns and not actual game situations.
It would be fair to assume that the scoring rate increases with increasing distance between the offensive and the nearest defensive player due to an increase of the available action space for the shooting player. However, this could not be confirmed by statistical analysis in our data. A possible reason for this could be the fact that the analysed data was from different teams with different players shooting at the goal. Therefore, the factor ‘individual player quality’ might have been greater than the factor ‘distance to nearest defensive player’ to reveal significant results. Furthermore, we did not take into account the behaviour or the quality of the goalkeeper which definitely affects the scoring rate but is hard to assess objectively.
Similarly, no significant differences between the different playing behaviours regarding scoring rate were observed. However, odds ratio analysis allowed comparing the chances of success of different defensive tactics against a specific offensive tactics. This analysis revealed that some patterns were more than six times more successful than others.
The proposed method augments the opportunities for tactical analysis for coaches and can support them in the development of offensive and defensive strategies in game preparation. The presented methodology will also be applicable in similar types of sports games like basketball or hockey where a great amount of standard situations and a restricted amount of players lead to standardized tactical behaviour.
However, results have to be taken with care due to possible shortcomings. In order to reveal general team tactics, additional data might enhance the analysis results. On the one hand, the number of data sets should be increased in order to strengthen the significance of results. On the other hand, not only the position data of the ball-possessing player, but also the position data of his/her teammates should be considered. Moreover, future attempts should include the time-motion behaviour of the defending players’ positions during the offensive action instead of only the positions at the moment of the shot. Another shortcoming may be that rare playing behaviour [Citation30,Citation31] would not be considered due to the type of the training process of the artificial neural network. Therefore, possibly important behaviour might not be detected.
Furthermore, the manual position determination method is time- and work-consuming. Using advanced tracking technologies or marker systems could simplify the position determination essentially. Since the subsequent analysis process by neural networks is done quickly, it is conceivable that results may be available between games in tourneys or even within half-time breaks in the future.
Acknowledgement
The authors acknowledge any financial interest of benefit they have arisen from the direct applications of their research.
References
- M. Hughes and R. Bartlett, The use of performance indicators in performance analysis, J. Sports Sci. 20 (2002), pp. 739–754. doi:10.1080/026404102320675602
- M. Hughes and I. Franks, The Essentials of Performance Analysis: An Introduction, Routledge, Abington, 2008.
- F.A.D. Campos, L.C.R. Stanganélli, L.C.B. Campos, B.N. Pasquarelli, and M.A. Gómez, Performance indicators analysis at Brazilian and Italian women’s volleyball leagues according to game location, game outcome, and set number, Perceptual Motor Skills: Exercise Sport 118 (2) (2014), pp. 347–361. doi:10.2466/30.25.PMS.118k19w4
- G. Costa, J. Afonso, E. Brant, and I. Mesquita, Differences in game patterns between male and female youth volleyball, Kinesiology 44 (1) (2012), pp. 60–66.
- P. Meletakos, G. Vagenas, and I. Bayios, A multivariate assessment of offensive performance indicators in men’s handball: trends and differences in the World Championships, Int. J. Perform. Anal. Sport. 11 (2011), pp. 284–294.
- A. Shortridge, K. Goldsberry, and M. Adams, Creating space to shoot: quantifying spatial relative field goal efficiency in basketball, J. Quantit. Anal. Sports 10 (3) (2014), pp. 303–313. doi:10.1515/jqas-2013-0094
- C. Carling, J. Bloomfield, L. Nelsen, and T. Reilly, The role of motion analysis in elite soccer: contemporary performance measurement techniques and work rate data, Sports Med. 38 (10) (2008), pp. 839–862. doi:10.2165/00007256-200838100-00004
- C. Koch and M. Tilp, Analysis of beach volleyball action sequences of female top athletes, J. Hum. Sport Exerc. 4 (3) (2009), pp. 272–283. doi:10.4100/jhse
- G.K. Jonsson, M.T. Anguera, P. Sanchez-Algarra, C. Olivera, J. Campanico, M. Castaner, C. Torrents, M. Dinusova, J. Chaverri, O. Camerino, and M.S. Magnusson, Application of T-pattern detection and analysis in sports research, Open Sports Sci. J. 3 (2010), pp. 95–104. doi:10.2174/1875399X010030100095
- J. Sampaio and V. Maçãs, Measuring tactical behaviour in football, Int. J. Sports Med. 33 (2012), pp. 395–401. doi:10.1055/s-0031-1301320
- B.V. Gonçalves, B.E. Figueira, V. Maçãs, and J. Sampaio, Effect of player position on movement behaviour, physical and physiological performances during an 11-a-side football game, J. Sports Sci. 32 (2) (2014), pp. 191–199. doi:10.1080/02640414.2013.816761
- L. Vilar, D. Araújo, K. Davids, and C. Button, The role of ecological dynamics in analysing performance in team sports, Sports Med. 42 (1) (2012), pp. 1–10. doi:10.2165/11596520-000000000-00000
- F. Walter, M. Lames, and T. McGarry, Analysis of sports performance as a dynamic system by means of relative phase, Int. J. Comput. Sci. Sports 6 (2) (2007), pp. 35–41.
- J. Bourbousson, C. Sève, and T. McGarry, Space-time coordination dynamics in basketball: part 1. Intra- and inter-couplings among player dyads, J. Sports Sci. 28 (3) (2010), pp. 339–347. doi:10.1080/02640410903503632
- J. Bourbousson, C. Séve, and T. McGarry, Space-time coordination dynamics in basketball: part 2. The interaction between the two teams, J. Sports Sci. 28 (3) (2010), pp.349-358. doi:10.1080/02640410903503640
- R. Duarte, D. Araújo, L. Freire, H. Folgado, O. Fernandes, and K. Davids, Intra- and inter-group coordination patterns reveal collective behaviors of football players near the scoring zone, Hum. Mov. Sci. 31 (2012), pp. 1639–1651. doi:10.1016/j.humov.2012.03.001
- W. Frencken, K. Lemmink, N. Delleman, and C. Visscher, Oscillations of centroid position and surface area of soccer teams in small-sided games, Eur. J. Sport Sci. 11 (4) (2011), pp. 215–223. doi:10.1080/17461391.2010.499967
- W. Frencken, H. De Poel, C. Visscher, and K. Lemmink, Variability of inter-team distances associated with match events in elite-standard soccer, J. Sports Sci. 30 (12) (2012), pp. 1207–1213. doi:10.1080/02640414.2012.703783
- S. Fonseca, J. Milho, B. Travassos, and D. Araújo, Spatial dynamics of team sports exposed by Voronoi diagrams, Hum. Mov. Sci. 31 (2012), pp. 1652–1659. doi:10.1016/j.humov.2012.04.006
- A. Glöckner, T. Heinen, J.G. Johnson, and M. Raab, Network approaches for expert decisions in sports, Hum. Mov. Sci. 31 (2012), pp. 318–333. doi:10.1016/j.humov.2010.11.002
- M. Kempe, A. Grunz, and D. Memmert, Detecting tactical patterns in basketball: comparison of merge self-organising maps and dynamic controlled neural networks, Eur. J. Sport Sci. 15 (4) (2015), pp. 249–255. doi:10.1080/17461391.2014.933882
- J. Perl, M. Tilp, A. Baca, and D. Memmert, Neural networks for analysing sports games, in Routledge Handbook of Sports Performance Analysis, T. McGarry, P. O’Donoghue, and J. Sampaio, eds., Routledge, New York, 2013, pp. 237–247.
- M. Pfeiffer and A. Hohmann, Applications of neural networks in training science, Hum. Mov. Sci. 31 (2012), pp. 344–359. doi:10.1016/j.humov.2010.11.004
- N. Schrapf and M. Tilp, Action sequence analysis in team handball, J. Hum. Sport Exerc. 8 (Proc3) (2013), pp. S615–621. doi:10.4100/jhse
- J. Perl and D. Memmert, Net-based game analysis by means of the software Tool SOCCER, Int. J. Comput. Sci. Sport 10 (2) (2011), pp. 77–84.
- J. Perl, Game analysis and control by means of continuously learning networks, Int. J. Perform. Anal. Sport. 2 (2002), pp. 21–35.
- J. Perl, A. Grunz, and D. Memmert, Tactics analysis in soccer – an advanced approach, Int. J. Comput. Sci. Sport 12 (1) (2013), pp. 33–44.
- A. Grunz, D. Memmert, and J. Perl, Tactical pattern recognition in soccer games by means of special self-organizing maps, Hum. Mov. Sci. 31 (2012), pp. 334–343. doi:10.1016/j.humov.2011.02.008
- A. Grunz, D. Memmert, and J. Perl, Analysis and simulation of actions in games by means of special self-organizing maps, Int. J. Comput. Sci. Sport 8 (1) (2012), pp. 22–36.
- D. Memmert and J. Perl, Analysis and simulation of creativity learning by means of artificial neural networks, Hum. Mov. Sci. 28 (2009), pp. 263–282. doi:10.1016/j.humov.2008.07.006
- D. Memmert and J. Perl, Game creativity analysis using neural networks, J. Sports Sci. 27 (2) (2009), pp. 139–149. doi:10.1080/02640410802442007
- P. Rudelsdorfer, N. Schrapf, H. Possegger, T. Mauthner, H. Bischof, and M. Tilp, A novel method for the analysis of sequential actions in team handball, Int. J. Comput. Sci. Sports 13 (1) (2014), pp. 69–84.
- M. Tilp and N. Schrapf, Analysis of tactical defensive behavior in team handball by means of artificial neural networks, IFAC-PapersOnline 01/2015 48 (1) (2015), pp. 784–785. doi:10.1016/j.ifacol.2015.05.169