
ABSTRACT
We describe an exploratory investigation of a dynamic digital map, inspired by videogame design. Participants followed a novel route through an urban environment, using a custom map that presented directional information for off-screen landmark locations. Spatial orientation (pointing to remembered landmarks) in this group was compared to participants using a static version of the same custom map (without the directional cues) and an additional control group that used a static mobile map from the public domain. Participants using the dynamic map were most accurate in making egocentric orientation judgments, although groups did not appear to differ in their configural spatial knowledge. These data suggest that landmark persistence may help users to build more accurate on-line representations of their spatial orientation.
1. Introducton
Knowing which direction to head in, when in an unfamiliar environment, can be a challenge, with or without a map to help us. Knowledge of our current spatial orientation can be required at the start of a walk, but also at any point along the way if we need to reorient. As we move through a landscape our relationship with that environment is continually changing, making the process of updating spatial orientation both complex and dynamic (Golledge, Citation1999). If using a static cartographic portrayal to support this task, then the user must attempt to associate the generalized geometries on the map with the environmental features that they see around them. Proximal and distal landmarks also play a fundamental role in enabling navigators to position themselves on the map, remain oriented, and calculate heading (Burnett, Citation2000; Burnett, Smith & May, Citation2001; Davies & Peebles, Citation2010; May, Ross, Bayer & Tarkiainen, Citation2003; Smith, Citation2009; Snowdon & Kray, Citation2009). This process of self-localization is fundamentally supported by map symbols, especially where they represent landmarks that are visible from that physical location – these have been termed helpful symbols by Kiefer, Giannopoulos and Raubal (Citation2014).
In recent years, in-field spatial orientation is more likely to be supported by digital geospatial technologies. This has placed greater emphasis on the requirement to acknowledge the way in which maps, or other abstractions of the local environment, need to be interpreted by users during a particular activity, and to design them accordingly (Brown & Perry, Citation2002). Whist a paper map may provide an overview of an area being traversed, digital maps on mobile devices typically focus on the immediate area around the user, which can result in a more fragmented understanding of the area as a whole (Willis, Hölscher, Wilbertz & Li, Citation2009). If, therefore, new designs are to replicate the power of a paper map, by offering both detail and overview, they will need to exploit the dynamic and interactive capabilities of the mobile device, but also to work within its constraints of screen size and visibility.
A particularly useful form of map-based guidance is to exploit the direction of travel in order to offer turn-by-turn instructions to the user, which can be relatively easy to interpret in an egocentric (i.e. viewer-centered) framework. However, this may not meet the challenges associated with situations where the user is not currently moving but needs to orientate themselves within the surrounding environment. This “drop-off” orientation can occur during wayfinding when someone needs to re-orientate with a distant and, perhaps, invisible landmark (Peebles, Davies & Mora, Citation2007). Such “global” landmarks have been shown to be critical for orientation in virtual environments (Steck & Mallot, Citation2000), as well as in real-world navigational instructions and map reading (Anacta et al., Citation2017). Extending this principle, Schwering et al. (Citation2017) explored the use of navigational instructions that used descriptive terms relating to the broad structure of the environment, such as “away from the city centre.” It is, therefore, worthwhile exploring the combination of local (i.e. proximal and visible) and global (i.e. distal and, potentially, invisible) information to support activities that may require navigation along a route whilst maintaining orientation within the broader environment. An example of this from the context of in-car navigation is provided by Löwen, Krukar and Schwering (Citation2019), where local and global information was combined in a single map, and represented in an inset map on the projected display of a driving simulation. In this case, a city-wide map presented the broader context, with detail along a chosen route being displayed as symbols. There are implications for the design of pedestrian mobile map interfaces, however, in relation to the extent of map displayed and how the user can explore that map (Chen & Li, Citation2020). Schmid, Richter and Peters (Citation2010) describe the development of “Route Aware Maps” that focus on isolating route-specific information, only showing the broad regions through which the user is passing, and adding detail of the wider landscape at selected critical points such as at the start and end of the route. Restricting the extent of the area mapped may not necessarily disrupt the wayfinding task itself (i.e. route following) but it may affect the user’s ability to judge directions or distances to anything outside of their immediate surroundings (Dillemuth, Citation2009).
The design of interfaces that allow users to focus on detail, but also to see the broader context, is a challenge cutting across many disciplines (Cockburn et al., Citation2009). Baudisch, Good, Bellotti and Schraedley (Citation2002) evaluate some of the approaches used for maps on computer screens including overview maps, multi-scale maps and zooming. The use of overview maps can offer context to a more detailed map of the area of specific interest to the user but the switching between two alternative representations at different scales can impose additional cognitive load (Hornbaek, Bederson & Plaisant, Citation2002). In the context of supporting navigation tasks, Burigat, Chittaro and Gabrielli (Citation2008) suggest that the effectiveness of overview maps is influenced by how meaningful and useful the information content of those maps is. Multi-scale maps have a detailed local map in the center moving to more regional scales around it, using a continuous “fisheye” effect or through a series of steps, but either way disrupting the cartography and its ability to convey distance. Zooming out to an overview scale can provide context but can also require additional cognitive load in assimilating map content that typically changes between map scales, where features forming a local frame of reference may not be represented by symbols at the next “zoom level.”
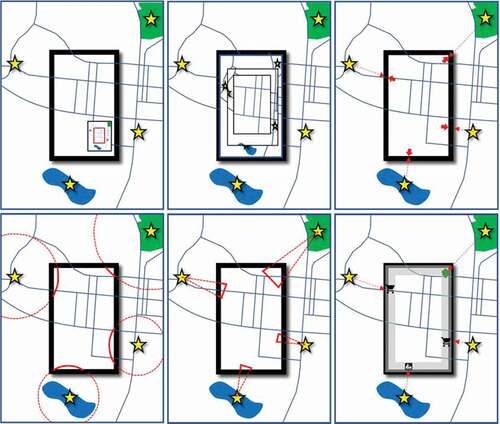
On small-screen devices, one technique for maintaining focus on local detail whilst also representing wider spatial context is to indicate features of interest that are “off the screen” by some kind of marker around the edge of the local map. For example, Baudisch and Rosenholtz (Citation2003) presented the “Halo” system, which utilized circles around off-screen features of interest. These were dynamically scaled to intersect the edge of the screen, so that nearer objects were indicated by arcs with a smaller radius. They found that spatial reasoning tasks were performed faster (although less accurately) compared to a directional arrow marked with distance. This was likely due to difficulties in estimating distances from the arcs alone, but it demonstrated promise in terms of dynamic visualization of off-screen content. A “Wedge” system, developed by Gustafson, Baudisch, Gutwin and Irani (Citation2008), appeared to offer better indicators of distance when compared to circles and arrows by Burigat and Chittaro (Citation2011). illustrates the wedge and halo techniques, along with a number of alternative approaches discussed here, including the use of edge symbols described in this paper.
Figure 1. Some alternative approaches to visualizing off-screen landmarks: Overview and Detail (upper left), Focus and Context (upper center), Arrows (upper right), Halo (lower left), Wedge (lower center) and Edge Symbols as explored in this study (lower right).
These previous studies suggest that spatial orientation is less dependent on the ability to judge distances to landmarks than it is on knowing the direction to particular features of interest, and so the spatial arrangement of landmarks in the surrounding landscape may be of more primary importance. An approach to addressing this question could be to exploit the relationship between symbols and the landmarks they represent, as well as the manner in which they are presented to the user. MacEachren (Citation2004) states that “maps are imbued with meaning by virtue of semiotic relationships” (p.213). These semiotic relationships relate to the link between a map symbol and the real-world content that it is designed to represent. A study employing eye-tracking by Keil, Edler, Dickmann and Kuchinke (Citation2019), which focussed on recognition tasks using OpenStreetMap on computer monitors, recognized that there is a trade-off between the simplicity and visual salience of symbols and their meaningfulness. This could be seen to be even more important when considering the design of a mobile map to support orientation with the surrounding landscape.
Map symbols could be considered critical for representing landmarks, and would ideally be portrayed in a consistent way, to represent both local features and those considered to be global (i.e. forming part of the broader spatial context). In order to achieve this, map symbols placed around the edge of the local map, indicating the direction to landmarks of particular types that are “off the map,” might avoid the conscious zooming of the screen and help to represent some of the spatial context that might support spatial orientation with the broader landscape. The rationale for the continuous display of symbols representing off-screen landmarks of interest is supported indirectly by the work of Liverence and Scholl (Citation2015), who emphasize the importance of object persistence in graphical interfaces. This is, of course, not a novel idea, and videogame designers have very successfully explored the use of in-game mapping systems where a mini-map showing local detail might be augmented with dynamic map symbols, representing different task-related landmarks or targets, around its edge. A variety of mini-maps have also been employed within virtual reality environments (Edler et al, Citation2019), either showing the user’s location on the whole game area (world-oriented mini-map) or showing the local area centered on the user (character-oriented mini-map). Clarity of design, requiring minimal time to consult the map and its symbols, is crucial for supporting more efficient task completion as explored using eye-tracking within Head-Mounted Displays by Zagata, Gulij, Halik and Medynska-Gulij (Citation2021).
Invention within these designs is driven by the demands of the game, and one of the heuristics of game design detailed by Pinelle, Wong and Stach (Citation2008) is the need to keep visual representations, including maps, simple and easy to interpret. Such designs often work with a very small area of screen space, recommended not to exceed 10% of the display area (Adams, Citation2014). Potential differences in activity aside, the contexts within which in-game maps support orientation and navigation around complex and busy virtual environments is not too dissimilar to using a small screen-based mobile device to support spatial orientation within a real-world environment. As such, there may be great potential in the cross-pollination of mapping solutions from fictional contexts (e.g. Los Santos) into real-world ones.
In the present report we describe an exploratory investigation in which we examined the real-world use of game-like mobile maps. In particular, we wished to emulate the functionality of these solutions whilst maintaining the simplicity of design (in both the cartographic backdrops and the symbols used) that typifies this genre. We developed mobile maps that represent off-screen landmarks with cartographic symbols around the edge of the map, with the intention of examining whether this might effectively support spatial orientation within an urban environment. In an attempt to impose an empirical framework over a usability investigation, we conducted a between groups study to compare how different mapping solutions might affect judgments of orientation in-route, as well as a final configural representation of the route followed. Participants followed a novel route around an urban environment and were required to make pointing judgments to previously-encountered (and, now, invisible) landmarks at regular intervals. Two groups used a bespoke mapping solution – one with a game-like dynamical updating of symbols, and another where the symbols were statically fixed in location. A control group used a common mapping application in the public domain. By requiring participants to make pointing judgments along the route, we sought to gain a quantitative assay of their ability to update their spatial orientation along the route, and to examine whether their accuracy was affected by the map used. At the end of the route we asked participants to place remembered landmarks on a blank base map of the test area, and also to draw the route itself. We discuss some patterns evident in these data, and their implications, as well as more qualitative insights gleaned from video observations.
2. Method
2.1. Participants
A total of 30 participants took part in this study. Of this sample, 17 were participants were female and the entire cohort had a mean age of 22.4 years (SD 4.305; range = 18–41 years). Nine participants had never entered the experimental area before, and the remaining participants indicated that they had visited it on fewer than three previous occasions and had not thoroughly explored the area. All participants were smartphone owners, and all but two had experience of using mobile maps. Participants were randomly and equally allocated to one of the three conditions.
2.2. Apparatus and materials
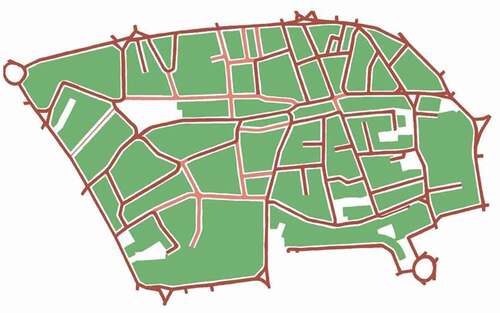
Participants were required to navigate an urban space using either one of two custom apps, or by using a common mapping solution in the public domain (Google Maps). All apps were hosted on a Google Nexus 5 smartphone device with a five inch (12.7 cm) screen. Bespoke apps were built for the Android operating system using a combination of Java and XML programming languages. They were compiled using the Google Maps Application Programming Interface (API), with custom base maps placed over the default Google Map. Custom maps comprised a raster image derived using Ordnance Survey open data for the experimental area. The simple map system of “Pokémon Go!” informed its design, with green forms representing blocks of space (either open, or occupied by buildings) and contrasting red forms representing thoroughfares through the space. A darker red was used for roads, and a lighter red for pedestrianized streets and narrow paths (see ).
Figure 2. Design of the base map for the Static and Dynamic maps.
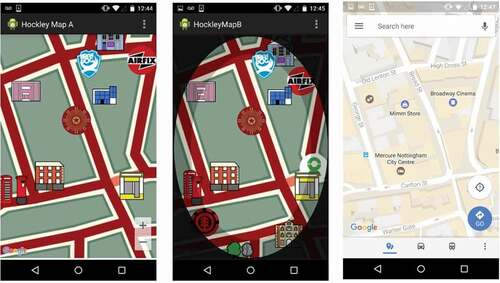
The base map was implemented in two distinct apps: the Static Symbols Map and the Dynamic Symbols Map. Both apps featured a series of bespoke navigational landmark symbols placed across the map. The Static Symbols Map displayed the base map with the symbols occupying a fixed position that corresponded to their respective landmark’s real-world location. The Dynamic Symbols Map used the same symbols and base map but used the video game mini-map style, with an ovoid visible section of map. Symbols positioned on the visible section of map were displayed at the landmark’s corresponding location, but off-screen landmarks had their symbol positioned on the border region of the map, indicating their direction relative to the visible region. When users interacted with either map (e.g. move, rotate) the symbols would not move relative to the map but would rotate to appear upright regardless of the map’s rotation on the display. Implementation of the Dynamic Symbols Map required additional code to plot the symbols at different locations, depending on where the map was positioned on screen, and this is available from the authors by request.
In addition to the Static Symbols Map and the Dynamic Symbols Map, Google Maps was included as a third option to act as a control, likely to be familiar to users navigating using their mobile phone. For a comparison of all three approaches tested, see . The interest in this paper is in the relative performance of the static and dynamic versions of simplified basemap and pictorial symbols rather than comparing them to Google Maps. If comparisons with Google Maps were to be made, then the different in information content in the basemaps would have to be acknowledged. Eye-tracking studies using maps on computer screens have demonstrated that user attention is attracted away from routes and landmarks by additional basemap content such as buildings (Keil, Mocnik, Edler, Dickmann & Kuchinke, Citation2018). It has also been shown that visual complexity in urban basemaps may have a more distracting effect that in rural environments (Keil, Edler, Kuchinke & Dickmann, Citation2020). We reflect further on issues related to base mapping in the discussion.
Figure 3. Screenshots of the three map conditions used: Static (left), Dynamic (center) and Google Maps (right).
All of the apps tested were implemented with the device’s inbuilt location capabilities disabled. This prevented the participant’s location from being displayed on the device and meant that the participant had to actively calculate their location with the help of the symbols displayed. Similarly, the map did not automatically move to keep the user’s position centered, nor did it automatically rotate to maintain a head-up display. These measures removed several elements that a mobile map user may expect, focusing attention on the inherent cartographic properties of the maps themselves. The user could manually move the display by panning, zooming and rotating both the control map and the static symbols map. However due to limitations of the dynamic symbols map, and how the symbols were displayed on the border region, it was not possible to zoom or rotate the map, though panning was possible. Because of this unavoidable difference between maps, zooming and rotation functions were not explicitly mentioned to participants – i.e. participants with the apps that could zoom and rotate were not explicitly told to avoid these interactional gestures, nor were they encouraged to do so.
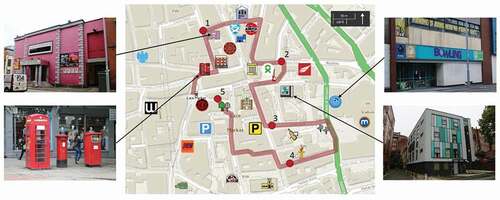
The landmarks included in the map were selected on the basis that they were salient features within their immediate surroundings, and that they afforded transformation into a simple map symbol of some kind. As such, any logos, branding, or semantic content for the landmarks was not essential, but an advantage. If an area included multiple landmarks that adhered to these criteria then the most visually salient was selected, so as to avoid onscreen clutter. Some landmarks that were not directly encountered along the route, but proximal to the testing area, were also included to prevent the map from seeming too leading or prescriptive. shows the route, all map symbols, and a selection of photographs for comparison.
Figure 4. The route with landmarks indicated by map symbols, with experimental stops shown as numbered circles.
Symbols were initially created using vector software Inkscape, then exported as raster images, reduced to 100 × 100 pixels, and finalized in Photoshop. The design process for these symbols fell into two broad categories, depending on the nature of the landmark. Those that were primarily distinguished by their physical characteristics (i.e. form and color) were represented as a simplified analogue of the object. So for example, a cluster of red municipal items (i.e. a telephone box and post boxes), or a large theater that is painted a bright shade of pink, were represented by icons that caricaturised the design of these objects and adopted the same color scheme. In contrast, other landmarks were more salient in terms of their function, such as a particular bar, model shop, or church housed in a building that was previously residential. In these cases, their signs/logos, or a symbol that was indicative of their function, was used as the map symbol. In the case of preexisting signs and logos, some simplification was made to their design in order to remove texture and flatten the image. The design of all symbols was pictorial, such that they functioned without the need for a legend (Robinson, Morrison, Muehrcke, Kimerling & Guptill, Citation1995) and were more readily identified than geometric designs (Forrest, Citation1998). The designs were unique to each landmark, and included logos and branding designs whenever appropriate, as suggested by Burnett (Citation2000).
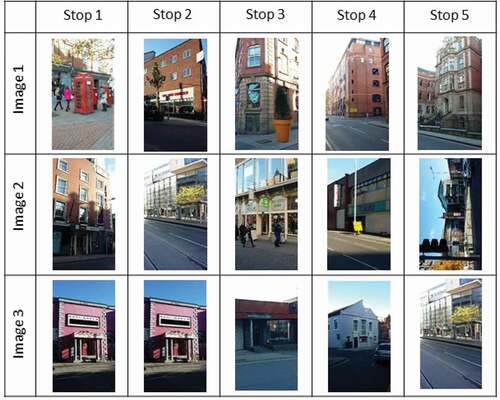
A number of these landmarks were chosen to be used as test items at each of the stopping points, which were presented as pictorial stimuli for participants to indicate their direction (with a pointing response). Not every landmark that appeared on the map was tested, and the selection of test landmarks including items that were at a range of distances from the stopping point, and at a variety of different of angles from the stopping point. shows the images that were used at each stop along the route.
Figure 5. Landmark images presented at each stop. Note the repetition of Image 3 across Stops 1 and 2, which was intended to remind participants that previous landmarks from any point along the route might be probed (rather than only the most recent segment).
2.3. Design and procedure
Participants were tested in a section of Nottingham city center that the majority of University students do not frequently visit. This area was identified as having a number of salient visual landmarks, along with frequent junctions that allowed for a complex route to be planned over a relatively short Euclidean distance, and with few direct lines of sight to previously-visited areas. The area is primarily of Victorian construction, and includes high street businesses, bars and eateries, churches, theaters, and repurposed factory buildings. The town planning mixes grid and curvilinear systems, open spaces, and narrow alleyways. An experimental route was devised to cover as much of the area as possible, allowing for at least one “experimental” landmark to be visible at all times. The route covered a distance of 1300 m in total, and was divided into five sections of between 200 m and 290 m in length. Stopping points between these sections enabled a procedure for participant knowledge to be probed.
Each participant was initially greeted at the University of Nottingham campus, approximately three miles away from the test area. The full procedure was explained and, following the opportunity for questions and the provision of signed consent, participants completed a brief demographic questionnaire and a copy of the Santa Barbara Sense of Direction Scale (SBSOD: Hegarty, Richardson, Montello, Lovelace & Subbiah, Citation2002). They were then escorted, by tram, to the beginning of the test route (i.e. which started from the tram stop in the testing area). Whilst waiting for the tram to arrive at the University stop, the participant was asked to complete a practice of the pointing exercise by indicating the direction of the building at which they had met the researcher. A compass was then placed against their fingertip and it was explained that this compass reading would be recorded with the video camera. The tram route itself did not provide any view of the test area, and so the test session began with participants being unfamiliar with the landmarks and territory that they were about to be presented with.
Once at the start of the route, the participant was given the smartphone device with the map loaded. The researcher recited a verbal description of the app’s functionality and provided an opportunity for participants to interact with it (e.g. pan, zoom and rotate) to be sure they were comfortable. Once the participant had confirmed that they understood, the researcher began recording with the video camera and led the participant along the route. They were instructed to follow the researcher and to learn the route, using the map to maintain a sense of their location and orientation in the environment around them. At each of the five stopping points the participant was asked to stop walking then, first, to point in the direction of the previous stopping point (which was not visible to them from that location). In the case of the first stopping point the participant had to point back to the start where they disembarked from the tram. Participants were then consecutively presented with photographs (displayed as full screen color images on an iPad) of three landmarks that they had passed at some point along the route (i.e. not confined to the most recent section). For each image they were asked to point in the direction of the landmark depicted (which was, again, not visible from that vantage point) and the researcher recorded their response by placing a compass against the participant’s finger and recording the scene using the video camera. They were neither discouraged nor encouraged to use the map to make this judgment – i.e. no explicit instruction was provided. The entirety of this task was recorded on the video camera by the researcher, allowing measurement of direction judgments and respective response times (i.e. the temporal duration between being presented with an image and producing a pointing response), as well as qualitative information such as exploratory behavior or spontaneous commentary.
After the fifth and final stopping point at the end of the route, the participant was asked to indicate the route that they had traveled along, along with all of the landmarks that they remembered encountering. To do this, they were provided with a grayscale version of the base map, shown in , and a black ballpoint pen. The beginning of the route (i.e. where they disembarked from the tram) was indicated with a circle, and participants were encouraged to trace their route through the street plan and indicate the identity and location of the landmarks that they could recall. No time limit was indicated, although most participants completed this within approximately two minutes. The participant was briefly interviewed about their experience, and asked the following questions: how difficult they found the task; whether it was more difficult to keep track of their own location or the position of landmarks; whether they enjoyed the experience of using the map and, if so, whether they would use it again; and, finally, whether there were any aspects of the app they would change. Finally, continuous video footage of the participant undertaking the exercise was captured by the researcher in order to make a qualitative assessment of behavior patterns along the route.
3. Results
3.1. Direction estimation
At each of the stopping locations, participants indicated the perceived direction of named landmarks by making a pointing response. The accuracy of their responses was calculated by taking the absolute difference between the bearing they indicated and the actual bearing of the landmark location. Taking an unsigned measure of error equated responses that were either, say, 10° clockwise or anticlockwise of the correct direction (i.e. the maximum possible error was 180°), and a Shapiro-Wilkes test revealed this data to be normally distributed (W (30) = .964, p = .382). illustrates the general pattern of pointing data, with grand means plotted by condition, at each stopping location. Mean pointing errors, collapsed across landmarks and stopping locations, were entered into a one-way Analysis of Variance, with map condition (Control, Static, Dynamic) as a between-subjects factor. This revealed a significant main effect of condition: F (2, 27) = 4.904, p = .015, η2 = .266. Subsequent post-hoc Tukey tests showed that performance in the Dynamic condition (mean error = 24.383°, SD = 7.104) was significantly more accurate than performance by participants in the Control (i.e. Google Maps) condition (mean error = 37.945°, SD = 10.939) (p = .12). Participants in the Static condition (mean error = 32.353°, SD = 10.678) were not significantly different from participants in either the Dynamic (p = .179) or Control (p = .416) conditions. A similar one-way ANOVA was performed on response times, measured from video recordings as the duration (in seconds) between prompt and response. This revealed no significant effect of condition on response times: F (2, 27) = .313, p = .734, η2 = .023.
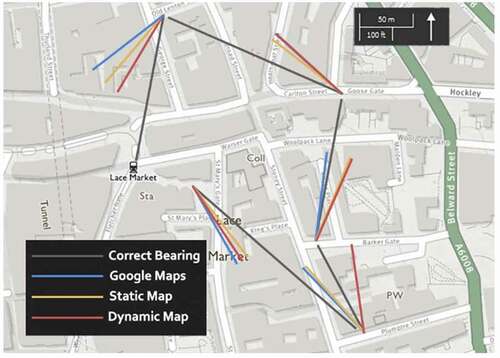
Figure 6. Mean pointing angles to the previous stop.
Additional analyses examined whether there were any differences in direction estimation according to the stopping location, thus providing insight into performance across time. Mean angular error was entered into a mixed-design ANOVA, with stopping location as a within-subjects factor (i.e. five levels, one for each location) and map condition as a between-subjects factor. Analysis revealed a significant between-subjects effect of map condition: F (2, 27) = 5.774, p = .008, η2 = .300. Post-hoc Tukey tests confirmed the preceding pattern of data, with more accurate performance in Dynamic participants compared to the Control participants (p = .006), but no difference between Control and Static (p = .403) or Static and Dynamic (p = .117) participants. There was also a significant within-subjects effect of location: F (2, 27) = 4.586, p = .001, η2 = .152. Follow-up paired-sample t-tests confirmed a relatively U-shaped pattern of performance, where Location 1 performance was significantly worse than Location 2 (t = 3.126, df = 29, p = .004), and Location 5 was significantly worse than Locations 2 (t = −3.138, df = 29, p = .004), 3 (t = 3.004, df = 29, p = .005), and 4 (t = 2.788, df = 29, p = .009) (all other ps > .050). Finally, there was no evidence for a map condition x stopping location interaction: F (8, 108) = .283, p = .970, η2 = .021.
Mean response times were also subjected to a mixed-design ANOVA, with stopping location as a within-subjects factor (i.e. five levels, one for each location) and map condition as a between-subjects factor. This analysis revealed no main effect of map condition (F (2, 27) = .412, p = .666, η2 = .030), and no map condition x stopping location interaction (F (2, 27) = 2.796, p = .079, η2 = .127). There was, however, a significant within-subjects effect of stopping location: F (2, 27) = 11.487, p = .002, η2 = .298. Follow-up paired-sample t-tests revealed that participants were significant faster to make a response at Location 1 than at every other Location (all ps ≤ .002), and there were no other significant pair-wise effects between Locations (all ps > .050).
3.2. Map mark-up exercise
After completing the final pointing exercise participants were asked to draw the route and any landmarks that they could remember on a blank base map of the city center. Note that they were not explicitly asked to recall only the landmarks that they had been probed on. However, probed landmarks were selected on the basis of being the most salient feature within their immediate surroundings and, perhaps accordingly, no participant included a landmark that had not been a previous probe item. Their maps were scored according to the protocol specified by Coluccia, Iosue and Brandimonte (Citation2007), with separate measures of landmark accuracy (i.e. percentage of landmarks correctly included), landmark location accuracy (i.e. the percentage of those landmarks that were placed within 2 cm of the correct geographical location), and route memory (i.e. the percentage of route sections that were correctly placed between turns/decision-points). Two examples are illustrated in . Whilst there was a numerical difference between landmark accuracy scores (Control: M = 16.191%, SD = 7.169; Static: M = 31.429%, SD = 23.242; Dynamic: M = 33.333%, SD = 20.327), this did not reach the level of significance in a one-way ANOVA: F (2, 27) = 2.636, p = .090, η2 = .163. Similar differences across landmark location accuracy scores (Control: M = 12.857%, SD = 7.116; Static: M = 29.048%, SD = 20.992; Dynamic: M = 31.429%, SD = 22.017) did not quite reach significance (F (2, 27) = 3.139, p = .059, η2 = .189), and neither did those in route accuracy data (Control: M = 48.125%, SD = 26.688; Static: M = 51.250%, SD = 3.334; Dynamic: M = 70.000%, SD = 26.291): F (2, 27) = 1.604, p = .110, η2 = .106.
Figure 7. Examples of marked up maps: In the example on the left the participant was unable recall much detail of the route or the landmarks, whereas the participant on the right identified the route with high accuracy and recalled a large proportion of landmarks.
3.3. Individual differences
SBSOD scores were analyzed as a quotient – i.e. the positively phrased items were reverse coded, the scores for all items were then summed, and a percentage of the total possible score was calculated. In this way, participants are distributed along a continuum where a score of 100 denotes the highest possible perceived sense of direction, and increasingly lower scores represent poorer perceived ability. A one-way ANOVA revealed no difference between groups on the basis of SBSOD scores: F (2, 27) = .092, p = .912, η2 = .007. To investigate whether variation within any of the dependent measures was predicted by participants’ navigational abilities (as measured by the SBSOD), irrespective of the map condition group they were placed in, a series of linear regressions were conducted. Overall measures of pointing performance did not appear to be reliably predicted by SBSOD score – self-reported sense of direction predicted neither the grand mean for pointing accuracy (collapsed across stopping location) (R2 = .050, F (1,28) = 1.460, p = .237), nor the grand mean for pointing response times (R2 = .043, F (1,28) = 1.261, p = .271). There was, however, a reliable positive relationship for overall performance in the sketch map task: R2 = .299, F (1, 28) = 11.950, p = .002). In this case, higher SBSOD scores significantly predicted greater success at sketch map drawing (i.e. the grand mean across information types) (β = .547, p = .002). These data are illustrated in .
Figure 8. Scatterplots illustrating the relationship between SBSOD (expressed as a quotient) and overall pointing error (A), overall pointing response time (B), and map mark-up accuracy (C).
Participants were randomly assigned to groups, and so neither age nor gender were controlled across conditions. A one-way ANOVA revealed no difference between groups on the basis of age (F (2, 27) = .868, p = .431, η2 = .060), but the ratio of females to males did differ between groups: Google = 60% female; Static = 30% female; Dynamic = 80% female. In order to ascertain whether participant gender had an effect on performance, irrespective of map condition, a series of one-way ANOVAs were conducted. They revealed no effect of gender for the grand mean for pointing accuracy (F (1, 28) = 2.458, p = .128, η2 = .081), the grand mean for pointing response times (F (1, 28) < .000, p = .989, η2 < .000), overall performance in the sketch map task (F (1, 28) = 1.103, p = .303, η2 = .038) or SBSOD score (F (1, 28) = 3.594, p = .068, η2 = .114).
3.4. Video observation and feedback
Most participants behaved differently during the first section of the route than in subsequent sections, looking back and forth from the smartphone device frequently, and often turning themselves to look at everything in their surroundings. For the remainder of the route, the following behavior types were noted against each participant: whether the participant primarily focussed on the device or their environment; whether they were making short glances back and forth or extended looks at each; whether they rotated the device; and, whether they clearly became confused or disoriented at some point during the exercise. presents a summary of the counts of these observed behaviors.
Table 1. Numbers of participants exhibiting certain behaviors during the task
The primary focus of attention across all groups was the environment, rather than the mobile device. However, when seen together with the glancing behavior, a greater proportion of the dynamic map group displayed a much more frequent changing of focus between their phone and the environment. In terms of reorienting the device, there was evidence of some desire to do this, although as the functionality of the three apps varied with respect to rotating the map these data should be interpreted cautiously. There were a few instances of confusion observed in both Google Maps and Static Maps groups, although it was not possible to attribute this to any particular issue or location along the route. When asked afterward about the difficulty of the exercise only 2 of the Dynamic Maps group considered it difficult, compared to 8 and 7 for the Google Map and Static Map groups, respectively.
4. Discussion
In the present exploratory investigation, we studied the utility of different mobile mapping solutions, inspired by navigational interfaces that have been employed in video games. Participants followed a route around an unfamiliar urban environment, and they were asked to keep track of their location using one of three systems – a custom map with static landmark icons, a custom map with dynamic landmark icons placed around the edge of the map and, as a control, a common mapping application in the public domain (Google Maps). Spatial representation of the test environment was probed along the route, by asking participants to point to landmarks that had been visited, and at the end of the route with a map mark-up task. Comparisons between groups revealed differential effects of the mobile maps, depending on the measure applied. These findings not only suggest that some aspects of navigation may be more likely to benefit from supporting devices than others, but they also reveal a potential interaction between individual differences in navigational ability and these different forms of spatial knowledge. Underpinning the issues is a more general discussion of the methods and assumptions that we commonly apply in interdisciplinary investigations such as this study.
Spatial orientation within the test environment was probed at regular intervals along the route by asking participants to make egocentric pointing judgments to previously seen landmarks. Analysis of angular error revealed a significant effect of map group on pointing accuracy, with the most accurate responses emanating from the Dynamic group, and the least accurate responses from the Control group. This suggests that dynamically updating landmark directions in relation to the navigator has a beneficial effect on their ability to update location and orientation whilst learning a novel route. Accuracy was not linearly related to the point along the route at which it was tested – performance at the first and final stopping locations was generally poorer than the other points along the route – and there were no effects of map group on response times. As such, mapping solutions that explicitly maintain a directional relationship between the navigator and features of the surrounding environment may directly facilitate awareness of the same real-world relationships in a manner that is updated throughout a route. Participants in the Static group performed somewhere between participants in the other two groups, suggesting that the inclusion of more salient or functional landmark symbols can have some effect on maintaining their directional relationship to the navigator, although not to the same degree as a dynamic map. This overall pattern of results is not necessarily of a great surprise (i.e. participants viewing dynamically-updating directional information were more adept at making dynamic directional judgments), but it clearly supports the argument that modifications to mapping solutions can directly support judgments made on the basis of that information.
Directional judgments have previously been used to measure the learning of large-scale spatial layout (e.g. Hegarty, Montello, Richardson, Ishikawa & Lovelace, Citation2006; Hegarty et al., Citation2002), although past studies have usually administered this kind of measure after the entire route has been traversed. The timing of the assessment (i.e. during route learning, or after the fact) carries ramifications for what type of information the test measured, since an in-field directional judgment could be made on the basis of a configural survey-like representation (i.e. allocentric information) or on the basis of a continually-updated vector from a given location (i.e. egocentric information) (see: Burgess, Citation2006). Since the most accurate performance in this task was associated with the Dynamic map, this may point to an effect at the egocentric level, in that participants may have been more likely to continually update their location and orientation when using a system that supports or highlights that form of representation. It is important to remember, however, that participants were not explicitly forbidden from inspecting their map prior to make their responses, and so it may not be appropriate to be too categorical about the type of spatial reasoning that was being encouraged in the Dynamic group. As such, these findings may reflect less the mental representation that participants built and more their ability to co-register map details with the surrounding environment and their place within it. If a Google Map user remembered encountering a probed landmark, but could not recall where they had seen it, then there was little that the map could do to help them make the necessary calculation. However, because the dynamic map showed the direction to many landmarks, both on and off the map, it was possible for participants using this solution to track down the landmark in question. Once again, in these terms the results may not be particularly surprising (i.e. participants using a map displaying egocentric directional information were more accurate at providing egocentric directional judgments), but they further strengthen the case for modification of mobile maps to strategically support in-field positional judgments.
At the end of the route, participants were provided with a blank base map of the environment and asked to represent the locations of remembered landmarks, along with the route that they had navigated. Compared to the pointing measure, this task is perhaps more unambiguous in its assessment of allocentric knowledge – i.e. a survey-like representation of the environment, independent of current viewpoint, that was probed subsequent to route learning and produced without potential for support from the map or from immediate surroundings. There was, however, no reliable effect of map group on this measure – although there was a numerical difference between groups that mirrored the pattern seen in the pointing task, comparisons did not quite reach statistical significance. This, therefore, suggests that the manipulation of participants’ mapping support did not affect the overall fidelity of allocentric survey knowledge. Differences between information types could, however, indicate that some aspects of the route were easier for participants to recall than others, with greater overall accuracy for route memory, compared to landmark memory and landmark location memory (acknowledging the dependency between these latter factors).
Relatively poor landmark memory across all participants may reflect the relative difficulty of such thinking within a complex urban environment, but it is perhaps surprising given the clear focus on landmarks through the route learning phase. Moreover, one might predict that a clear difference between control and static/dynamic maps would favor landmark memory in the latter groups. One issue to acknowledge is that although the map symbols were deliberately pictorial, the landmarks themselves were perhaps less memorable in the longer term. As one participant pointed out, they felt they may have performed better if the study site had been in Paris! Also, not all of the probed landmarks were marked on Google Maps, so even if a participant had been aware of a given landmark, they may not think of it as sufficiently significant to include on the sketch map, or they could have struggled to decide upon a simple method to represent it. In contrast, several participants who used the static and dynamic symbols produced quick drawings of the symbols they had encountered on the maps, suggesting that a simple iconography had been created. In the absence of a reliable effect, then, it may be that landmarks were represented sufficiently well to perform on-line directional judgments in the short-term but were secondary to route-based information when representing the environment as a whole.
Overall performance in both tasks was also analyzed independently of experimental group to examine whether it was related to individual differences in everyday navigational ability. Here we found that the SBSOD reliably predicted performance in the map mark-up task, with more proficient navigators producing more accurate drawings overall. This may, therefore, account for the absence of a group-based effect in this task, since individual strengths and weaknesses in navigation may have had a greater impact on performance than the maps used. Interestingly, however, SBSOD was not found to predict pointing performance. This runs counter to the findings of Hegarty et al. (Citation2002); (Citation2006) who report positive relationships between SBSOD scores and directional judgment tasks (i.e. both from memory, and in the absence of vision). That said, the differences between the current paradigm and those that they have employed may account for our failure to reveal similar relationships. Perhaps chief among them is the fact that our participants were not only required to learn a route, but also to continually update their location on a mobile map. Allocation of attention to both real-world and representational stimuli may, therefore, present a particular form of spatial thinking that is not captured by the SBSOD. This point aside, the differential relationships between navigational ability and performance across these tasks suggests that modifications to mobile mapping systems may not necessarily produce benefits that are equivalent across users or problems.
Although the patterns of data are mixed, they do seem to point to some utility in emphasizing landmark permanence through dynamic and iconic symbology. This particular study focussed on a dense urban environment, with the design of pictorial map symbols reflecting a frame of reference based around visually distinct buildings or familiar logos. In order for this approach to be transferrable to supporting spatial orientation in more natural settings, the design of symbols would need to be reconsidered to better represent a different frame of reference. This could explore symbols that are less pictorial or, on the contrary, photographs to convey the subtle uniqueness of some natural landmarks (Snowdon & Kray, Citation2009). This could also support a more explorative style of navigation based around unexpected features of interest or to help the user gain a better understanding of landscape features around them.
In considering the ramifications of this work, it may also be useful to examine its scientific context. The activities reported here were the product of a collaborative exercise between scientists within geospatial technology and experimental psychology. Of course, this is not the first example of such an endeavor in our respective fields, but it can be useful to reflect on the differential methodologies that are adopted in these subjects, and the challenges associated with producing a dataset that reflects the requirements of each. In the present case, the general procedure was oriented to general geospatial usability protocols, where the “naturalness” of the task is emphasized. As such, participants were presented with relatively few constraints during the experimental session – for example, they were not presented with explicit instructions or constraints when following the route, and the collection of orientation data was not controlled in the same way that it might be in a laboratory task. On the other hand, the tasks that participants were required to perform were not necessarily related to a clear “problem,” and they were required to make very similar judgments on multiple trials. This provides a mixed-methods context that possesses some positive features, not least a combination of ecological validity and quantitative empirical testing. However, therein also lies some of the difficulties, since emphasizing one aspect of a design might minimize others. From an experimental psychology standpoint, for instance, lack of control in the orientation judgment task might preclude us from disentangling a participant’s current spatial awareness from the contribution of the map to task performance. In contrast, from a geospatial technology perspective, the specification of certain controls, or adoption of parametric behavioral testing protocols, may very well divorce an insight from the very context in which it was intended to be derived.
It was our hope that the imposition of an experimental approach would not only provide a more objective assay of usability than a qualitative interpretation of experience, but also a route toward a finer grain of insight in interdisciplinary and mixed-method investigation. However, additional points of conflict between fields can also lie in the constraints that their traditional methods impose upon a paradigm. In the context of geospatial science, a study with as many participants as were included here could be considered reasonable, especially given the very data-heavy approach (including full video recording of each session). Alternatively, for the experimental psychologist, a formal between-groups comparison between three different conditions would likely be considered under-powered with N = 10 participants per group. This, therefore, means that future endeavors of this nature may need to be more formally aligned to one tradition or the other. For the geospatial scientist, this could mean losing participants in the name of a finer grain of qualitative insight. For the experimental psychologist, that could then require the abandonment of null hypothesis significance testing (with its associated statistical assumptions) in the name of a more descriptive approach. Alternatively, it might emphasize the necessity for a more Spartan method that can support the number of participants necessary to confer appropriate statistical power in the application of parametric analytic methods. The exploratory nature of this study, and the volume of data being collected, precluded the testing of a suitable number of participants to achieve this latter alternative – i.e. studies in the psychological literature than test for between-group differences in map-reading performance (e.g. Yamamoto & DeGirolamo, Citation2012) tend to report reliable effects from group sizes of N = 24. In turn, therefore, a more thorough examination of the statistical methods that we apply, including the chosen alpha level, might be a fruitful means to overcome some of these issues – e.g. we applied the conventional alpha level of 1/20 (.05), but this need not be a foregone conclusion (see: Lakens et al., Citation2018).
More generally, there are features of the current paradigm that may require further consideration for future studies within this research programme. An aforementioned factor is the relative lack of control over participants’ interactions with maps whilst making orientation judgments, and the impact of this could be examined more formally. The manner in which pointing data were collected may also have affected how participants made their judgments. For example, it is possible that participants could have been able to read the compass that was placed against their finger to produce a measure, thus providing feedback. Whilst this is unlikely, since the compass was at arm’s length and there was no indication of the correct answer, a fully blinded system might be appropriate. In addition, whilst the map mark-up measure was constrained to remove some of the potential difficulties associated with analysis of map drawing (e.g. variability between participants in terms of workspace use, or graphic production skills), it is possible that it precluded the collection of more discriminatory measures. As such, one could assess landmark location memory separately from landmark memory (e.g. by requiring participants to place landmark tokens at the correct location, subsequent to a memory probe). Finally, whilst the control condition (i.e. Google Maps) was included to confirm the general usability of the bespoke maps, it may obscure the more important comparison between static and dynamic representations of landmark location. The bespoke maps provided a simplification of the test environment, compared to Google Maps, with fewer landmarks and extraneous information, and so it could be argued that the paucity of distracting information on them enabled participants to focus on the most important information (i.e. landmark location). Since this investigation confirms the general navigational usability of our bespoke mapping solution, future studies can perhaps now concentrate on key tests of different features. Here, the focus was on the dynamic nature of the display, but the role of landmark symbols (e.g. iconography, density, size, etc.), user interactivity (e.g. panning, zooming, rotating, etc.) and base maps, can all be examined in relation to the creation of meaningful mental representations of navigational space in the user.
The qualitative assessment of in-field behaviors here suggested the Dynamic map group appeared to experience less confusion, and did not consider the task particularly difficult. These are insights that might have otherwise been missed, but there is much scope for future methodologies to allow for more specific coding or mapping of such observations. Conducting this study “in the wild” was a realistic test, given that many aspects of a busy urban environment cannot be tested in a laboratory setting (Rogers, Citation2011). Mobile eye tracking might, therefore, provide a useful solution for providing a richer data set of looking behavior than the video recordings that we made, and would open up interesting possibilities for codifying behaviors and even mapping them in relation to stages of the route or behavioral response. A finer granularity of measurement and mapping of the glancing between device and environment may help to explain how people use map interfaces in the wild, particularly if participants are encouraged to vocalize their actions. For example, the continuous presence of some landmarks as symbols on the edge of the Dynamic map could be studied from the perspective of object persistence in graphical interfaces (Liverence & Scholl, Citation2015). More importantly, it would enable us to understand how participants treat static and dynamic symbols when they are represented on the same platform, but differ in their stability (as was a feature of the dynamic map here).
One of the affordances of a conventional paper map is to allow the user to effortlessly switch gaze between local detail and the broader spatial context represented on a large map sheet. This cannot be fully replicated on a small screen mobile device, but there are capabilities of such devices that allow us to design alternative approaches to portraying map information. Representing off-screen landmarks with symbols moving around the edge of the map is one example of how we might utilize the highly dynamic and interactive capabilities of mobile devices. Whilst this does not convey the broader spatial structure of the surrounding environment, including linear features like rivers or areal features like parks, it offers an example of how we can consider designs that differ from conventional cartographic representations. It is also an example of how mobile devices let us create dynamic map portrayals that reflect a more egocentric frame of reference. In this paper we have attempted to isolate the potential benefits of using edge symbols to provide a persistent representation of off-screen landmarks in addition to the symbols locked to the local map area. Amongst many other variables we did not account for was the effectiveness of alternative styles of symbol and we believe there is an interesting research challenge in exploring the situational relevance of various symbol types when used in the context of the landmarks they represent. For example, the dynamic map could employ different sets of symbols that explore the form of the landmark, its function, and in some cases iconic imagery or even branding associated with it. Geospatial science should continue to adopt a wide range of methods to explore how new forms of cartographic representation can be used effectively in support of different activities in outdoor settings, including in the wild studies of prototype applications.
There are clearly many factors to unpick when exploring the relationship between dynamic cartographic representations and the real world environments to which they relate. It seems reasonable to suggest however, on the basis of the current study, that mobile map displays that offer a more persistent display of key graphical elements related to off-screen features could better support spatial orientation.
Disclosure statement
No potential conflict of interest was reported by the author(s).
Additional information
Funding
References
- Adams, E. (2014). Fundamentals of game design (3rd ed.). Indianapolis: New Riders.
- Anacta, V. J. A., Schwering, A., Li, R., & Muenzer, S. (2017). Orientation information in wayfinding instructions: evidences from human verbal and visual instructions. Geo Journal, 82(3), 567–583.
- Baudisch, P., Good, N., Bellotti, V., & Schraedley, P. (2002) Keeping things in context: A comparative evaluation of focus plus context screens, overviews, and zooming. Proc. Conference on Human Factors in Computing Systems (CHI 2002), ACM Press, pp. 259–266.
- Baudisch, P., & Rosenholtz, R. (2003). Halo: a technique for visualizing off-screen objects. In Proceedings of the SIGCHI conference on Human factors in computing systems (pp. 481–488).
- Brown, B., & Perry, M. (2002). Of maps and guidebooks: Designing geographical technologies. Proceedings of the 4th conference on Designing interactive systems: processes, practices, methods, and techniques, London, UK, pp. 246–254. 25 – 28 June.
- Burgess, N. (2006). Spatial memory: How egocentric and allocentric combine. Trends in Cognitive Sciences, 10(12), 551–557. doi:10.1016/j.tics.2006.10.005
- Burigat, S., & Chittaro, L. (2011). Visualizing references to off-screen content on mobile devices: A comparison of Arrows, Wedge, and overview+detail. Interacting with Computers, 23(2), 156–166. doi:10.1016/j.intcom.2011.02.005
- Burigat, S., Chittaro, L., & Gabrielli, S. (2008). Navigation techniques for small-screen devices: An evaluation on maps and web pages. International Journal of Human-Computer Studies, 66(2), 78–97. doi:10.1016/j.ijhcs.2007.08.006
- Burnett, G. (2000). ‘Turn right at the traffic lights’: The requirement for landmarks in vehicle navigation systems. The Journal of Navigation, 53(3), 499–510. doi:10.1017/S0373463300001028
- Burnett, G., Smith, D., & May, A. (2001). Supporting the navigation task: Characteristics of ‘good’ landmarks. Contemporary Ergonomics, 1, 441–446.
- Chen, C.-H., & Li, X. (2020). Spatial knowledge acquisition with mobile maps: Effects of map size on users’ wayfinding performance with interactive interfaces. ISPRS International Journal of Geo-Information, 9(11), 614. doi:10.3390/ijgi9110614
- Cockburn, A., Karlson, A., & Bederson, B. B. (2009). A review of overview+ detail, zooming, and focus+ context interfaces. ACM Computing Surveys (CSUR), 41(1), 1–31.
- Coluccia, E., Iosue, G., & Brandimonte, M. A. (2007). The relationship between map drawing and spatial orientation abilities: A study of gender differences. Journal of Environmental Psychology, 27(2), 135–144. doi:10.1016/j.jenvp.2006.12.005
- Davies, C., & Peebles, D. (2010). Spaces or scenes: Map-based orientation in urban environments. Spatial Cognition and Computation, 10(2–3), 135–156. doi:10.1080/13875861003759289
- Dillemuth, J. A. (2009). Navigation tasks with small-display maps: The sum of the parts does not equal the whole. Cartographica: The International Journal for Geographic Information and Geovisualization, 44(3), 187–200. doi:10.3138/carto.44.3.187
- Edler, D., Keil, J., Wiedenlübbert, T., Sossna, M., Kühne, O., & Dickmann, F. (2019). Immersive VR experience of redeveloped post-industrial sites: The example of “Zeche Holland” in Bochum-Wattenscheid. KN-Journal of Cartography and Geographic Information, 69(4), 267–284.
- Forrest, D. (1998). On the design of point symbols for tourist maps: Enclosed or not enclosed is not the question! The Cartographic Journal, 35(1), 79–81. doi:10.1179/caj.1998.35.1.79
- Golledge, R. G. (1999). Human wayfinding and cognitive maps. In Wayfinding behavior: Cognitive mapping and other spatial processes (pp. 5–45). Baltimore, MD: Johns Hopkins Press.
- Gustafson, S., Baudisch, P., Gutwin, C., & Irani, P., 2008. Wedge: Clutter-free visualization of off-screen locations. In: Proc. Conference on Human factors in Computing Systems (CHI ’08), ACM Press, pp. 787–796.
- Hegarty, M., Montello, D. R., Richardson, A. E., Ishikawa, T., & Lovelace, K. (2006). Spatial abilities at different scales: Individual differences in aptitude-test performance and spatial-layout learning. Intelligence, 34(2), 151–176. doi:10.1016/j.intell.2005.09.005
- Hegarty, M., Richardson, A. E., Montello, D. R., Lovelace, K., & Subbiah, I. (2002). Development of a self-report measure of environmental spatial ability. Intelligence, 30(5), 425–447. doi:10.1016/S0160-2896(02)00116-2
- Hornbaek, K., Bederson, B., & Plaisant, C. (2002). Navigation patterns and usability of zoomable user interfaces with and without an overview. ACM Transactions on Computer-Human Interaction, 9(4), 362–389. doi:10.1145/586081.586086
- Keil, J., Edler, D., Dickmann, F., & Kuchinke, L. (2019). Meaningfulness of landmark pictograms reduces visual salience and recognition performance. Applied Ergonomics, 75, 214–220. doi:10.1016/j.apergo.2018.10.008
- Keil, J., Edler, D., Kuchinke, L., & Dickmann, F. (2020). Effects of visual map complexity on the attentional processing of landmarks. Plos one, 15(3), e0229575. doi:10.1371/journal.pone.0229575
- Keil, J., Mocnik, F. B., Edler, D., Dickmann, F., & Kuchinke, L. (2018). Reduction of map information regulates visual attention without affecting route recognition performance. ISPRS International Journal of Geo-information, 7(12), 1–13. doi:10.3390/ijgi7120469
- Kiefer, P., Giannopoulos, I., & Raubal, M. (2014). Where am I? investigating map matching during selflocalization with mobile eye tracking in an urban environment. Transactions in GIS, 18(5), 660–686.
- Lakens, D., Adolfi, F.G., Albers, C.J., Anvari, F., Apps, M.A., Argamon, S.E., Baguley, T., Becker, R.B., Benning, S.D., Bradford, D.E. and Buchanan, E.M. (2018). Justify your alpha.Nature Human Behaviour, 2(3), 168–171.
- Liverence, B. M., & Scholl, B. J. (2015). Object persistence enhances spatial navigation: A case study in smartphone vision science. Psychological Science, 26(7), 955–963. doi:10.1177/0956797614547705
- Löwen, H., Krukar, J., & Schwering, A. (2019). Spatial learning with orientation maps: The influence of different environmental features on spatial knowledge acquisition. ISPRS International Journal of Geo-Information, 8(3), 149. doi:10.3390/ijgi8030149
- MacEachren, A. M. (2004). How maps work: Representation, visualisation and design. New York, USA: The Guilford Press.
- May, A. J., Ross, T., Bayer, S. H., & Tarkiainen, M. J. (2003). Pedestrian navigation aids: Information requirements and design implications. Personal and Ubiquitous Computing, 7(6), 331–338. doi:10.1007/s00779-003-0248-5
- Peebles, D., Davies, C., & Mora, R., 2007. Effects of geometry, landmarks and orientation strategies in the ‘drop-off’ orientation task. Proceedings of the 8th International Conference on Spatial Information Theory, COSIT’07, Berlin, Heidelberg, Springer-Verlag, pp. 390–405.
- Pinelle, D., Wong, N., & Stach, T. (2008). Heuristic evaluation for games: Usability principles for video game design. Proceedings of the SIGCHI Conference on Human Factors in Computing Systems, Florence, Italy, pp. 1453–1462, 05 – 10 April.
- Robinson, A. H., Morrison, J. L., Muehrcke, P. C., Kimerling, A. J., & Guptill, S. C. (1995). Elements of Cartography (6th ed.). New Jersey, USA: John Wiley and Sons inc.
- Rogers, Y. (2011). Interaction design gone wild: Striving for wild theory. Interactions, 18(4), 58–62. doi:10.1145/1978822.1978834
- Schmid, F., Richter, K. F., & Peters, D. (2010). Route aware maps: Multigranular wayfinding assistance. Spatial Cognition and Computation, 10(2–3), 184–206. doi:10.1080/13875861003592748
- Schwering, A., Li, R., Schwering, A., Krukar, J., Li, R., Anacta, V. J., & Fuest, S. (2017). Wayfinding Through Orientation. Spatial Cognition and Computation, 17(4), 273–303. doi:10.1080/13875868.2017.1322597
- Smith, A. D. (2009). Beyond SatNav: Using the global positioning system as a tool for the behavioural sciences. School Science Review, 90(333), 99–103.
- Snowdon, C., & Kray, C. (2009). Exploring the use of landmarks for mobile navigation support in natural environments. Proceedings of the 11th international conference on human-computer interaction with mobile devices and services, Bonn, Germany, 15 – 18 September.
- Steck, S. D., & Mallot, H. A. (2000). The role of global and local landmarks in virtual environment navigation. Presence: Teleoperators & Virtual Environments, 9(1), 69–83. doi:10.1162/105474600566628
- Willis, K. S., Hölscher, C., Wilbertz, G., & Li, C. (2009). A comparison of spatial knowledge acquisition with maps and mobile maps. Computers, Environment and Urban Systems, 33(2), 100–110. doi:10.1016/j.compenvurbsys.2009.01.004
- Yamamoto, N., & DeGirolamo, G. J. (2012). Differential effects of aging on spatial learning through exploratory navigation and map reading. Frontiers in Aging Neuroscience, 4, 14. doi:10.3389/fnagi.2012.00014
- Zagata, K., Gulij, J., Halik, L., & Medynska-Gulij, B. (2021). Mini-map for gamers who walk and teleport in a virtual stronghold. ISPRS International Journal of Geo-Information, 10(2), 96. doi:10.3390/ijgi10020096