
Abstract
Context: Neutralizing the over-activation of oxidative stress and inflammation remains an important goal in the management of type 2 diabetes mellitus (T2DM). Centella asiatica (L.) Urban (Apiaceae) (CA) has been used in traditional folklore in Africa and Asia to treat various ailments including diabetes.
Objective: We investigated the hepatic antioxidant and anti-inflammatory potential of methanol extract of CA leaves in T2DM.
Materials and methods: T2DM was induced in male Sprague-Dawley rats with 10% fructose in drinking water for 14 days followed by a single intraperitoneal injection of streptozotocin (40 mg/kg b.wt). Hepatic oxidant/antioxidant status was assessed by measuring the concentrations of malondialdehyde (MDA), ferric reducing antioxidant power (FRAP), oxygen radical absorbance capacity (ORAC), Trolox equivalent antioxidant capacity (TEAC), reduced glutathione (GSH) and activities of glutathione S-transferase (GST) and glutathione peroxidase (GPX). The concentrations of cytokines IL-1β, IL-4, IL-6, IL-10, MCP-1 and TNF-α in the liver were determined.
Results: Diabetes increased MDA formed (47%) and reduced FRAP (20%), TEAC (15%), GSH levels (32%), significantly; decreased GST and GPX activities in the liver and elevated levels of cytokines studied. Treatment of diabetic rats with 500 mg/kg b.wt CA for 14 days decreased MDA (44%); elevated FRAP (15%) and GSH (131%) levels and increased the activities of GST and GPX by 16%. Hepatic concentrations of IL-1β, MCP-1 and TNF-α in DCA group were reduced to 68%, 75% and 63% of DC values, respectively.
Conclusions: The antioxidant and anti-inflammatory properties of CA may protect tissues such as the liver from diabetes-induced oxidative damage.
Introduction
Type 2 diabetes mellitus (T2DM) is a long-term metabolic disease arising from multiple aetiologies but easily diagnosed by an abnormal increase in the blood glucose level. It occurs as a result of decreased sensitivity to insulin and/or inadequate insulin secretion resulting from partial reduction in the number or function of pancreatic β cells (Fonseca Citation2009). Current evidence supports the theory of inflammation-mediated development of T2DM (Akash et al. Citation2013; Cruz et al. Citation2013; Esser et al. Citation2014). An increase in macrophages, leucocytes and monocytes infiltration together with an elevation in pro-inflammatory cytokines, has been observed in several diabetic animal models as well as in diabetic patients (Duran-Salgado & Rubio-Guerra Citation2014; Guo et al. Citation2014). The inhibition of important protein activities in the insulin signalling pathway by pro-inflammatory processes has been shown to reduce insulin sensitivity and promote insulin resistance signalling (Cruz et al. Citation2013).
The activation of inflammatory processes in T2DM can also be triggered by an unabated production of free radicals, lipid peroxidation products and advanced glycated end-products in the diabetic milieu which partially inhibit pancreatic β cell functions exacerbating the symptoms of the disease (Akash et al. Citation2013). The persistent increase in reactive species accompanied by a decrease in antioxidant activity leads to the occurrence of oxidative stress which can cause endothelial dysfunction, insulin resistance and alterations in number and functions of pancreatic β cells (Oyenihi et al. Citation2015). In T2DM, oxidative stress and inflammation have been described as ‘key partners’, since they mostly act reversibly and synergistically to effect cellular events leading to the development of diabetic complications including hepatopathy (Rains & Jain Citation2011). Targeting oxidative stress and inflammation is a major strategy employed by many therapeutic agents in the management of T2DM (Agrawal & Kant Citation2014).
Insulin resistance, a prominent feature in T2DM, has been associated with dyslipidemia which further exacerbates the disease conditions (Gadi & Samaha Citation2007). Diabetes-induced hyperlipidemia and dyslipidemia are major risk factors for atherosclerosis and cardiovascular complications, and are easily described by increased blood levels of total cholesterol (TC), triglycerides (TG), low-density lipoprotein cholesterol (LDL-c) and decreased high-density lipoprotein cholesterol (HDL-c) (Mahamuni et al. Citation2012; Ma et al. Citation2014). Abnormal levels of lipid parameters have been observed in type 2 diabetic patients (de Vries et al. Citation2015) and diabetic rat model (Li et al. Citation2011).
The number of people living with T2DM keeps increasing every year. However, the majority of conventional therapeutics employed in the management is becoming ineffective. This may be due to the elevated costs of therapy and the side effects that have been linked with such treatments (Moller Citation2001). Thus, global attention is being shifted gradually towards the search for safe, affordable, natural, plant-derived medicines to act as alternative and/or complementary therapy. Centella asiatica (L.) Urban (Apiaceae) is a tropical plant that has been used in African, Ayurvedic and Chinese medicines to treat a variety of diseases for generations (Gohil et al. Citation2010). C. asiatica (CA) has demonstrated potent antioxidant (Siddique et al. Citation2014), antiproliferative (Mutua et al. Citation2013) and antimicrobial (Norrapoke et al. Citation2014) effects. Recently, the antihyperglycemic and antidiabetic properties of CA have been reported (Kabir et al. Citation2014). However, the antioxidant and anti-inflammatory mechanisms of the plant in T2DM are not yet fully described. Therefore, we investigated the effects of methanol extract of CA leaves on hepatic oxidative stress and inflammatory cytokines in an animal model of T2DM that exhibits both insulin resistance and insufficiency.
Materials and methods
Chemicals
All chemicals and biochemicals used were of analytical grade and purchased from Sigma-Aldrich (St. Louis, MO) through Capital Labs, New Germany, South Africa or Merck (Darmstadt, Germany) through Merck, Halfway House, South Africa, except when stated otherwise.
Extraction of plant material
Fresh leaves of C. asiatica (CA) were collected within the Westville Campus of University of KwaZulu-Natal, South Africa and immediately authenticated by Prof. A. Nicholas of the Discipline of Biological Sciences in the same University. A voucher specimen (Dladla 02) was deposited in the Ward Herbarium of the University of KwaZulu-Natal, Westville Campus. After drying the leaves at room temperature, they were made into powder using an electric grinder following which 100 g of the powder were subsequently extracted with 1 L of methanol by continuous stirring for 72 h. Thereafter, the mixture was filtered and evaporated to dryness at 60 °C. This gave an extract yield of 19% dry weight which was stored at −20 °C until needed.
Ethics statement/animal handling
Upon approval from the University of KwaZulu-Natal Animal Ethics Committee (Reference 024/15/Animal), 32 male Sprague-Dawley rats (150–180 g) were procured from the Biomedical Resource Unit (BRU) at Westville campus of the University of KwaZulu-Natal, South Africa. The animals were housed two rats per cage in a temperature and humidity controlled room (23 ± 1 °C, 40–60% humidity) with a set 12 h light–dark cycle and fed with commercially available rat chow diet and water ad libitum throughout the experimental period. All animals received humane care according to the principles of Laboratory Animal Care of the National Society of Medical Research and the National Institutes of Health Guide for the Care and Use of Laboratory Animals of the National Academy of Sciences (National Institutes of Health publication no. 80-23, revised 1978).
Induction of type 2 diabetes
Diabetes was induced in 24 rats by having them drink 10% fructose solution ad libitum for 14 days followed by a single intraperitoneal (i.p.) injection of low dose streptozotocin (STZ, 40 mg/kg b.wt) in freshly prepared 0.1 M citrate buffer (pH 4.5) after an overnight fast. This animal model has been reported to induce T2DM symptoms that closely resemble human patients because it causes delayed insulin sensitivity as well as partially destroying the pancreatic β cells population (Wilson & Islam Citation2012). Blood was obtained by once-off tail prick and glucose levels determined using a Accu-Chek Aviva Nano Glucometer (Roche, Basel, Switzerland) a week after STZ injection. Animals having fasting blood glucose values within 7–18 mM at day 21 that is 7 days after the STZ injection were considered as having stable diabetes. However, animals used for the study had glucose values of 12–18 mM to avoid those animals that might revert to normal glucose status.
Experimental design
Animals were divided randomly into four groups as follows: NC, normal control rats orally treated with deionized water; DC, diabetic control rats orally treated with deionized water; DCA, diabetic rats orally treated with C. asiatica extract (500 mg/kg b.wt) dissolved in deionized water and DME, diabetic rats orally treated with the standard antidiabetic drug, metformin (300 mg/kg b.wt) dissolved in deionized water. NC group was given water ad libitum for 14 days prior to a single intraperitoneal injection of freshly prepared citrate buffer. The dose of C. asiatica extract was chosen after conducting a preliminary study of different doses (results not included). All treatment regimens started 8 days after injection with STZ and continued daily for 14 days.
Collection of blood and liver samples
After the treatment period, all the rats were fasted overnight and euthanized through overdose of gas inhalant with Isofor (Safeline Pharmaceuticals, Johannesburg, South Africa) in the anaesthetic chamber until effect followed by immediate cardiac puncture for final blood collection into uncoated tubes. The blood samples from each animal were allowed to settle for about 1 h then centrifuged at 2000g for 10 min to separate the serum. Whole liver from each rat was excised, washed in physiological saline, blot-dried, weighed and snap-frozen in liquid nitrogen. Both serum and liver samples were subsequently stored in −20 °C freezer until needed.
Determination of serum lipids
Serum lipids such as TG, TC and HDL-c were analysed by an Automated Chemistry Analyzer (Labmax Plenno, Labtest Co. Ltd., Lagoa Santa, Brazil) using commercial assay kits obtained from the same company. LDL-c was calculated from TC, HDL-c and TG levels using the Friedewald’s formula (Friedewald et al. Citation1972).
Determination of protein concentration
Protein concentration in tissues was measured using the Biuret method as described by Gornall et al. (Citation1949).
Analysis of lipid peroxidation
The concentration of malondialdehyde (MDA), a product of lipid peroxidation was measured as an indicator of oxidative stress in the liver according to the method described by Varshney and Kale (Citation1990). The liver samples were homogenized in 0.05 M Tris–HCl buffer (pH 7.4) containing 1.15% KCl, and centrifuged at 10,000g for 15 min at 4 °C to obtain the supernatants. Briefly, 200 μL of the supernatant was mixed with 1.8 mL of Tris–HCl buffer before 500 μL of trichloroacetic acid (30%) was added. Then, 500 μL of thiobarbituric acid (0.75%) was added and the reaction mixture was heated in a water bath for 45 min at 80 °C. After cooling in ice, the mixture was centrifuged at 4000g for 5 min. Absorbance of the resulting supernatant was read at 532 nm in an UVmini-1240 Shimadzu spectrophotometer (Kyoto, Japan) against reference blank containing deionized water. Lipid peroxidation in μmol MDA formed/mg protein was calculated using a molar extinction coefficient of 1.56 × 10⁵ M−1 cm−1.
Analysis of hepatic antioxidant status
Ferric reducing antioxidant power (FRAP) and Trolox equivalent antioxidant capacity (TEAC) were determined in the liver by the methods of Benzie and Strain (Citation1996) and Miller et al. (Citation1993), respectively, with slight modifications using a Multiskan Spectrum plate reader (ThermoFischer Scientific, Waltham, MA). The oxygen radical absorbance capacity (ORAC) of liver sample was quantified using the method of Ou et al. (Citation2001) in a Fluoroskan Ascent, fluorescence spectrophotometer (ThermoFischer Scientific) and taking readings until zero fluorescence occurs. Reduced glutathione (GSH) was measured spectrophotometrically at 412 nm according to the method described by Jollow et al. (Citation1974). Glutathione S-transferase (GST) and glutathione peroxidase (GPX) activities were determined by the method of Habig et al. (Citation1974) and Rotruck et al. (Citation1973), respectively.
Analysis of inflammatory cytokines
Hepatic concentrations of IL-1β, IL-4, IL-6, IL-10, MCP-1 and TNF-α were analysed using a Bio-plex Pro-magnetic bead-based Luminex kit (Bio-Rad Laboratories, Hercules, CA) on the Bio-Plex platform. Liver samples (10 mg/mL) were homogenized in 10 mM phosphate buffered saline (PBS, pH 7.2) and centrifuged twice at 15,000g for 15 min at 4 °C. Briefly, each undiluted supernatant was reacted with a mixture of internally dyed magnetic beads bound with specific anticytokine primary antibodies. Each specific cytokine binds to the bead with its corresponding antibody forming a complex that in turn binds to biotinylated anticytokine secondary antibody. The addition of fluorescent phycoerythrin-conjugated streptavidin allows visualization and subsequent bead acquisition and analysis by Bio-Plex Manager software version 6.1.
Statistical analysis
All data obtained are expressed as mean ± standard deviation (SD). Data were statistically analysed with InStat version 5 (Graph-Pad Software, San Diego, CA). One-way analysis of variance was used to test for significant differences between experimental groups followed by Tukey’s multiple comparison or unpaired Student’s t-test to compare differences between two groups. Differences were considered significant at p < 0.05.
Results
Effects of CA on body and organ weights in type 2 diabetic rats
The results in show the changes in body and liver weight of normal animals and diabetic animals treated with CA and metformin. The body weight gain (%) in diabetic control animals was significantly reduced to 69% of the value for normal control animals, however, treatment with CA and metformin raised this to 93% and 91% of that in the NC group, respectively. Liver weight and liver weight/body weight ratio were significantly reduced (p < 0.05) in diabetic rats compared to normal rats and treatment with CA or metformin did not significantly change this reduction in liver weight.
Table 1. Effects of CA on body and organ weights in type 2 diabetic rats.
Effects of CA on hepatic MDA, FRAP, ORAC and TEAC values in type 2 diabetic rats
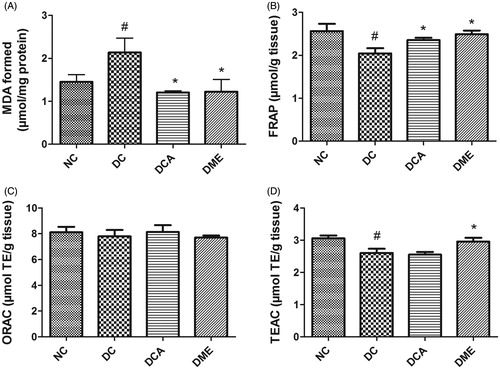
The results on assessment of MDA, FRAP, ORAC and TEAC values in the liver of type 2 diabetic rats are shown in . The formation of MDA as a result of lipid peroxidation in rat liver was significantly (p < 0.05) increased by 47% following induction of diabetes. Administration of CA and metformin significantly (p < 0.05) decreased hepatic MDA level when compared to diabetic controls. The MDA values in DCA and DME groups were 44% and 43% lower than that in DC group. The hepatic values of FRAP and TEAC significantly (p < 0.05) decreased following diabetes induction compared to the normal control rats while ORAC concentration remained unchanged between groups. Treatment of diabetic rats with CA extract and metformin significantly (p < 0.05) increased FRAP level by 15% and 24%, respectively, when compared to diabetic control rats. The TEAC level only increased (p < 0.05) in metformin treated-rats while that in rats treated with CA extract remained unchanged when compared to diabetic control rats.
Figure 1. (A–D) Effects of CA on hepatic MDA, FRAP, ORAC and TEAC values in type 2 diabetic rats. NC: normal control; DC: diabetic control; DCA: diabetic rats treated with C. asiatica (L.) Urb. extracts; DME: diabetic rats treated with metformin; MDA: malondialdehyde; TE: Trolox equivalents; FRAP: ferric reducing antioxidant power; ORAC: oxygen radical absorbance capacity; TEAC: Trolox equivalent antioxidant capacity. Data are presented as mean ± standard deviation; n = 6. Symbols # and *on bars indicate value differs significantly (p < 0.05) from NC group and DC group, respectively, using Tukey’s multiple comparison or unpaired Student’s t test.
Effects of CA on GSH level, GST and GPX activities in liver in type 2 diabetic rats
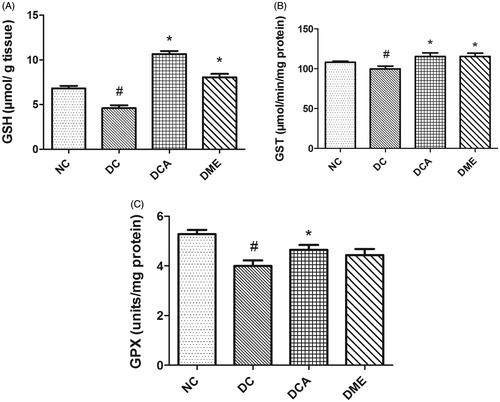
The present study revealed significant (p < 0.05) reductions in hepatic GSH levels, GST and GPX activities in DC rats when compared to NC (). The administration of CA and metformin increased the level of GSH (131% and 75%, respectively); and activities of GST and GPX in diabetic rats, these increases being significant (p < 0.05) for CA and for GSH and GST with respect to metformin. The level of GSH and GST activity in diabetic animals treated with CA was above that in the NC group. Of particular note was the GSH level in the DCA group, which was 56% higher than that in the NC group.
Figure 2. (A–C) Effects of CA on GSH levels, GST and GPX activities in liver in type 2 diabetic rats. NC: normal control; DC: diabetic control; DCA: diabetic rats treated with C. asiatica (L.) Urb. extracts; DME: diabetic rats treated with metformin; GSH: reduced glutathione level; GST: glutathione S-transferase activity; GPX: glutathione peroxidase. Symbols # and *on bars indicate value differs significantly (p < 0.05) from NC group and DC group, respectively, using Tukey’s multiple comparison or unpaired Student’s t test.
Effects of CA on pro-inflammatory and anti-inflammatory cytokines in liver in type 2 diabetic rats
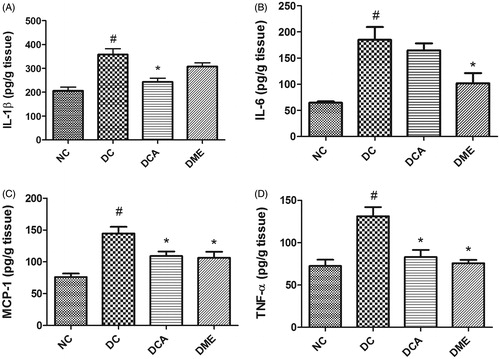
In the present study, diabetes significantly increased (p < 0.05) hepatic levels of pro-inflammatory cytokines IL-1β, IL-6, TNF-α and MCP-1 in rats (). The treatment of diabetic rats with CA extract significantly (p < 0.05) reduced the hepatic concentrations of IL-1β, MCP-1 and TNF-α to 68%, 75% and 63% of the values in diabetic control rats, respectively, while the 11% reduction in IL-6 level was not significant. Metformin treatment of diabetic rats also caused a decrease in all the four pro-inflammatory biomarkers these decreases being significant (p < 0.05) except for IL-1β.
Figure 3. (A–D) Effects of CA on pro-inflammatory biomarkers in liver in type 2 diabetic rats. NC: normal control; DC: diabetic control; DCA: diabetic rats treated with C. asiatica (L.) Urb. extracts; DME: diabetic rats treated with metformin; IL-1β: interleukin-1beta; IL-6: interleukin-6; MCP-1: monocyte chemoattractant protein-1; TNF-α: tumour necrosis factor alpha. Data are presented as mean ± standard deviation; n = 6. Symbols # and *on bars indicate value differs significantly (p < 0.05) from NC group and DC group, respectively, using Tukey’s multiple comparison or unpaired Student’s t test.
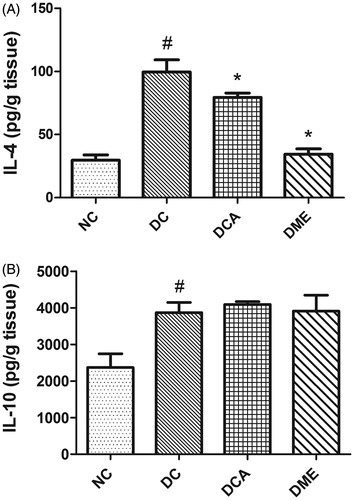
The induction of diabetes in rats significantly increased (p < 0.05) hepatic levels of anti-inflammatory cytokines IL-4 and IL-10 (). However, the treatment of diabetic rats with CA and metformin significantly (p < 0.05) decreased the hepatic concentration of IL-4, while that of IL-10 remained unaffected when compared with diabetic control rats.
Figure 4. (A and B) Effects of CA on anti-inflammatory biomarkers in liver in type 2 diabetic rats. NC: normal control; DC: diabetic control; DCA: diabetic rats treated with C. asiatica (L.) Urb. Extracts; DME: diabetic rats treated with metformin; IL-4: interleukin-4; IL-10: interleukin-10. Data are presented as mean ± standard deviation; n = 6. Symbols # and *indicate value differs significantly (p < 0.05) from NC group and DC group, respectively, using Tukey's multiple comparison or unpaired Student’s t test.
Effects of CA on serum lipids in type 2 diabetic rats
The alterations in levels of serum lipids observed as a result of diabetes and its treatment with CA or metformin are presented in . Diabetes caused a significant (p < 0.05) elevation in the serum levels of TG, TC and HDL-c; however, the increase in serum level of LDL-c was not statistically significant (p > 0.05). Treatment of the diabetic animals with CA significantly (p < 0.05) decreased serum TG concentration when compared to diabetic controls. Metformin administration elicited no significant (p > 0.05) changes in all the lipid parameters analysed when compared with diabetic controls.
Table 2. Effects of CA on serum lipid profile in type 2 diabetic rats.
Discussion
An ideal animal model of T2DM is expected to resemble, as much as possible, the diabetic conditions seen in humans. The administration of fructose and low-dose STZ to rats have been recently demonstrated to induce insulin resistance, while also partially destroying pancreatic β cells leading to insufficient insulin secretion and closely mimicking the symptoms observed in human diabetic patients (Wilson & Islam Citation2012; Mohammed et al. Citation2016). In this study, common symptoms of T2DM such as polyphagia, polydipsia, polyuria and weight loss were observed among diabetic control rats. These symptoms have also been observed in a previous study and were ameliorated by treatment with ethanol extract of CA (Kabir et al. Citation2014). These effects have been attributed to impaired glucose metabolism due to insufficient insulin secretion and insulin resistance in the diabetic state (Soumya & Srilatha Citation2012). The current study also showed that diabetic control rats had significantly reduced body weight gain as well as significant liver weight loss the former being ameliorated by CA treatment, while the latter was not (). Thus, organ weight loss may not be as easily reversed by CA or metformin treatment, as is body weight loss.
Under diabetic conditions, hyperglycemia favours the excess production of reactive oxygen and nitrogen species (RONS) leading to oxidative stress that subsequently overwhelms body’s antioxidant capacity (Oyenihi et al. Citation2015). It has been shown that the rate of formation of MDA, a major end-product of lipid peroxidation, is significantly greater in diabetic rats compared to non-diabetic controls (Hamadi et al. Citation2012). In type 2 diabetic patients, increase in levels of MDA and lipid peroxides in tissues correlates with the severity of the disease (Peerapatdit & Sriratanasathavorn Citation2010). Thus, lipid peroxidation resulting from oxidation chain reactions induced by free radicals is usually a good marker of oxidative stress in tissues of diabetic animals or individuals. Our results () indicate that CA possesses potent antioxidant properties due to its inhibition of the formation of lipid peroxidation end-product, MDA, in the liver of type 2 diabetic rats. The mechanism by which CA exerts this effect still needs investigation, this property most likely limited diabetic damage not only to the liver, but also to the pancreas, another tissue critical in glucose homeostasis.
The ability of tissues to absorb peroxyl radicals, scavenge free radicals and reduce Fe3+ to Fe2+ as determined by ORAC, TEAC and FRAP assays, respectively, can be used to estimate their capacity to withstand the onslaught of excess RONS observed in diabetes (Katalinic et al. Citation2005; Ayepola et al. Citation2014). In addition, the presence and concentration of the reduced form of the thiol-containing cellular antioxidant, glutathione and the actions of glutathione-dependent enzymes such as GST and glutathione peroxidase in tissues have been reported to confer protection against free radical-mediated harmful effects (Farombi et al. Citation2013). GSH may directly scavenge free radicals, or indirectly detoxify reactive species through the activities of GST and GPX (Valko et al. Citation2007). Interestingly, our findings suggest that hepatic antioxidant status in diabetic rats was enhanced by the administration of CA as evidenced by elevations in the concentrations of FRAP and GSH as well as increasing the detoxifying activities of GST and GPX thereby contributing to its protection from diabetic injury. Interestingly, GSH level in the DCA group was 56% higher than that in the NC group (), suggesting that CA is a potent activator of GSH synthesis to the point of overcompensating its depletion that results from diabetes-induced oxidative stress.
Hyperglycemia-induced over-production of RONS in T2DM is a ‘perfect’ condition for inflammatory processes to thrive. Under this environment, macrophages, monocytes and leukocytes are recruited massively into cells leading to the activation of pro-inflammatory mediators that further contribute to the progression of the disease (Vinagre et al. Citation2014). Increased levels of IL-1, IL-6, TNF-α and MCP-1 have been reported in T2DM (Akash et al. Citation2013; Cruz et al. Citation2013). Activities of these mediators lead to destruction of pancreatic β cells by inducing apoptosis as well as initiating insulin resistance by inhibiting proteins of the insulin signalling pathways (Esser et al. Citation2014). Over-expressions of pro-inflammatory cytokines and chemokines have been correlated positively with the development of diabetic liver injury (Ayepola et al. Citation2013). Extracts of different parts of plants and plant-derived compounds have been observed to protect tissues from diabetic damage by neutralizing the effects of pro-inflammatory mediators (Ayepola et al. Citation2013; Guo et al. Citation2014). The present study demonstrated the reduction in levels of IL-1β, MCP-1and TNF-α in diabetic rats following treatment with CA supporting its anti-inflammatory actions that could be of therapeutic relevance in halting the progression of T2DM. Furthermore, IL-4 and IL-10 are recognized as anti-inflammatory cytokines due to their capacity to regulate the release and activities of pro-inflammatory cytokines, although this classification may have been over-simplified as inflammatory responses are more complicated involving several other influencing factors (Cavaillon Citation2001). In our study, the significant increases observed in the levels of hepatic IL-4 and IL-10 following induction of diabetes in rats may have been triggered as a direct response to the increasing concentrations of IL-1β, IL-6, MCP-1 and TNF-α. On the other hand, the administration of CA and metformin only ameliorates the changes in IL-4 levels but not those involving IL-10, suggesting different roles of these cytokines in regulating anti-inflammatory and immunological processes (Galley & Webster Citation1996; Opal & DePalo Citation2000).
An elevation of serum TG and TC levels following the induction of diabetes observed in the present study may be due to the presence of excess blood glucose level, which stimulates hepatic de novo lipogenesis rather than glycogenesis (Jornayvaz et al. Citation2010; Taskinen & Boren Citation2015). Increased serum TG and TC concentrations have been reported to further promote the over-production of LDL-c which may accumulate within the vascular arterial walls forming plaques implicated in the development of atherosclerosis and coronary heart diseases (Gadi & Samaha Citation2007; Mahamuni et al. Citation2012). Treatment of diabetic animals with CA, however, significantly lowered the high serum TG concentration, indicating that it has antihyperlipidemic effects that could be beneficial in the management of T2DM. HDL has been reported to play cardio-protective role by transporting excess cholesterol from peripheral tissues into the liver for subsequent excretion (Van Linthout et al. Citation2010). Therefore, the increase in serum HDL-c level of diabetic control rats in the present study may indicate its accumulation and hence increased release into the serum from the liver. Elevated serum HDL-c levels have also been reported in type 2 diabetic patients (Maduka et al. Citation2007). Furthermore, the oxidation of excess circulating free fatty acids synthesized as a result of increased hyperglycemia-induced hepatic de novo lipogenesis may trigger the formation of advanced lipid end-products (ALE). These ALE cause pancreatic β cell apoptosis and dysfunction via induction of inducible nitric oxide synthase, IL-1 and TNF-α dependent cellular stress pathways (Boada & Martinez-Moreno Citation2013). The ability of CA to inhibit MDA formation and reduce hepatic levels of pro-inflammatory cytokines as observed in this study may also contribute to the amelioration of ALE-mediated pancreatic β cell destruction.
Conclusions
Taken together, the present data suggest that antioxidant, anti-inflammatory and antihyperlipidemic properties of extract from the leaves of C. asiatica may help limit damage to the rat liver caused by T2DM. Overall findings of this study merit further research to isolate and ascertain the molecular mode of actions of medicinal phyto-compounds from the plant so as to maximize their benefits in the management of T2DM.
Acknowledgements
We thank Dr. Linda Bester, Mr David Mompe and Mr Dennis Nxumalo of the Biomedical Resource Unit (BRU), University of KwaZulu-Natal (Westville campus), South Africa for their assistance with animal handling.
Disclosure statement
The authors report no declarations of interest.
Additional information
Funding
References
- Agrawal NK, Kant S. 2014. Targeting inflammation in diabetes: newer therapeutic options. World J Diabetes. 5:697–710.
- Akash MS, Rehman K, Chen S. 2013. Role of inflammatory mechanisms in pathogenesis of type 2 diabetes mellitus. J Cell Biochem. 114:525–531.
- Ayepola OR, Cerf ME, Brooks NL, Oguntibeju OO. 2014. Kolaviron, a biflavonoid complex of Garcinia kola seeds modulates apoptosis by suppressing oxidative stress and inflammation in diabetes-induced nephrotoxic rats. Phytomedicine. 21:1785–1793.
- Ayepola OR, Chegou NN, Brooks NL, Oguntibeju OO. 2013. Kolaviron, a Garcinia biflavonoid complex ameliorates hyperglycemia-mediated hepatic injury in rats via suppression of inflammatory responses. BMC Complement Altern Med. 13:363.
- Benzie IFF, Strain JJ. 1996. The ferric reducing ability of plasma (FRAP) as a measure of “antioxidant power”: the FRAP assay. Anal Biochem. 239:70–76.
- Boada CAC, Martinez-Moreno JM. 2013. Pathophysiology of diabetes mellitus type 2: beyond the duo “insulin resistance-secretion deficit”. Nutr Hosp. 28:78–87.
- Cavaillon JM. 2001. Pro- versus anti-inflammatory cytokines: myth or reality. Cell Mol Biol (Noisy-Le-Grand). 47:695–702.
- Cruz NG, Sousa LP, Sousa MO, Pietrani NT, Fernandes AP, Gomes KB. 2013. The linkage between inflammation and type 2 diabetes mellitus. Diabetes Res Clin Pract. 99:85–92.
- de Vries MA, Alipour A, Klop B, van de Geijn GJ, Janssen HW, Njo TL, van der Meulen N, Rietveld AP, Liem AH, Westerman EM, et al. 2015. Glucose-dependent leukocyte activation in patients with type 2 diabetes mellitus, familial combined hyperlipidemia and healthy controls. Metab Clin Exp. 64:213–217.
- Duran-Salgado MB, Rubio-Guerra AF. 2014. Diabetic nephropathy and inflammation. World J Diabetes. 5:393–398.
- Esser N, Legrand-Poels S, Piette J, Scheen AJ, Paquot N. 2014. Inflammation as a link between obesity, metabolic syndrome and type 2 diabetes. Diabetes Res Clin Pract. 105:141–150.
- Farombi EO, Adedara IA, Oyenihi AB, Ekakitie E, Kehinde S. 2013. Hepatic, testicular and spermatozoa antioxidant status in rats chronically treated with Garcinia kola seed. J Ethnopharmacol. 146:536–542.
- Fonseca VA. 2009. Defining and characterizing the progression of type 2 diabetes. Diabetes Care. 32:S151–S156.
- Friedewald WT, Levy RI, Fredrickson DS. 1972. Estimation of the concentration of low-density lipoprotein cholesterol in plasma, without use of the preparative ultracentrifuge. Clin Diabetes. 18:499–502.
- Gadi R, Samaha FF. 2007. Dyslipidemia in type 2 diabetes mellitus. Curr Diab Rep. 7:228–234.
- Galley H, Webster N. 1996. The immuno-inflammatory cascade. Br J Anaesth. 77:11–16.
- Gohil KJ, Patel JA, Gajjar AK. 2010. Pharmacological review on Centella asiatica: a potential herbal cure-all. Indian J Pharm Sci 72:546–556.
- Gornall AG, Bardawill CJ, David MM. 1949. Determination of serum proteins by means of the Biuret reaction. J Biol Chem 177:751–766.
- Guo R, Liu B, Wang K, Zhou S, Li W, Xu Y. 2014. Resveratrol ameliorates diabetic vascular inflammation and macrophage infiltration in db/db mice by inhibiting the NF-κB pathway. Diab Vasc Dis Res. 11:92–102.
- Habig WH, Pabst MJ, Jakoby WB. 1974. Glutathione S-transferases. The first enzymatic step in mercapturic acid formation. J Biol Chem. 249:7130–7139.
- Hamadi N, Mansour A, Hassan MH, Khalifi-Touhami F, Badary O. 2012. Ameliorative effects of resveratrol on liver injury in streptozotocin-induced diabetic rats. J Biochem Mol Toxicol. 26:384–392.
- Jollow DJ, Mitchell JR, Zampagli N, Gillette JR. 1974. Bromobenzene-induced liver necrosis. Protective role of glutathione and evidence for 3,4-bromobenzene oxide as the hepatotoxic metabolite. Pharmacology. 11:151–169.
- Jornayvaz FR, Samuel VT, Shulman GI. 2010. The role of muscle insulin resistance in the pathogenesis of atherogenic dyslipidemia and nonalcoholic fatty liver disease associated with the metabolic syndrome. Annu Rev Nutr. 30:273–290.
- Kabir AUI, Bin Samad M, D'Costa NM, Akhter F, Ahmed A, Hannan JMA. 2014. Anti-hyperglycemic activity of Centella asiatica is partly mediated by carbohydrase inhibition and glucose-fiber binding. BMC Complement Altern Med. 14:34.
- Katalinic V, Modun D, Music I, Boban M. 2005. Gender differences in antioxidant capacity of rat tissues determined by 2,2′-azinobis (3-ethylbenzothiazoline 6-sulfonate; ABTS) and ferric reducing antioxidant power (FRAP) assays. Comp Biochem Physiol C Toxicol Pharmacol. 140:47–52.
- Li YG, Ji DF, Zhong S, Lv ZQ, Lin TB, Chen S, Hu GY. 2011. Hybrid of 1-deoxynojirimycin and polysaccharide from mulberry leaves treat diabetes mellitus by activating PDX-1/insulin-1 signaling pathway and regulating the expression of glucokinase, phosphoenolpyruvate carboxykinase and glucose-6-phosphatase in alloxan-induced diabetic mice. J Ethnopharmacol. 134:961–970.
- Ma Y, Wang Y, Huang Q, Ren Q, Chen S, Zhang A, Zhao L, Zhen Q, Peng Y. 2014. Impaired β cell function in Chinese newly diagnosed type 2 diabetes mellitus with hyperlipidemia. J Diabetes Res. 2014:493039.
- Maduka IC, Onyeanusi JO, Shu EN, Duru C. 2007. Lipid and lipoprotein profiles in Nigerian non-insulin dependent diabetic patients. Biomed Res. 18:49–53.
- Mahamuni SP, Khose RD, Menaa F, Badole SL. 2012. Therapeutic approaches to drug targets in hyperlipidemia. BioMedicine. 2:137–146.
- Miller NJ, Riceevans C, Davies MJ, Gopinathan V, Milner A. 1993. A novel method for measuring antioxidant capacity and its application to monitoring the antioxidant status in premature neonates. Clin Sci. 84:407–412.
- Mohammed A, Koorbanally NA, Islam MS. 2016. Anti-diabetic effect of Xylopia aethiopica (Dunal) A. Rich. (Annonaceae) fruit acetone fraction in a type 2 diabetes model of rats. J Ethnopharmacol. 180:131–139.
- Moller DE. 2001. New drug targets for type 2 diabetes and the metabolic syndrome. Nature. 414:821–827.
- Mutua PM, Gicheru MM, Makanya AN, Kiama SG. 2013. Anti-proliferative activities of Centella asiatica extracts on human respiratory epithelial cells in vitro. Int J Morphol. 31:1322–1327.
- Norrapoke T, Wanapat M, Wanapat S, Foiklang S. 2014. Effect of Centella asiatica powder (Cap) and mangosteen peel powder (Mpp) on rumen fermentation and microbial population in swamp buffaloes. J Anim Plant Sci. 24:435–444.
- Opal SM, DePalo VA. 2000. Anti-inflammatory cytokines. Chest J. 117:1162–1172.
- Ou BX, Hampsch-Woodill M, Prior RL. 2001. Development and validation of an improved oxygen radical absorbance capacity assay using fluorescein as the fluorescent probe. J Agric Food Chem. 49:4619–4626.
- Oyenihi AB, Ayeleso AO, Mukwevho E, Masola B. 2015. Antioxidant strategies in the management of diabetic neuropathy. BioMed Res Int. 2015:515042.
- Peerapatdit T, Sriratanasathavorn C. 2010. Lipid peroxidation and antioxidant enzyme activities in erythrocytes of type 2 diabetic patients. J Med Assoc Thai. 93:682–693.
- Rains JL, Jain SK. 2011. Oxidative stress, insulin signaling, and diabetes. Free Radic Biol Med. 50:567–575.
- Rotruck JT, Pope AL, Ganther HE, Swanson AB, Hafeman DG, Hoekstra WG. 1973. Selenium: biochemical role as a component of glutathione peroxidase. Science. 179:588–590.
- Siddique YH, Naz F, Jyoti S, Fatima A, Khanam S, Rahul Ali F, Mujtaba SF, Faisal M. 2014. Effect of Centella asiatica leaf extract on the dietary supplementation in transgenic Drosophila model of Parkinson's disease. Parkinsons Dis. 2014:262058.
- Soumya D, Srilatha B. 2012. Late stage complications of diabetes and insulin resistance. J Diabetes Metab. 2011:1.
- Taskinen MR, Boren J. 2015. New insights into the pathophysiology of dyslipidemia in type 2 diabetes. Atherosclerosis. 239:483–495.
- Valko M, Leibfritz D, Moncol J, Cronin MT, Mazur M, Telser J. 2007. Free radicals and antioxidants in normal physiological functions and human disease. Int J Biochem Cell Biol. 39:44–84.
- Van Linthout S, Spillmann F, Schultheiss HP, Tschope C. 2010. High-density lipoprotein at the interface of type 2 diabetes mellitus and cardiovascular disorders. Curr Pharm Des. 16:1504–1516.
- Varshney R, Kale RK. 1990. Effects of calmodulin antagonists on radiation-induced lipid peroxidation in microsomes. Int J Radiat Biol. 58:733–743.
- Vinagre I, Sanchez-Quesada JL, Sanchez-Hernandez J, Santos D, Ordonez-Llanos J, De Leiva A, Perez A. 2014. Inflammatory biomarkers in type 2 diabetic patients: effect of glycemic control and impact of LDL subfraction phenotype. Cardiovasc Diabetol. 13:34.
- Wilson RD, Islam MS. 2012. Fructose-fed streptozotocin-injected rat: an alternative model for type 2 diabetes. Pharmacol Rep. 64:129–139.