
Abstract
Context: Galangin, a natural flavonoid, is found in honey and Alpinia officinarum Hance (Zingiberaceae). Galangin has antiviral, antimicrobial, antidiabetic and anticancer properties, without side effects. The effects of galangin on hyperglycaemia and lipid abnormalities are not known.
Objective: To elucidate the effectiveness of galangin on hyperglycaemia-associated complications and lipid changes in rats with streptozotocin (STZ)-induced hyperglycaemia.
Materials and methods: Diabetes was induced in adult Wistar rats by administering 40 mg/kg of STZ. In our previous study, galangin had no toxicity at concentrations up to 320 mg/kg. Therefore three doses of galangin (4, 8 or 16 mg/kg BW) or glibenclamide (600 µg/kg BW) were administered daily to diabetic rats orally for 45 days.
Results: Diabetic rats showed a significant (p < 0.05) increased levels of plasma glucose (281.10 mg/dL) and decreased levels of insulin (6.01 μU/mL). Additionally, diabetic rats showed a significant (p < 0.05) increased levels of plasma lipid profiles such as total cholesterol (149.05 mg/dL), triglycerides (143.28 mg/dL), free fatty acids (139.37 mg/dL), phospholipids (127.53 mg/dL), plasma low-density lipoprotein-cholesterol (98.72 mg/dL), plasma very low-density lipoprotein-cholesterol (28.65 mg/dL), and significant (p < 0.05) decreased in plasma high-density lipoprotein-cholesterol (21.68 mg/dL). When galangin was administered to the hyperglycaemic rats, plasma glucose and insulin levels and lipid profiles reverted to levels similar to those in healthy control rats.
Discussion and conclusions: Administration of galangin reduced hyperlipidaemia related to the risk of diabetic complications and could be beneficial for diabetic hyperlipidaemic patients. Further work detailing its mechanism-of-action for improving hyperglycaemic-associated lipid abnormalities is needed.
Introduction
Diabetes is a disorder involving multiple complications. Its occurrence has been increasing widely both in developed and developing countries, including Saudi Arabia. According to the World Health Organization (WHO), 285 million people were affected worldwide by diabetes in 2010 and 439 million people are projected to be affected by 2030, especially adults (Shaw et al. Citation2010). Uncontrolled hyperglycaemia can cause many diabetic complications, including heart, kidney, eye and nervous system diseases. Studies have revealed that lipids, specifically total cholesterol (TC) and triglycerides (TGs), accumulate in chronic hyperglycaemic patients due to deficiencies in insulin action (Biadgo et al. Citation2017). A profound alteration in TGs and lipids in plasma and lipoprotein profiles in tissues caused by prolonged hyperglycaemia can eventually result in atherosclerosis (Copeland et al. Citation2018). Therefore, both early diagnosis and appropriate treatment are needed to prevent complications in diabetic patients.
Controlling type 2 diabetes is a global problem and a curative drug has yet to be found. Several medicinal plants and their bioactive ingredients have been assessed in clinical trials for their ability to lower blood glucose levels (Aloud et al. Citation2017; Shokoohi et al. Citation2017). The advantages of natural drugs include the absence of toxins and side effects like those often observed for synthetic drugs (Siavash et al. Citation2017). Recent studies have explored many herbs that possess antihyperglycaemic properties in animals (Kharat et al. Citation2017; Suresh et al. Citation2017). In addition, these herbs have potential antioxidant and antihyperlipidaemic properties that can ameliorate diabetes-associated hyperglycaemia (Kharat et al. Citation2017; Suresh et al. Citation2017). Studies have shown flflavonoids have antioxidant and antihyperglycaemic properties in diabetic rats (Al-Numair et al. Citation2015; Aloud et al. Citation2017).
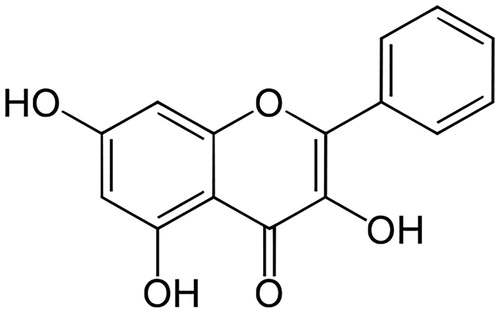
Natural flavonoids, which are polyphenolic compounds, have been studied widely as therapeutics for treating cancer (Su et al. Citation2017), hypertension (Li et al. Citation2017), hepatotoxicity (Wu et al. Citation2017) and diabetes mellitus (Al-Numair et al. Citation2015; Aloud et al. Citation2017). A natural flavonoid, galangin (3,5,7-trihydroxy-2-phenylchromen-4-one; 3,5,7-trihydroxyflavone) () is found in honey and Alpinia officinarum Hance (Zingiberaceae) (Lee et al. Citation2017). Galangin has excellent antimicrobial (Cushnie et al. Citation2007), antiperoxidative (Aloud et al. Citation2017), anti-obesity (Kumar and Alagawadi Citation2013), antitumor (Heo et al. Citation2001) and anti-inflammatory properties (Jung et al. Citation2014). Sivakumar and Anuradha (Citation2011) revealed galangin has antioxidative functions in fructose-fed rats. In the present study, an experimental model of diabetes was induced by administering one low dose of STZ to adult male albino Wistar strain rats. Glibenclamide is a standard hypoglycaemic agent that enhances insulin generation from pancreatic β cells. Therefore, glibenclamide was used as a reference drug against which to evaluate the effect of galangin in rats with STZ-induced hyperglycaemia. The effects of galangin on hyperglycaemia and lipid abnormalities have not yet been evaluated. Therefore, we studied the ability of galangin to ameliorate hyperglycaemia-mediated lipid abnormalities in rats with chemically induced hyperglycaemia.
Figure 1. Galangin structure.
Materials and methods
Materials
STZ is a diabetogenic chemical and galangin is a natural compound; both were purchased from Sigma-Aldrich (St. Louis, MO). Galangin purity (CAS Number: 548-83-4) was ≥95% based on high performance liquid chromatography (Sigma-Aldrich, St. Louis, MO). The physicochemical characteristics of galangin are as follows; the empirical formula is C15H10O5, molecular weight is 270.24, melting point is 214–215 °C and dissolving in dimethyl sulphoxide (DMSO). Additional analytical grade chemicals used in these experiments were procured from various commercial suppliers.
Animals
Nine-week-old male albino Wistar rats (weight: 180–200 g) were bought from the Central Animal House at King Saud University and housed in an air-conditioned room maintained at 25 ± 1 °C with a 12 h light/dark cycle. The animals were fed a normal laboratory pellet diet ad libitum. All experiments were conducted in accordance with the Guide for Care and Use of Laboratory Animals, Institute for Laboratory Animal Research, National Institute of Health (NIH Publication No. 80-23; 1996).
Hyperglycaemia induction using STZ
Hyperglycaemia was induced in healthy animals fasted overnight by intraperitoneally injecting STZ (40 mg/kg BW) that had been dissolved in freshly prepared citrate buffer (0.1 M, pH 4.5). Immediately, 20% glucose was loaded into the drinking water for 24 h after STZ injection to prevent mortality. After 96 h, hyperglycaemia was confirmed in the animals based on glucose measurements. Animals with a plasma glucose level >220 mg/dL were used in subsequent experiments.
Experimental design for dose fixation
Animals were divided into seven groups, where each group contained six animals. Galangin (4, 8 or 16 mg/kg BW) or glibenclamide (600 µg/kg BW) dissolved in 5% DMSO was administered orally for 45 days. In our previous study, galangin displayed no toxicity for concentrations up to 320 mg/kg (Al-Numair et al. Citation2015). In this study, three different nontoxic doses of 4, 8 and 16 mg/kg were used. A dose determination study for galangin was performed in STZ-treated, i.e., hyperglycaemic rats.
Group 1: Healthy control rats + 5% DMSO (solvent).
Group 2: Healthy rats + 16 mg/kg BW galangin dissolved in 5% DMSO.
Group 3: Control rats with STZ-induced hyperglycaemia +5% DMSO (solvent).
Group 4: Hyperglycaemic + 4 mg/kg BW galangin dissolved in 5% DMSO.
Group 5: Hyperglycaemic + 8 mg/kg BW galangin dissolved in 5% DMSO.
Group 6: Hyperglycaemic + 16 mg/kg BW galangin dissolved in 5% DMSO.
Group 7: Hyperglycaemic + 600 µg/kg BW glibenclamide dissolved in 5% DMSO.
Animals were sacrificed by cervical dislocation after fasting overnight at the end of day 45 post-STZ administration. Blood was collected to measure plasma glucose and insulin levels. An active dose of galangin was used for further biochemical estimations.
Experimental design for further various biochemical studies
Animals were assigned into five groups, where each group contained six animals. Rats were treated with galangin (8 mg/kg BW) or glibenclamide (600 µg/kg BW) daily between 9 and 10 am for 45 days.
Group 1: Healthy control rats + 5% DMSO (solvent).
Group 2: Healthy rats + 8 mg/kg BW galangin dissolved in 5% DMSO.
Group 3: Control rats with STZ-induced hyperglycaemia +5% DMSO (solvent).
Group 4: Hyperglycaemic + 8 mg/kg BW galangin dissolved in 5% DMSO.
Group 5: Hyperglycaemic + 600 µg/kg BW glibenclamide dissolved in 5% DMSO.
Animals were sacrificed by cervical dislocation after fasting overnight at the end of experimental day 45. Plasma and tissues were collected and used in further biochemical examinations.
Biochemical assays
Plasma glucose was analysed using a Trinder reagent kit (Trinder Citation1969). Plasma insulin was measured by insulin radioimmunoassay kit (Bürgi et al. Citation1988) (Linco Research, Inc., St. Charles, MO). Total tissue lipid content was determined using a method described by Folch et al. (Citation1957). TC was evaluated by a method described by Allain et al. (Citation1974). High-density lipoprotein-cholesterol (HDL-C) levels were assayed by the Izzo et al. method (Izzo et al. Citation1981). Low-density lipoprotein-cholesterol (LDL-C) and very low-density lipoprotein-cholesterol (VLDL-C) levels were determined according to the Friedewald et al. method (Friedewald et al. Citation1972). TG concentrations were analysed using the McGowan et al. method (McGowan et al. Citation1983). Free fatty acid (FFA) concentrations were determined using the method described by Falholt et al. (Citation1973). Phospholipids (PLs) concentrations were analysed using the Silversmit and Davis method (Silversmit and Davis Citation1950).
Statistical analysis
Data variance was analysed by ANOVA (SPSS software package 9.05, SPSS, Chicago, IL) with Duncan's multiple range test. Data are presented as mean of six rats per group ± standard error. p < 0.05 was considered statistically significant.
Results
Effect of galangin on hyperglycaemia and hyperinsulinaemia
presents the effects of galangin on plasma glucose and insulin levels in rats with STZ-induced hyperglycaemia. Hyperglycaemic rats displayed an increase in glucose levels and decrease in insulin levels compared to normal healthy rats. However, treatment of hyperglycaemic rats with galangin restored glucose and insulin to near-normal levels. Three different doses of galangin (4, 8 and 16 mg) were used to treat the hyperglycaemic rats. Of these three doses, 8 mg displayed the maximum improvement in glucose and insulin levels. Therefore, the 8 mg dose was used in further biochemical studies.
Table 1. Effect of galangin on plasma glucose and insulin levels in rats with streptozotocin-induced hyperglycaemia.
Effect of galangin on plasma lipid profiles
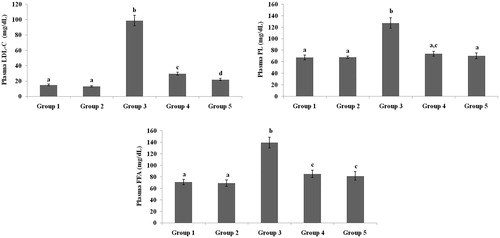
present the plasma TC, TG, HDL-C, VLDL-C, LDL-C, FFA and PL levels of healthy and hyperglycaemic rats. The hyperglycaemic rats had increased plasma levels of TC, TG, LDL-C, VLDL-C, FFA and PL and decreased plasma levels of HDL-C. The above lipid abnormalities were restored to near-healthy levels in galangin- and glibenclamide-treated hyperglycaemic rats.
Figure 2. Effect of galangin on abnormal changes in plasma TC and TG levels in rats with streptozotocin-induced hyperglycaemia. Data are presented as mean of six rats per group ± standard error (S.E.). Groups 1 and 2 are not significantly different from each other (a, a; p < 0.05). Groups 4 and 5 are significantly different from Group 3 (b vs. c, ad, cd, ad; p < 0.05). S.E.: standard error; STZ: streptozotocin. Group 1: healthy control rats; Group 2: healthy control +8 mg galangin; Group 3: diabetic control; Group 4: diabetic +8 mg galangin; Group 5: diabetic +600 µg glibenclamide.
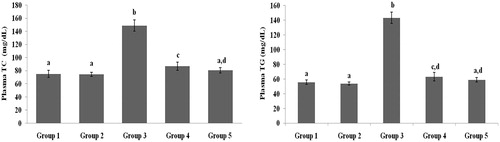
Figure 3. Effect of galangin on abnormal changes in plasma high-density lipoprotein-cholesterol and very-low-density lipoprotein-cholesterol levels in rats with STZ-induced hyperglycaemia. Data are presented as mean of six rats per group ± S.E. Groups 1 and 2 are not significantly different from each other (a, a; p < 0.05). Groups 4 and 5 are significantly different from Group 3 (b vs. a; p < 0.05). Group 1: healthy control rats; Group 2: healthy control +8 mg galangin; Group 3: diabetic control; Group 4: diabetic +8 mg galangin; Group 5: diabetic +600 µg glibenclamide.
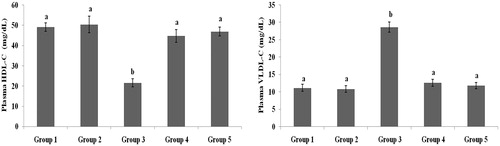
Figure 4. Effect of galangin on abnormal changes in low-density lipoprotein-cholesterol, free fatty acid and phospholipid levels in rats with STZ-induced hyperglycaemia. Data are presented as mean of six rats per group ± S.E. Groups 1 and 2 are not significantly different from each other (a, a; p < 0.05). Groups 4 and 5 are significant different compared to Group 3 (b vs. c, d, ac, a; p < 0.05). Group 1: healthy control rats; Group 2: healthy control +8 mg galangin; Group 3: diabetic control; Group 4: diabetic +8 mg galangin; Group 5: diabetic +600 µg glibenclamide.
Effect of galangin on liver and heart lipid profiles
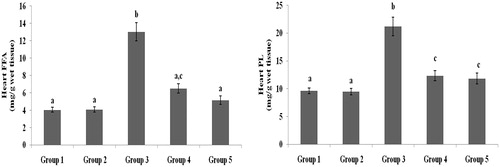
TC, TG, FFA and PL levels in liver and heart tissues of normal healthy and hyperglycaemic rats are shown in and were higher in hyperglycaemic rats than healthy rats. The abnormal lipid levels in tissues of hyperglycaemic rats were restored to levels similar to healthy rats following treatment with galangin and glibenclamide.
Figure 5. Effect of galangin on abnormal changes in liver total cholesterol and triglyceride levels in rats with STZ-induced hyperglycaemia. Data are presented as mean of six rats per group ± S.E. Groups 1 and 2 are not significantly different from each other (a, a; p < 0.05). Groups 4 and 5 are significantly different from Group 3 (b vs. ac, a; p < 0.05). Group 1: healthy control rats; Group 2: healthy control +8 mg galangin; Group 3: diabetic control; Group 4: diabetic +8 mg galangin; Group 5: diabetic +600 µg glibenclamide.
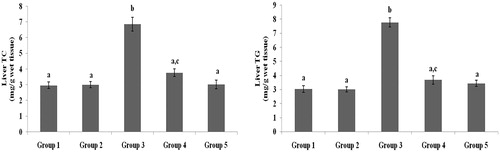
Figure 6. Effect of galangin on abnormal changes in liver free fatty acid and phospholipid levels in rats with STZ-induced hyperglycaemia. Data are presented as mean of six rats per group ± S.E. Groups 1 and 2 are not significantly different from each other (a, a; p < 0.05). Groups 4 and 5 are significantly different from Group 3 (b vs. a, ac; p < 0.05). Group 1: healthy control rats; Group 2: healthy control +8 mg galangin; Group 3: diabetic control; Group 4: diabetic +8 mg galangin; Group 5: diabetic +600 µg glibenclamide.
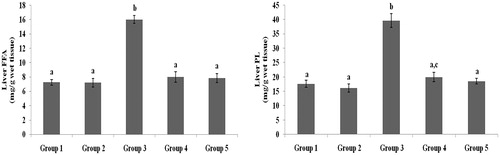
Figure 7. Effect of galangin on abnormal changes of heart total cholesterol and triglyceride levels in rats with STZ-induced hyperglycaemia. Data are presented as mean of six rats per group ± S.E. Groups 1 and 2 are not significantly different from each other (a, a; p < 0.05). Groups 4 and 5 are significantly different from Group 3 (b vs. ac, a, c; p < 0.05). Group 1: healthy control rats; Group 2: healthy control +8 mg galangin; Group 3: diabetic control; Group 4: diabetic +8 mg galangin; Group 5: diabetic +600 µg glibenclamide.
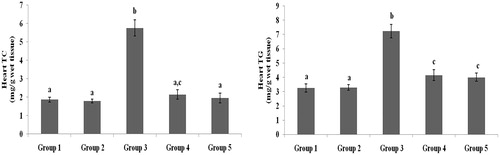
Figure 8. Effect of galangin on abnormal changes in heart free fatty acid and phospholipid levels in rats with STZ-induced hyperglycaemia. Data are presented as mean of six rats per group ± S.E. Groups 1 and 2 are not significantly different from each other (a, a; p < 0.05). Groups 4 and 5 are significantly different from Group 3 (b vs. ac, a, c; p < 0.05). Group 1: healthy control rats; Group 2: healthy control +8 mg galangin; Group 3: diabetic control; Group 4: diabetic +8 mg galangin; Group 5: diabetic +600 µg glibenclamide.
Discussion
STZ impairs insulin activity by selectively damaging pancreatic cells, leading to increased blood glucose levels (Szkudelski Citation2001). A single low dose of streptozotocin (STZ) enters β cells through the glucose transporter GLUT2 and impairs insulin secretion and action through alkylation of pancreatic β-cell DNA (Szkudelski Citation2001). Effective improvement of blood glucose levels through enhanced insulin secretion and/or action minimize diabetes-associated risk factors (Turnin et al. Citation2017). Many natural foods, medicinal plants and plant components have traditionally been used to control diabetes (Al-Numair et al. Citation2015; Aloud et al. Citation2017; Suresh et al. Citation2017; Erfani Majd et al. Citation2018). Studies have reported that synthetic drugs cause several side effects, including diarrhoea and flatulence (Tai and Fantegrossi Citation2016). Therefore, researchers have recently begun the search for better agents derived from plants or natural products (Suresh et al. Citation2017; Erfani Majd et al. Citation2018). As expected, in a rat model of induced hyperglycaemia, the plasma glucose levels were elevated significantly and insulin levels were decreased significantly compared to healthy rats. Administration of galangin and glibenclamide significantly improved plasma glucose and insulin levels to near-normal. Previous studies have reported flavonoids lower blood glucose levels by activating insulin secretion and/or activity (Al-Numair et al. Citation2015; Kashchenko et al. Citation2017). Therefore, the glucose-lowering effect of galangin might be through enhanced insulin secretion and/or action and improved glucose uptake by adipose tissue and muscle.
Chronic hyperglycaemia is a serious metabolic disorder that disturbs carbohydrate and lipid metabolism and is the primary atherosclerotic risk (Wong et al. Citation2016). Chronic hyperglycaemia is associated with significant changes in plasma TC, TG, FFA and PL levels and cellular membrane lipoprotein profiles that eventually lead to heart disease (Qin et al. Citation2017; Copeland et al. Citation2018). A previous study demonstrated dietary and medicinal plant therapies reduce the risk of diabetic complications, especially vascular disease, by influencing plasma lipid profiles (Yamagishi and Matsui Citation2016). As expected, we noticed increased plasma and tissue TC levels in rats with STZ-induced hyperglycaemia. Upon treatment with galangin, TC levels decreased significantly compared to hyperglycaemic control rats. Normally, circulating LDL-C is taken up in the liver through specific receptors and removed from circulation (Lusis Citation2000). The present study found increased plasma LDL-C concentrations in hyperglycaemic rats could be due to the failure of LDL-C receptor function. HDL-C is protected by neutralizing oxidized LDL-C, reversing cholesterol transport and inhibiting oxidation of LDL-C. Due to the reciprocal relationship between VLDL-C and HDL-C, increased VLDL-C concentrations may also be responsible for decreased levels of HDL-C. Our study found lower levels of HDL-C, which could be due to reduced lecithin cholesterol acyl transferase enzyme activity. We also observed an increase in HDL-C levels and decrease in LDL-C and VLDL-C levels in galangin-treated hyperglycaemic rats, confirming the effectiveness of galangin in controlling diabetes-related complications.
An increase in blood TG levels is a common problem in hyperglycaemic patients and plays a role in vascular complications (Naqvi et al. Citation2017). A previous study demonstrated defective lipoprotein lipase (LPL) activity may be responsible for hypertriglyceridemia in diabetics (Trent et al. Citation2014). In the present study, plasma and tissue TG levels increased significantly in diabetic rats, which might be due to defective LPL. Insulin plays an important role inhibiting hormone-sensitive lipase. In addition, glucagon and other hormones stimulate lipolysis. Therefore, higher serum lipid levels in patients with diabetes could be due to the lack of inhibition of lipolytic hormone activity on the depots (Trent et al. Citation2014). Antidiabetic drugs are associated with lowered plasma TG due to returning LPL to normal activity (Liu et al. Citation2018). Treatment with galangin led to decreased TG levels, which may be due to increased insulin secretion as a result of increased LPL activity.
PLs are susceptible substrates for oxygen and hydroxyl free radicals and play important roles in biomembranes, especially maintenance of cellular integrity, microviscosity and survival. In the present study, plasma and tissue PL levels were significantly increased in hyperglycaemic rats, but were significantly decreased to levels similar to those in healthy rats following galangin treatment. FFAs are a crucial source of energy in tissues and act as oxidative fuel for the liver, renal cortex, myocardium and resting skeletal muscle (Shigiyama et al. Citation2017). Elevated FFA levels have been observed in patients with insulin-resistant diabetes (Ma et al. Citation2017). Studies have reported that elevated levels of plasma FFA may be associated with the pathophysiology of diabetes through activation of insulin resistance (Bergman and Ader Citation2000; Shigiyama et al. Citation2017). Patients with diabetes have shown enhanced blood lipid profiles due to increased mobilization of FFAs from fat depots (Amor et al. Citation2016). Moreover, a study demonstrated that higher FFA levels are a cardiovascular risk factor in patients with diabetes. In the present study, the plasma and tissue FFA levels increased significantly in hyperglycaemic rats. Upon treatment with galangin, FFA levels decreased significantly to levels near those in healthy rats, which could be due to increased insulin secretion, as well as inhibition of hormone-sensitive lipase activity.
Flavonoids are considered safe to use in the treatment of diabetes-associated lipid abnormalities, as well as other metabolic diseases. Studies have demonstrated flavonoids have a promising role preventing obesity-related diabetic complications due to their effectiveness increasing insulin secretion, reducing insulin resistance, and inhibiting hormone-sensitive lipase activity (Obafemi et al. Citation2017; Liu et al. Citation2018). The influence of flavonoid-galangin on lipid profiles in STZ-induced rats could be due to enhanced insulin secretion and/or action through enhancing adipose tissue and muscle glucose uptake, as well as inhibiting hormone-sensitive lipase activity.
We conclude that galangin has significant antihyperlipidaemic and antidiabetic properties. However, the mechanisms-of-action underlying the ability of galangin to improve hyperglycaemic-associated lipid abnormalities remain to be studied in the future.
Disclosure statement
No potential conflict of interest was reported by the authors.
Additional information
Funding
Related Research Data
References
- Allain CC, Poon L, Chan GS, Richmond W, Fu P. 1974. Enzymatic determination of total serum cholesterol. Clin Chem. 20:470–475.
- Al-Numair KS, Chandramohan G, Veeramani C, Alsaif MA. 2015. Ameliorative effect of kaempferol, a flavonoid, on oxidative stress in streptozotocin-induced diabetic rats. Redox Rep: Commun Free Radic Res. 20:198–209.
- Aloud AA, Veeramani C, Govindasamy C, Alsaif MA, El Newehy AS, Al-Numair KS. 2017. Galangin, a dietary flavonoid, improves antioxidant status and reduces hyperglycemia-mediated oxidative stress in streptozotocin-induced diabetic rats. Redox Rep. 22:290–300.
- Amor AJ, Catalan M, Pérez A, Herreras Z, Pinyol M, Sala-Vila A, Cofán M, Gilabert R, Ros E, Ortega E. 2016. Nuclear magnetic resonance lipoprotein abnormalities in newly-diagnosed type 2 diabetes and their association with preclinical carotid atherosclerosis. Atherosclerosis. 247:161–169.
- Bergman RN, Ader M. 2000. Free fatty acids and pathogenesis of type 2 diabetes mellitus. Trends Endocrinol Metabol: TEM. 11:351–356.
- Biadgo B, Abebe SM, Baynes HW, Yesuf M, Alemu A, Abebe M. 2017. Correlation between serum lipid profile with anthropometric and clinical variables in patients with type 2 diabetes mellitus. Ethiop J Health Sci. 7:215–226.
- Bürgi W, Briner M, Franken N, Kessler AC. 1988. One-step sandwich enzyme immunoassay for insulin using monoclonal antibodies. Clin Biochem. 21:311–314.
- Copeland LA, Swendsen CS, Sears DM, MacCarthy AA, McNeal CJ. 2018. Association between triglyceride levels and cardiovascular disease in patients with acute pancreatitis. PLoS One. 13:e0179998.
- Cushnie TP, Hamilton VE, Chapman DG, Taylor PW, Lamb AJ. 2007. Aggregation of Staphylococcus aureus following treatment with the antibacterial flavonol galangin. J Appl Microbiol. 103:1562–1567.
- Erfani Majd N, Tabandeh MR, Shahriari A, Soleimani Z. 2018. Okra (Abelmoscus esculentus) improved islets structure, and down-regulated PPARs gene expression in pancreas of high-fat diet and streptozotocin-induced diabetic rats. Cell J. 20:31–40.
- Falholt K, Lund B, Falholt W. 1973. An easy colorimetric micromethod for routine determination of free fatty acids in plasma. Clin Chim Acta Int J Clin Chem. 46:105–111.
- Folch J, lees M, Sloane Stanly GH. 1957. A simple method for isolation and purification of total lipids from animal tissues. J Biol Chem. 26:497–509.
- Friedewald WT, Levy RI, Fredrickson DS. 1972. Estimation of LDL-cholesterol in the plasma, without the use of preparative ultracentrifuge. Clin Chem. 18:449–502.
- Heo MY, Sohn SJ, Au WW. 2001. Anti-genotoxicity of galangin as a cancer chemopreventive agent candidate. Mutat Res. 488:135–150.
- Izzo C, Grillo F, Murador E. 1981. Improved method for determination of high-density-lipoprotein cholesterol I. Isolation of high-density lipoproteins by use of polyethylene glycol 6000. Clin Chem. 27:371–374.
- Jung YC, Kim ME, Yoon JH, Park PR, Youn HY, Lee HW, Lee JS. 2014. Anti-inflammatory effects of galangin on lipopolysaccharide-activated macrophages via ERK and NF-κB pathway regulation. Immunopharmacol Immunotoxicol. 36:426–432.
- Kashchenko N, Chirikova NK, Olennikov DN. 2017. Agrimoniin, an active ellagitannin from Comarum palustre herb with anti-α-glucosidase and antidiabetic potential in streptozotocin-induced diabetic rats. Molecules. 22:73. doi: 10.3390/molecules22010073
- Kharat AR, Kharat K, Jadhav M, Makhija SJ. 2017. Antihyperglycemic, antihyperlipidemic and antioxidative evaluation of compounds from Senna sophera (L.) Roxb in streptozotocin-induced diabetic rats. Nat Prod Res. 8:1–4.
- Kumar S, Alagawadi KR. 2013. Anti-obesity effects of galangin, a pancreatic lipase inhibitor in cafeteria diet fed female rats. Pharm Biol. 51:607–613.
- Lee JJ, Lee JH, Yim NH, Han JH, Ma JY. 2017. Application of galangin, an active component of Alpinia officinarum Hance (Zingiberaceae), for use in drug-eluting stents. Sci Rep. 7:8207.
- Li X, Lin Y, Zhou H, Li Y, Wang A, Wang H, Zhou MS. 2017. Puerarin protects against endothelial dysfunction and end-organ damage in Ang II-induced hypertension. Clin Exp Hypertens. 39:58–64.
- Liu L, Yasen M, Tang D, Ye J, Aisa HA, Xin X. 2018. Polyphenol-enriched extract of Rosa rugosa Thunb regulates lipid metabolism in diabetic rats by activation of AMPK pathway. Biomed Pharmacother. 100:29–35.
- Liu L, Zhou M, Lang H, Zhou Y, Mi M. 2018. Dihydromyricetin enhances glucose uptake by inhibition of MEK/ERK pathway and consequent down-regulation of phosphorylation of PPARγ in 3T3-L1 cells. J Cell Mol Med. 22:1247–1256.
- Lusis JA. 2000. Atherosclerosis. Nature. 407:233–241.
- Ma XL, Meng L, Li LL, Ma LN, Mao XM. 2017. Plasma free fatty acids metabolic profile among Uyghurs and Kazaks with or without type 2 diabetes based on GC-MS. Exp Clin Endocrinol Diabetes. 10:642–689.
- McGowan MW, Artiss JD, Strandbergh DR. 1983. A peroxidase coupled method for the colorimetric determination of serum triglycerides. Clin Chem. 29:538–542.
- Naqvi S, Naveed S, Ali Z, Ahmad SM, Asadullah Khan R, Raj H, Shariff S, Rupareliya C, Zahra F, Khan S. 2017. Correlation between glycated hemoglobin and triglyceride level in type 2 diabetes mellitus. Cureus. 9:e1347.
- Obafemi TO, Akinmoladun AC, Olaleye MT, Agboade SO, Onasanya AA. 2017. Antidiabetic potential of methanolic and flavonoid-rich leaf extracts of Synsepalum dulcificum in type 2 diabetic rats. J Ayurveda Integr Med. 8:238–246.
- Qin Z, Zheng FW, Zeng C, Zhou K, Geng Y, Wang JL, Li YP, Ji QW, Zhou YJ. 2017. Elevated levels of very low-density lipoprotein cholesterol independently associated with in-stent restenosis in diabetic patients after drug-eluting stent implantation. Chin Med J. 130:2326–2332.
- Shaw JE, Sicree RA, Zimmet PZ. 2010. Global estimates of the prevalence of diabetes for 2010 and 2030. Diabetes Res Clin Pract. 87:4–14.
- Shigiyama F, Kumashiro N, Furukawa Y, Funayama T, Takeno K, Wakui N, Ikehara T, Nagai H, Taka H, Fujimura T, et al. 2017. Characteristics of hepatic insulin-sensitive nonalcoholic fatty liver disease. Hepatol Commun. 1:634–647.
- Shokoohi R, Kianbakht S, Faramarzi M, Rahmanian M, Nabati F, Mehrzadi S, Huseini HF. 2017. Effects of an herbal combination on glycemic control and lipid profile in diabetic women: a randomized, double-blind, placebo-controlled clinical trial. J Evid-Based Complement Altern Med. 22:798–804.
- Siavash M, Tabbakhian M, Sabzghabaee AM, Razavi N. 2017. Severity of gastrointestinal side effects of metformin tablet compared to metformin capsule in type 2 diabetes mellitus patients. J Res Pharm Pract. 6:73–76.
- Silversmit DB, Davis AK. 1950. Micro-determination of plasma phospholipids by trichloroacetic acid precipitation. J Lab Clin Med. 35:55–159.
- Sivakumar AS, Anuradha CV. 2011. Effect of galangin supplementation on oxidative damage and inflammatory changes in fructose-fed rat liver. Chem-Biol Interact. 193:141–148.
- Su CH, Kuo CL, Lu KW, Yu FS, Ma YS, Yang JL, Chu YL, Chueh FS, Liu KC, Chung JG. 2017. Fisetin-induced apoptosis of human oral cancer SCC-4 cells through reactive oxygen species production, endoplasmic reticulum stress, caspase-, and mitochondria-dependent signaling pathways. Environ Toxicol. 32:1725–1741.
- Suresh S, Waly MI, Rahman MS, Guizani N, Al-Kindi MAB, Al-Issaei HKA, Al-Maskari SNM, Al-Ruqaishi BRS, Al-Salami A. 2017. Broccoli (Brassica oleracea) reduces oxidative damage to pancreatic tissue and combats hyperglycaemia in diabetic rats. Prevent Nutr Food Sci. 22:277–284.
- Szkudelski T. 2001. The mechanism of alloxan and streptozotocin action in B cells of the rat pancreas. Physiol Res. 50:537–546.
- Tai S, Fantegrossi WE. 2016. Pharmacological and toxicological effects of synthetic cannabinoids and their metabolites. Curr Top Behav Neurosci. 24:1–14.
- Trent CM, Yu S, Hu Y, Skoller N, Huggins LA, Homma S, Goldberg IJ. 2014. Lipoprotein lipase activity is required for cardiac lipid droplet production. J Lipid Res. 55:645–658.
- Trinder P. 1969. Determination of glucose in blood using glucose oxidase with an alternative oxygen acceptor. Ann Clin Biochem. 6:24–27.
- Turnin MC, Schirr-Bonnans S, Martini J, Buisson JC, Taoui S, Chauchard MC, Costa N, Lepage B, Molinier L, Hanaire H. 2017. Educ@dom: comparative study of the telemonitoring of patients with type 2 diabetes versus standard monitoring-study protocol for a randomized controlled study. Diabetol Metabol Syndr. 9:52.
- Wong CK, Wong WC, Wan EY, Chan AK, Chan FW, Lam CL. 2016. Macrovascular and microvascular disease in obese patients with type 2 diabetes attending structured diabetes education program: a population-based propensity-matched cohort analysis of Patient Empowerment Programme (PEP). Endocrine. 53:412–422.
- Wu L, Wang C, Li J, Li S, Feng J, Liu T, Xu S, Wang W, Lu X, Chen K, et al. 2017. Hepatoprotective effect of quercetin via TRAF6/JNK pathway in acute hepatitis. Biomed Pharmacother. 96:1137–1146.
- Yamagishi S, Matsui T. 2016. Protective role of sulphoraphane against vascular complications in diabetes. Pharm Biol. 54:2329–2339.