
Abstract
Context
Hypoxia-inducible factor-1α (HIF-1α)-induced genes can improve blood circulation.
Objective
To investigate brain protective effect of recombinant adenovirus-mediated HIF-1α (AdHIF-1α) expression and its mechanism.
Materials and methods
Male SD rats were used to establish focal cerebral ischaemia-reperfusion (CIR) injury models and randomly divided into normal, sham, CIR, Ad and AdHIF-1α groups. Ad or AdHIF-1α (108 pfu/10 µL) were administered into lateral ventricle of rats in Ad and AdHIF-1α groups. Modified neurological severity score (mNSS), brain water content (BWC) and cerebral infarct volumes (CIVs) were analyzed, and HE staining was performed using the brain tissues. Furthermore, the expression of caspase-3 and HSP90 was analyzed using qRT-PCR and Western blotting.
Results
Compared to CIR (mNSS, 8.52 ± 0.52; CIV, 0.22 ± 0.01) and Ad groups (mNSS, 8.83 ± 0.41; CIV, 0.22 ± 0.02), mNSS and CIV were significantly decreased in AdHIF-1α group (mNSS, 6.03 ± 0.61; CIV, 0.11 ± 0.01) at 72 h (p < 0.05). With prolonged reperfusion time (6 h to 72 h), BWC of all rats increased gradually, although the increase was markedly less in AdHIF-1α group (78.15 ± 0.16 to 87.01 ± 0.31) compared to that in CIR (78.77 ± 0.60 to 89.74 ± 0.34) and Ad groups (78.77 ± 0.35 to 89.71 ± 0.27) (p < 0.01). There were significantly greater pathological changes in the neurons in AdHIF-1α group at 72 h following CIR. Furthermore, expression of caspase-3 (p < 0.01) down-regulated and HSP90 up-regulated (p < 0.05) at mRNA and protein levels in AdHIF-1α group.
Discussion and conclusions
HIF‑1α gene therapy is neuroprotective towards the CIR rat model. HIF-1α may be a candidate gene for the treatment of ischaemic brain injury.
Introduction
Cerebrovascular disease (CVD) is a common neurological disease mainly characterized by a disruption in cerebral blood supply due to vascular structural abnormalities caused by embolism and thrombosis. Ischaemic CVD accounts for about 60–80% of CVD, with high incidence, disability and mortality (Nagai and Granger Citation2018; Shah et al. Citation2019). The main treatment strategies involve relieving the symptoms and restoring blood flow (Wu et al. Citation2018). Nevertheless, during recovery (following reperfusion), the ischaemic area may sustain further damage due to the sudden increase in oxygen, which is known as cerebral ischaemia-reperfusion (CIR) injury (Baharoglu et al. Citation2017; Wu et al. Citation2018). Hence, it is imperative to find more effective and safer drugs that can reduce CIR injury.
Hypoxia-inducible factor 1α (HIF-1α) is a key gene that regulates the response to hypoxia in mammalian cells. The HIF-1α target genes play an important role in brain growth and development, angiogenesis, tumour metastasis, erythropoiesis, inflammation, apoptosis and proliferation of cells (Bäcker et al. Citation2017; Kraus et al. Citation2017). In recent years, the role of HIF-1α in CIR injury has attracted a great deal of attention (Luo et al. Citation2017; Xia et al. Citation2017). Fan et al. (Citation2019) demonstrated that during CIR injury-induced lung injury, the antioxidative stress activities are up-regulated and angiogenesis is promoted to repair the endothelial barrier through the nuclear factor erythroid-related factor 2/heme oxygenase-1 (Nrf2/HO-1) and HIF-1α/vascular-endothelial growth factor (HIF-1α/VEGF) signalling pathways. Wang et al. (Citation2019) demonstrated that the apoptosis induced by ischaemia/reperfusion is decreased by inhibiting HIF-1α and increased by over-expressing HIF-1α. Moreover, over-expressing HIF-1α blocks the inhibitory effect of dexmedetomidine on neuronal apoptosis in CIR injury in rats. These studies suggest that HIF-1α is a potential target in the treatment of CIR injury. Heat shock proteins (HSPs) are the molecular chaperones of misfolded proteins resulting from cellular stress (Jacob et al. Citation2017) and are induced by the HIF-1α pathway during hypoxia (Baird et al. Citation2006; Cai et al. Citation2014). Previous studies suggest that the molecular chaperones, especially HSP70 and HSP90, are needed for post-translational processing of the mature conformation of nascent HIF-1α (Chen and Sang Citation2016; Shaib et al. Citation2019). Caspases are cysteine proteases, and caspase-3 is a major cell death effector protease in the adult and neonatal nervous system. In normal brain, caspase-3 is continuously expressed at low levels and present in neurons in the form of inactive precursors (Xia et al. Citation2012). Caspase-3 is considered as the cell death mediator in the mammalian cortex (Le et al. Citation2002).
In this study, a focal CIR injury model, similar to human cerebral ischaemia, was established. Recombinant adenovirus (Ad) carrying HIF-1α gene was injected into the ischaemic lateral ventricles of rats using a stereotaxic device for human intervention. This study assesses the protective effect of HIF-1α on the brain and its relationship with caspase-3 and HSP90 expression by evaluating several indexes. The results of this study will provide a theoretical basis for further studies on the pathogenesis and clinical treatment of ischaemic CVD.
Materials and methods
Experimental groups
Specific pathogen-free (SPF) male Sprague–Dawley rats weighing 200–250 g were obtained from the Laboratory Animal Center of Guizhou Medical University (No. SCSK [QIAN] 2015-001). We established the rat model of focal CIR injury and the rats were then randomly divided into five subgroups: the normal group (Normal), sham-operated group (sham), cerebral ischaemia-reperfusion group (CIR), recombinant empty Ad ischaemia-reperfusion group (Ad) and recombinant AdHIF-1α group (HIF-1α). According to the time of reperfusion, the rats were divided into 6, 24, 48 and 72 h subgroups, with six rats in each subgroup for each detection index. All the animal experiments were approved by the institutional animal experimentation ethics committee (No. 1009026).
Construction of recombinant Ad vector
Ad HIF-1α was generated using the AdEasy-1 adenoviral vector system (Stratagene, La Jolla, CA, USA). Briefly, human HIF-1α gene was first inserted into the plasmid pMD19-T (Takra, Beijing, China). Then, the shuttle plasmid pAd Track-CMV-HIF-1α and Ad backbone plasmid pAdEasy-1 were analyzed using electroporation method. AdHIF-1α vector was constructed using synthetic pAd Track-CMV-HIF-1α and used for homologous recombination with Escherichia coli BJ BI5183. Later, the recombinant Ad plasmid pAdHIF-1α was constructed and the recombinant Ad plasmid pAd was controlled. The digested recombinant adenoviral plasmid was transfected to 293 cells (human embryonic kidney cells) and packaged out recombinant adenoviral AdHIF-1α. The shuttle plasmid contained independently expressed green fluorescent protein (GFP) gene. pAd (Ad) served as a non-carrier vector control as it lacked the target gene. It also independently expressed GFP. The titres of the amplified recombinant Ad AdHIF-1α and Ad were 8.4 × 10⁹ plaque forming units (pfu)/mL and 9.6 × 10⁹ pfu/mL, respectively.
Rat model of focal CIR
The CIR rat model was constructed using the middle cerebral artery occlusion (MCAO) method based on the modified Longa method (Longa et al. Citation1989; Sasaki et al. Citation2009). First, the rats were anesthetized by intraperitoneal injection of 10% chloral hydrate (350 mg/kg) and fixed on the plate on the supine side followed by depilation the neck region and iodine disinfection. An incision was made in the neck to expose the common, external, and internal carotid arteries on the right side. After ligation of the branch of the external carotid artery, the proximal end of the internal and the common carotid arteries were temporarily clamped using arterial clips. Then, a diagonal incision was made at the distal end of the common carotid artery, and a 3 mm monofilament nylon line was inserted into the internal carotid artery. After restoring the blood supply to the common carotid artery, the skin was sutured. After 2 h of ischaemia, the thread embolus was carefully pulled out and the reperfusion injury model was established. The sham-operated rats underwent the same operation, except that the nylon monofilaments were not inserted. When the vital signs such as breathing and heartbeat of rats were stable, the neurological deficit signs were scored at the time points of each experimental subgroup to judge the success of MCAO model. A total of 438 male Sprague–Dawley rats were used in this study. The mortality rate was exceedingly high in the initial stages of the model establishment because the experimenters were unskilled in the MCAO technique. A total of 390 animals were finally included for observation and qualified for sampling, and the overall mortality rate was 10.96%.
Lateral cerebral ventricle injection
At the appropriate time points of each subgroup, the rats were anesthetized with equithesin (3 mL/kg) and transferred to stereotactic device after MCAO-induced transient ischaemia. According to a new locating method adopted from Xinming Bao (Yan et al. Citation2015), a 2–5 mm incision was made on the scalp 1.5 mm from the thorax. A 1 mm hole was drilled along the lateral to the bregma with a dental drill, and then Ad or Ad HIF-1α (108 pfu/10 µL) was slowly injected into the lateral ventricle at a depth of 3.5 mm from the surface of the brain over 10 min. The needle was left in place for 10 min before retraction. Three rats each from the Ad and AdHIF-1α groups were sacrificed, and frozen sections of the brain samples were prepared and analyzed under fluorescent microscope at 6 h, 24 h, 48 h, 72 h, 1 week, 2 weeks, 3 weeks and 4 weeks post-reperfusion. The expression of recombinant adenovirus containing GFP in the brain tissue was observed under a fluorescence microscope.
Scoring of neurological functions
Modified neurological severity score (mNSS) of the rats included compound motor test (muscle state, abnormal motion and tail lifting test), sensory test (vision, touch and proprioception), reflex and balance test. Higher neurological severity scores indicate more severe motor deficits (Chen et al. Citation2001; Zhao et al. Citation2013). The neurological function scores ranged between 0–18 points, and were graded as follows: mild damage (1–6), moderate damage (7–12) and severe damage (13–18). The neurological functions were assessed using mNSS at 6, 24, 48 and 72 h, using six rats at each time point.
Measurement of brain water content (BWC)
The BWC of the infarcted cerebral hemisphere was measured using the method of Wang and Tsirka (Citation2005) at 6, 24, 48 and 72 h, for six rats at each time point. Briefly, a clean filter paper was placed in a Petri dish, and a small amount of saline was used to wet the filter paper lightly. Rats were sacrificed quickly and the meninx, cerebellum and brainstems were rapidly removed. The infarcted cerebral hemisphere was weighed on the filter paper as the wet weight. The brain tissue was then dried in an electrothermal thermostat for 24 h (106 °C) to obtain dry weight. The BWC was calculated based on the following formula: BWC % = ([wet weight − dry weight]/wet weight) × 100%.
Measurement of cerebral infarct volumes
Rats were anesthetized with intraperitoneal injection of 10% chloral hydrate (0.35 mL/100 mg). After quick decapitation, the brain tissues were rapidly removed and placed in physiological saline at 2–3 °C, then frozen for 10–20 min at −20 °C. The brain tissues were cut into six coronal sections and immediately placed in 1% 2,3,5-triphenyltetrazolium chloride (TTC) saline followed by incubation at 37 °C for 30 min in the dark. After staining, the sections were fixed with 4% paraformaldehyde solution for 25 h. Image-ProPlus 6.0 image analysis software was used to measure the cerebral infarct volumes (CIVs) (Mu et al. Citation2003) of the rats at 6, 24, 48 and 72 h, with six rats at each time point. The formula for calculating the CIV was as follows: (cerebral infarction volume after CIR − contralateral normal brain tissue volume) × 100%.
Haematoxylin and eosin (HE) staining
Rats were anesthetized with 10% chloral hydrate and then perfused with 4% paraformaldehyde. The brains were fixed in 4% paraformaldehyde for 2 h, and then soaked in distilled water for 4 h, followed by dehydration using a graded ethanol series and then permeabilizing using dimethyl benzene. Finally, paraffin-embedded sections were prepared and sectioned at a thickness of 5 µm. The slices were adhered to the polylysine-treated slides and preserved at 4 °C. After routine dewaxing and cleaning, the tissue sections were stained with haematoxylin for 5 min. Then the sections were differentiated in 1% hydrochloric acid alcohol for 20 s, returned to blue with 1% ammonia for 30 s, and counterstained with eosin for 5 min. Finally, the sections were cleared with xylene and sealed with neutral glue. The morphology of the neurons located in the area of right cerebral hemisphere infarct, including the right cerebral hemisphere parietal cortex, frontal cortex and subcortical structures, especially the caudate nucleus and putamen, were observed using light microscopy at 24 h, and six sets were evaluated for each case.
Assessment of caspase-3 and HSP90 expression by quantitative reverse-transcription PCR
The tissues from the right cerebral hemisphere infarcts were collected at 6, 24, 48 and 72 h, and six repeats were used for each time point. Total RNA was isolated using TRIzol Reagent (Sangon Biotech, Shanghai, China). Quantitative reverse-transcription PCR (qRT-PCR) was performed using the ABI Prism 7500 and Taq-Man PCR Master Mix (Yin et al. Citation2001). Primers for caspase-3, HSP90 and GAPDH were designed using Premier 5.0. The PCR conditions included an initial incubation at 95 °C for 10 min, 95 °C for 15 s, 60 °C for 1 min and 40 cycles at 72 °C for 30 s. Each reaction was performed with three replicates. The relative expression levels were calculated using the 2−△△CT method. All the primers used in the study are listed in .
Table 1. Primer list.
Assessment of caspase-3 and HSP90 expression by Western blotting
The tissues from the right cerebral hemisphere infarcts were collected at 6, 24, 48 and 72 h, and six repeats were used for each time point. Brain tissues were homogenized and the nuclear and cytoplasmic proteins were purified using Nuclear Protein Extraction Kit according to the manufacturer’s instructions (Beyotime Biotechnology, Shanghai, China). A total of 120 mg of brain tissues were treated with 1 mL of RIPA buffer (50 mM Tris/HCl, pH 7.4, 150 mM NaCl, 1% NP-40 and 0.1% SDS) containing 1% PMSF (Solar Bio, Beijing, China), 0.3% protease inhibitor (Sigma) and 0.1% phosphorylated proteinase inhibitor (Sigma). Next, the supernatants were extracted from the lysates after centrifugation at 15,000 rpm at 4 °C for 10 min. The protein concentration in the sample solution was calculated based on the absorbance of unknown sample solution from the calibration curve. The proteins were separated on a 12% gel using sodium dodecyl sulfate-polyacrylamide gel electrophoresis (SDS-PAGE) and transferred onto a polyvinylidene difluoride (PVDF) membrane at 300 mA for 90 min. The membranes were incubated with anti-β-actin, caspase-3 or HSP90 antibodies. The membranes were incubated with rabbit polyclonal anti-caspase-3 or HSP90 antibody (1:70 dilution, Abcam) in TBST for 4–6 h with gentle agitation on a shaker. They were then washed with TBST four times (5 min/wash). A HRP-conjugated goat anti-rabbit IgG (1:500 dilution; CST) secondary antibody was added, and the membranes were incubated for 2 h at 37 °C. After incubation, the membranes were washed four times (4 min/wash). The membranes were treated with the enhanced chemiluminescence (ECL) reagent for 2–4 min and exposed in the dark room. The average optical density (OD) value of each protein band was quantified using Image-Pro-Plus 6.0 software and normalized to that of β-actin. The protein expression intensity at each time point is the ratio of the OD values.
Statistical analysis
All the data were analyzed using SPSS 17.0 statistical software. The data are expressed as mean ± standard deviation (SD) and analyzed using one-way analysis of variance (ANOVA). The threshold of significance was set as p < 0.05.
Results
Expression of recombinant Ad in the rat brain
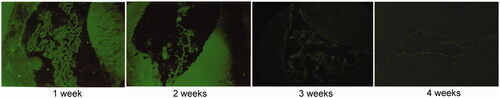
The recombinant Ad used in this study expressed GFP, which could be used to track the cells infected by the virus in vivo. As shown in , GFP was expressed in the lateral ventricular wall, ependymal epithelium and ventricular choroid plexus of rats in Ad and AdHIF-1α groups. The expression trend of GFP was as follows: after 24 h of injection into the lateral ventricle, significant expression of GFP was observed. The fluorescence intensity reached a peak after 2 weeks, and the fluorescence gradually weakened and lasted until week 4.
Figure 1. The expression of green fluorescent protein in the lateral intraventricular region in AdHIF-1α group (×200). The expression of green fluorescent protein was observed in the lateral ventricular wall, ependymal epithelium and choroid plexus.
Neurobehavioral function test and mNSS
Focal neurological dysfunction may occur after CIR injury in rats. The main symptoms included the following: rats could not walk straight and turned to the left when they walked; when tails were raised, their left forelimbs and hind limbs buckled; their head deviated from the vertical axis (>100°) within 30 s; proprioception, visual and tactile dysfunction; loss of auricle response; corneal reflex and panic reflex reduced; and epilepsy, myoclonus, and dystonia appeared. As shown in , the rats in normal and sham groups had 0 points at each time point, indicating that the rats in these two groups exhibited normal neurobehavioral function. With the prolongation of reperfusion, the signs of neurological deficit started to appear at 6 h, peaked at 24 h, and the score decreased with the prolongation of reperfusion time. Compared to the CIR and Ad groups, the AdHIF-1α group had no significant difference in neurological deficit scores at each time point (p > 0.05). At 72 h, the neurobehavioral function was significantly improved and the score was significantly reduced (p < 0.05).
Table 2. Comparison with neurological severity scores in experimental rats.
BWC after ischaemia-reperfusion injury in rats
The BWC of the rats is shown in . With the prolongation of the reperfusion time, the BWC of the rats in CIR, Ad and AdHIF-1α groups began to increase at 6 h. The BWC increased quickly and peaked between 24 and 48 h, and then remained unchanged for the remaining duration. Compared to that of the sham group, the BWC of CIR, Ad and AdHIF-1α groups increased significantly at all the time points (p < 0.05). When compared to that of the CIR and Ad groups, the BWC of the AdHIF-1α group decreased significantly at 24, 48 and 72 h (p < 0.01).
Table 3. Brain water content (BWC) after ischaemia reperfusion injury in rats.
Changes in CIVs in rats after TTC staining
The results of the TTC staining are shown in . In the CIR model, the infarction area in the brain tissue involved the parietal cortex, frontal cortex and subcortical structure, especially the caudate and putamen nucleus. Normal brain tissues appear red, while the ischaemic areas appear white. There was no infarction in the sham group, but white infarction was observed in the CIR, Ad and AdHIF-1α groups. Compared to that in the CIR and Ad groups, the CIV in the AdHIF-1α group decreased significantly (p < 0.01) ().
Figure 2. TTC staining of rat brain tissues after 72 h of cerebral ischaemia-reperfusion. Normal brain tissue is stained red and the ischaemic area is stained white.
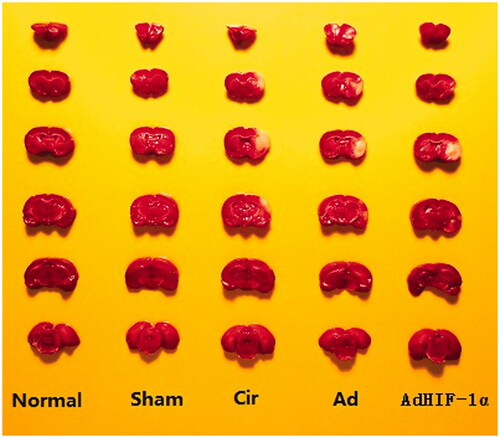
Table 4. Effect of AdHIF-1α on cerebral infract volume after CIR 72 h in rats.
Histological changes by HE staining
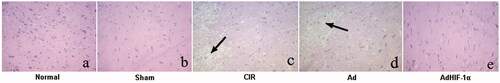
As shown in , the neurons in the cerebral cortex of normal and sham groups showed basophilic blue staining in the nucleus and eosinophilic red in the cytoplasm. The nerve cells were arranged neatly, with complete structure and uniform colour. However, the nerve cells in the CIR and Ad groups were irregular in arrangement, with nuclear concentration, hyperchromatism, vacuolar degeneration and necrosis of nerve cells (). In the AdHIF-1α group, the damage to the nerve cells was not serious, the shrinkage of ischaemic penumbra neurons was slight, and the morphology of peripheral cortical neurons was normal (). The pathological changes of neurons in the Ad group were similar to those in the CIR group.
Figure 3. HE staining of rat brain tissues of different groups (×200). a: Normal, b: Sham, c: CIR, d: Ad, e: AdHIF-1α. The nerve cell nucleus is blue and the cytoplasm is red.
Assessment of caspase-3 expression by qRT-PCR
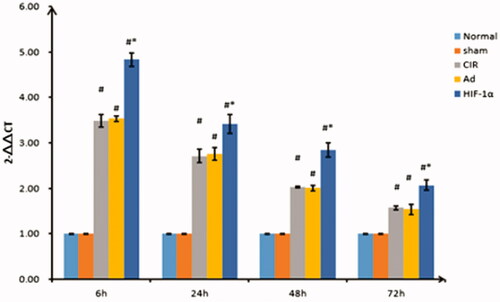
As shown in , caspase-3 was weakly expressed in the normal and sham groups, and there was no significant difference in the expression at the specified time points (p > 0.05). The expression of caspase-3 in the CIR, Ad and AdHIF-1α groups was significantly different than that in the sham group (p < 0.01). The expression started to increase at 6 h, peaked at 24 h, and continued to decrease from 48 to 72 h in each group. The expression of caspase-3 in the AdHIF-1α group at the different time points was significantly different from that in the CIR and Ad groups (p < 0.01).
Figure 4. Relative quantification of caspase-3 expression by qRT-PCR at different reperfusion time points. qRT-PCR was used to detect the expression of caspase-3. Data are presented as mean ± SD. *p < 0.01 vs. CIR and Ad groups, #p < 0.01 vs. normal and sham groups.
Assessment of HSP90 expression by qRT-PCR
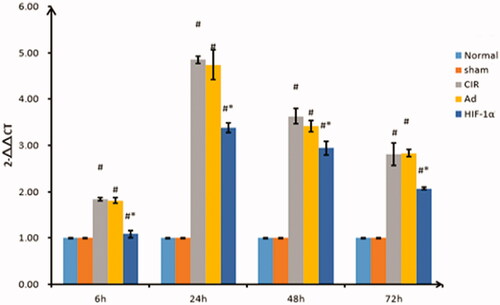
The mRNA expression of Hsp90 is shown in . The expression was lower in normal and sham groups at each time point, and there was no significant difference between them (p > 0.05). The expression of HSP90 in the other groups reached a peak at 6 h and began to decrease at 24–72 h. When compared to the CIR and Ad groups, the level of HSP90 expression in the AdHIF-1α group increased at each time point, with a significant difference (p < 0.01). However, there was no significant difference in HSP90 expression between the CIR and Ad group at the corresponding time points (p > 0.05).
Figure 5. Relative quantification of HSP90 expression by qRT-PCR at different reperfusion time points. qRT-PCR was used to detect the expression of HSP90. Data are presented as mean ± SD. *p < 0.01 vs. CIR and Ad groups, #p < 0.01 vs. normal and sham groups.
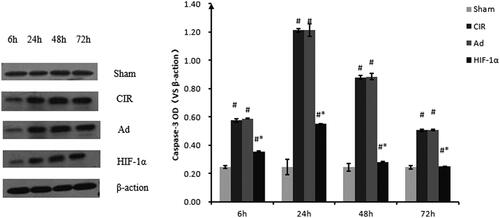
Assessment of caspase-3 protein expression by Western blotting
The protein expression of caspase-3 was in accordance with the mRNA expression (). After 6, 24, 48 and 72 h of reperfusion, the caspase-3 expression in the Ad and CIR groups (both p > 0.05) was significantly higher than that in the sham group. At 6 h of reperfusion, caspase-3 protein expression after MCAO was significantly increased above the baseline level in CIR, Ad and AdHIF-1α groups, peaked at 24 h of reperfusion, reduced at 48 h, continued to decline until the 72 h. Caspase-3 expression in the AdHIF-1α group was significantly lower than that in the Ad and CIR groups for the same duration of reperfusion (p < 0.05). There was no significance between model and Ad groups (p > 0.05).
Figure 6. Relative quantification of caspase-3 protein expression using western blot analysis at different reperfusion time points. Western blot analysis was used to detect the protein expression of caspase-3. Data were obtained by densitometry and normalized using β-actin as a loading control. Data are presented as mean ± SD. *p < 0.01 vs. CIR and Ad groups, #p < 0.01 vs. normal and sham groups.
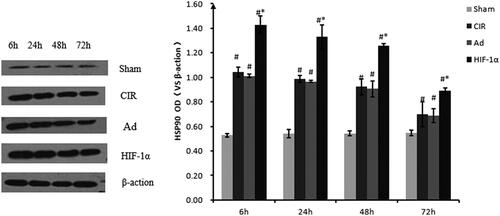
Assessment of HSP90 protein expression by Western blotting
The protein expression of HSP90 was consistent with the mRNA expression (). The induction of HSP90 protein expression changed during the reperfusion period after ischaemia. The intensity of HSP90 staining reached a maximum 6 h post-reperfusion, appeared to decline after 24 h in the cortex, and gradually declined at 48 h until 72 h in the CIR, Ad and HIF groups compared to that in the sham group (all p < 0.05). After 6, 24, 48 and 72 h of reperfusion, the integrated density ratio of HSP90 to β-actin was significantly greater in the AdHIF-1α treatment group (n = 6/group, p < 0.05) for the same period of reperfusion than that in the Ad and CIR groups. There was no significance between the model and Ad groups (p > 0.05).
Figure 7. Relative quantification of HSP90 protein expression using western blot analysis at different reperfusion time points. Western blot analysis was used to detect the protein expression of HSP90. Data were obtained by densitometry and normalized using β-actin as a loading control. Data are presented as mean ± SD. *p < 0.01 vs. CIR and Ad groups, #p < 0.01 vs. normal and sham groups.
Discussion
Owing to in-depth studies using animal models, researchers have gained increasingly better understanding of cerebrovascular diseases. The distribution of blood vessels and anatomical features of a rat brain is similar to that of a human brain (Sanders Citation2016). In this study, rats were used to simulate the disease evolution of human ischaemic stroke by establishing a focal CIR injury model. The neurological deficit score was correlated with infarct size and the mNSS was used as a marker for the success of the model (Charlotte et al. Citation2012). In this study, neurological deficit symptoms appeared at 6 h after focal CIR injury in rats, and the most serious effects were observed at 24 h. After 48 h, neurological deficit symptoms improved, although over a more prolonged period, the neurological deficit symptoms did not improve significantly. This suggests that reperfusion may cause secondary brain damage, which is consistent with previous reports (Santos et al. Citation2010). Relying solely on mNSS may not be accurate, and therefore, some of the milder symptoms and asymptomatic status end up being considered as incomplete blocking, and the cases of severe symptoms could be considered to be subarachnoid haemorrhage. Therefore, we also studied the white area in the brain tissue using TTC staining and the ischaemia perifocal areas using HE staining to confirm the success of the CIR model.
Gene therapy, through gene transfection, is one of the fastest growing disease treatment approaches. Luo et al. indicated that dexmedetomidine could mediate autophagy of cortical neurons to provide neuroprotection by up-regulating HIF-1α (Luo et al. Citation2017). Yan et al. (Citation2016) showed that isoflurane preconditioning plays neuroprotective roles in CIR injury through the up-regulation of HIF-1α through activation of the Akt/mTOR/s6K pathway. These studies suggest that the expression of HIF-1α in ischaemic penumbra increases under hypoxia and ischaemia conditions, which can be used as a therapeutic target for CIR injury (Zong et al. Citation2015). Therefore, we generated a GFP tagged Ad vector to directly observe viral infection, which made it easy to monitor the Ad. Our data showed that the nerve function score and BWC significantly decreased in the AdHIF-1α group. Besides, the results of neuron pathological morphology and infarct volume ratio of the intervention group was smaller than that in the other groups. The results were consistent with the findings of a previous study that demonstrated that AdHIF-1α shows the neuroprotective effect on ischaemia and reperfusion in rat brains (Yang et al. Citation2017). This may be because HIF is transferred to the nucleus to increase its expression during hypoxia, which induces the expression of many downstream target genes, inhibits cell apoptosis, and protects brain tissue (Baranova et al. Citation2007). In addition, the HIF-1α expression was implicated in angiogenesis in ischaemic stroke (Zhang et al. Citation2016). It was reported that vascular endothelial growth factor is activated in a HIF-1α-dependent manner after acute ischaemic stroke (Wu et al. Citation2015).
CIR injury can induce apoptosis of ischaemic penumbra neurons (Cheng et al. Citation2014). The change in gene expression is the most prominent feature of CIR, which affects the expression of many proteins (Rao et al. Citation2002). The pathological process of apoptosis after ischaemia-reperfusion is extremely complex, involving a series of cascade reactions, calcium overload, excitatory amino acid toxicity, free radical production, protease activation, and inflammatory reaction (Jiang et al. Citation2017). The final stage involves the activation of caspase, a cysteine protease. In our study, at the different time points post-reperfusion, the expression of caspase-3 in the AdHIF-1α group was lower than that in the CIR and Ad groups. This was in accordance with the findings of previous studies (Aboutaleb et al. Citation2015; Yaidikar and Thakur Citation2015) that suggested that attenuation of CIR injury is associated with inhibition of the activation of caspase-3 (Yaidikar and Thakur Citation2015).
HSPs can be induced through the HIF-1α pathway during hypoxia (Baird et al. Citation2006; Cai et al. Citation2014). Xia et al. (Citation2017) reported that remote limb ischaemic preconditioning provided protection against cerebral ischaemia through HIF-1α/AMPK/HSP70 signalling. The secreted Hsp90α was found to be a critical downstream effector of HIF-1α (Sahu et al. Citation2012). N-Acetylcysteine could clearly protect the brain from ischaemic injury. Zhang et al. (Citation2014) demonstrated that N-acetylcysteine pre-treatment elevates Hsp90 expression and interaction between Hsp90 with HIF-1α in ischaemic brains, and the increased interaction helps to maintain the stability of HIF-1α. Besides, the neuroprotection of N-acetylcysteine and the HIF-1α expression induced by N-acetylcysteine could be attenuated by inhibiting Hsp90 (Zhang et al. Citation2014). In this study, the expression of HSP90 in the AdHIF-1α group was higher than that in the CIR and Ad groups. This was consistent with the reports that the elevated Hsp90 expression and interaction between Hsp90 with HIF-1α are implicated in the treatment of cerebral ischaemia (Zhang et al. Citation2014).
In general, HIF-1α can reduce the volume of cerebral infarction and relieve the neurological deficit of focal CIR injury. These protective effects may be associated with the increased expression of HSP90 and the decreased expression of caspase-3 surrounding the brain infarction. HIF-1α may serve as a candidate gene for the treatment of ischaemic brain injury. However, our experiment was time-bound, and the long-term efficacy of HIF-1α remains to be elucidated. Therefore, further research is needed to determine whether HIF-1α can be practically applied for the treatment of cerebral ischaemia or other neurological diseases.
Disclosure statement
No potential conflict of interest was reported by the author(s).
Additional information
Funding
References
- Aboutaleb N, Shamsaei N, Khaksari M, Erfani S, Rajabi H, Nikbakht F. 2015. Pre-ischemic exercise reduces apoptosis in hippocampal CA3 cells after cerebral ischemia by modulation of the Bax/Bcl-2 proteins ratio and prevention of caspase-3 activation. J Physiol Sci. 65(5):435–443.
- Bäcker V, Cheung F, Siveke JT, Fandrey J, Winning S. 2017. Knockdown of myeloid cell hypoxia-inducible factor-1α ameliorates the acute pathology in DSS-induced colitis. PLOS One. 12(12):e0190074.
- Baharoglu MI, Brand A, Koopman MM, Vermeulen M, Roos YB. 2017. Acute management of hemostasis in patients with neurological injury. Transfus Med Rev. 31(4):236–244.
- Baird NA, Turnbull DW, Johnson EA. 2006. Induction of the heat shock pathway during hypoxia requires regulation of heat shock factor by hypoxia-inducible factor-1. J Biol Chem. 281(50):38675–38681.
- Baranova O, Miranda LF, Pichiule P, Dragatsis I, Johnson RS, Chavez JC. 2007. Neuron-specific inactivation of the hypoxia inducible factor 1α increases brain injury in a mouse model of transient focal cerebral ischemia. J Neurosci. 27(23):6320–6332.
- Cai X, Huang Y, Zhang X, Wang S, Zou Z, Wang G, Wang Y, Zhang Z. 2014. Cloning, characterization, hypoxia and heat shock response of hypoxia inducible factor-1 (HIF-1) from the small abalone Haliotis diversicolor. Gene. 534(2):256–264.
- Charlotte A, Peter T, Adam D, Mccoll BW, Adam P, Marc M, Emmanuel P, Rothwell NJ, Allan SM. 2012. Neutrophil cerebrovascular transmigration triggers rapid neurotoxicity through release of proteases associated with decondensed DNA. J Immunol. 189(1):381–392.
- Chen J, Sanberg PR, Li Y, Wang L, Lu M, Willing AE, Sanchez-Ramos J, Chopp M. 2001. Intravenous administration of human umbilical cord blood reduces behavioral deficits after stroke in rats. Stroke. 32(11):2682–2688.
- Chen S, Sang N. 2016. Hypoxia-inducible factor-1: a critical player in the survival strategy of stressed cells. J Cell Biochem. 117(2):267–278.
- Cheng ZG, Li L, Mo XY, Zhang L, Xie YQ, Guo QL, Wang YJ. 2014. Non-invasive remote limb ischemic postconditioning protects rats against focal cerebral ischemia by upregulating STAT3 and reducing apoptosis. Int J Mol Med. 34(4):957–966.
- Fan JH, Lv H, Li J, Che YQ, Xu BN, Tao Z, Jiang WJ. 2019. Roles of Nrf2/HO-1 and HIF-1α/VEGF in lung tissue injury and repair following cerebral ischemia/reperfusion injury. J Cell Physiol. 234(6):7695–7707.
- Jacob P, Hirt H, Bendahmane A. 2017. The heat-shock protein/chaperone network and multiple stress resistance. Plant Biotechnol J. 15(4):405–414.
- Jiang WW, Huang BS, Han Y, Deng LH, Wu LX. 2017. Sodium hydrosulfide attenuates cerebral ischemia/reperfusion injury by suppressing overactivated autophagy in rats. Febs Open Bio. 7(11):1686–1695.
- Kraus RJ, Yu X, Cordes B-l. A, Sathiamoorthi S, Iempridee T, Nawandar DM, Ma S, Romero-Masters JC, McChesney KG, Lin Z, et al. 2017. Hypoxia-inducible factor-1α plays roles in Epstein-Barr virus’s natural life cycle and tumorigenesis by inducing lytic infection through direct binding to the immediate-early BZLF1 gene promoter. PLOS Pathog. 13(6):e1006404.
- Le DA, Wu Y, Huang Z, Matsushita K, Plesnila N, Augustinack JC, Hyman BT, Yuan J, Kuida K, Flavell RA, et al. 2002. Caspase activation and neuroprotection in caspase-3-deficient mice after in vivo cerebral ischemia and in vitro oxygen glucose deprivation. Proc Natl Acad Sci USA. 99(23):15188–15193.
- Longa EZ, Weinstein PR, Carlson S, Cummins R. 1989. Reversible middle cerebral artery occlusion without craniectomy in rats. Stroke. 20(1):84–91.
- Luo C, Ouyang M-W, Fang Y-Y, Li S-J, Zhou Q, Fan J, Qin Z-S, Tao T. 2017. Dexmedetomidine protects mouse brain from ischemia-reperfusion injury via inhibiting neuronal autophagy through up-regulating HIF-1α. Front Cell Neurosci. 11:197.
- Mu D, Jiang X, Sheldon RA, Fox CK, Hamrick SE, Vexler ZS, Ferriero DM. 2003. Regulation of hypoxia-inducible factor 1 alpha and induction of vascular endothelial growth factor in a rat neonatal stroke model. Neurobiol Dis. 14(3):524–534.
- Nagai M, Granger DN. 2018. Inflammatory mechanisms in ischemic cerebrovascular disease. Chapter 19. In: Minagar A, editor. Neuroinflammation. 2nd ed. New York: Academic Press. p. 379–411.
- Rao VL, Raghavendra Bowen KK, Dhodda VK, Guoqing S, Franklin JL, Gavva NR, Dempsey RJ. 2002. Gene expression analysis of spontaneously hypertensive rat cerebral cortex following transient focal cerebral ischemia. J Neurochem. 83(5):1072–1086.
- Sahu D, Zhao Z, Tsen F, Cheng C-F, Park R, Situ AJ, Dai J, Eginli A, Shams S, Chen M, et al. 2012. A potentially common peptide target in secreted heat shock protein-90α for hypoxia-inducible factor-1α-positive tumors. MBoC. 23(4):602–613.
- Sanders J. 2016. Data on Arc and Zif268 expression in the brain of the α-2A adrenergic receptor knockout mouse. Data Brief. 7:8–11.
- Santos A, Reis JDC, Paredes BD. 2010. Therapeutic window for treatment of cortical ischemia with bone marrow-derived cells in rats. Brain Res. 1306:149–158.
- Sasaki M, Honmou O, Kocsis JD. 2009. A rat middle cerebral artery occlusion model and intravenous cellular delivery. Methods Mol Biol. 549:187–195.
- Shah R, Wilkins E, Nichols M, Kelly P, El-Sadi F, Wright FL, Townsend N. 2019. Epidemiology report: trends in sex-specific cerebrovascular disease mortality in Europe based on WHO mortality data. Eur Heart J. 40(9):755–764.
- Shaib WL, Nagaraju GP, Farran B, Lesinski GB, El-Rayes BF. 2019. Interaction of heat shock protein 90 with hypoxia inducible factor and signal transducer and activator of transcription in colon cancer. Process Biochem. 86:151–158.
- Wang J, Tsirka SE. 2005. Neuroprotection by inhibition of matrix metalloproteinases in a mouse model of intracerebral haemorrhage. Brain. 128(7):1622–1633.
- Wang Y-Q, Tang Y-F, Yang M-K, Huang X-Z. 2019. Dexmedetomidine alleviates cerebral ischemia-reperfusion injury in rats via inhibition of hypoxia-inducible factor-1α. J Cell Biochem. 120(5):7834–7844.
- Wu C, Chen J, Chen C, Wang W, Wen L, Gao K, Chen X, Xiong S, Zhao H, Li S. 2015. Wnt/β-catenin coupled with HIF-1α/VEGF signaling pathways involved in galangin neurovascular unit protection from. Sci Rep. 5(1):16151.
- Wu M-Y, Yiang G-T, Liao W-T, Tsai AP-Y, Cheng Y-L, Cheng P-W, Li C-Y, Li C-J. 2018. Current mechanistic concepts in ischemia and reperfusion injury. Cell Physiol Biochem. 46(4):1650–1667.
- Xia M, Ding Q, Zhang Z, Feng Q. 2017. Remote limb ischemic preconditioning protects rats against cerebral ischemia via HIF-1α/AMPK/HSP70 pathway. Cell Mol Neurobiol. 37(6):1105–1114.
- Xia Y, Choi HK, Lee K. 2012. Recent advances in hypoxia-inducible factor (HIF)-1 inhibitors. Eur J Med Chem. 49:24–40.
- Yaidikar L, Thakur S. 2015. Punicalagin attenuated cerebral ischemia-reperfusion insult via inhibition of proinflammatory cytokines, up-regulation of Bcl-2, down-regulation of Bax, and caspase-3. Mol Cell Biochem. 402(1-2):141–148.
- Yan W, Chen Z, Chen J, Chen H. 2016. Isoflurane preconditioning protects rat brain from ischemia reperfusion injury via up-regulating the HIF-1α expression through Akt/mTOR/s6K activation. Cell. Mol. Biol (Noisy-le-grand). 62(2):38–44.
- Yan XG, Cheng BH, Wang X, Ding LC, Liu HQ, Chen J, Bai B. 2015. Lateral intracerebroventricular injection of Apelin-13 inhibits apoptosis after cerebral ischemia/reperfusion injury. Neural Regen Res. 10(5):766–771.
- Yang M-L, Tao T, Xu J, Liu Z, Xu D. 2017. Antiapoptotic effect of gene therapy with recombinant adenovirus vector containing hypoxia-inducible factor-1α after cerebral ischemia and reperfusion in rats. Chin Med J. 130:1700–1706.
- Yin J, Shackel N, Zekry A, McGuinness P, Richards C, Putten K, McCaughan G, Eris J, Bishop G. 2001. Real-time reverse transcriptase-polymerase chain reaction (RT-PCR) for measurement of cytokine and growth factor mRNA expression with fluorogenic probes or SYBR Green I. Immunol Cell Biol. 79(3):213–221.
- Zhang Z, Yan J, Shi H. 2016. Role of hypoxia inducible factor 1 in hyperglycemia-exacerbated blood-brain barrier disruption in ischemic stroke. Neurobiol Dis. 95:82–92.
- Zhang Z, Yan J, Taheri S, Liu KJ, Shi H. 2014. Hypoxia-inducible factor 1 contributes to N-acetylcysteine’s protection in stroke. Free Radic Biol Med. 68:8–21.
- Zhao X-C, Zhang L-M, Tong D-Y, An P, Jiang C, Zhao P, Chen W-M, Wang J. 2013. Propofol increases expression of basic fibroblast growth factor after; transient cerebral ischemia in rats. Neurochem Res. 38(3):530–537.
- Zong Y, Jiang L, Zhang M, Zhou F, Qi W, Li S, Yang H, Zou Y, Xia Q, Zhou X, et al. 2015. Limb remote ischemic postconditioning protects cerebral ischemia from injury associated with expression of HIF-1α in rats. BMC Neurosci. 16(1):97.