
 ?Mathematical formulae have been encoded as MathML and are displayed in this HTML version using MathJax in order to improve their display. Uncheck the box to turn MathJax off. This feature requires Javascript. Click on a formula to zoom.
Abstract
Context
Oridonin (ORI) has obvious anticancer effects, but its solubility is poor. Nanocrystal (NC) is a novel nano-drug delivery system for increasing bioavailability for ORI. However, the endocytosis and transcytosis behaviours of oridonin nanocrystals (ORI-NCs) through epithelial membrane are still unclear.
Objectives
ORI-NCs were prepared and characterized. The in vitro cytotoxicity and endocytosis and transcytosis process on Madin-Darby canine kidney (MDCK) monolayer were investigated.
Materials and methods
Anti-solvent precipitation method was adopted in preparation of ORI-NCs. Differential scanning calorimetry (DSC) and X-ray diffraction (XRD) were adopted to explore crystallography of ORI-NCs. Sulforhodamine B (SRB) method was used to test the inhibition effect on proliferation of MDCK cells. Quantitative analysis by HPLC was performed to study the endocytosis and transcytosis of ORI-NCs and ORI bulk drug, and the process was observed by confocal laser spectrum microscopy (CLSM) and flow cytometry.
Results
The particle size of ORI-NCs was about 274 nm. The crystallography form of ORI was not changed after prepared into NCs. The dissolution rate of ORI-NCs was higher than pure ORI in 120 min. At higher concentrations (34, 84 and 135 μg/mL), ORI-NCs significantly reduced the cell viability compared with free ORI (p < 0.05, p < 0.01). ORI-NCs demonstrated higher endocytosis in MDCK cells than free ORI (p < 0.01). In the transport process, ORI-NC was taken up into cells in an intact form, and excreted out from basolateral membrane of polarized epithelial cells in an intact form. The internalization and transmembrane amount increased as a function of time.
Conclusions
ORI-NCs transported through the MDCK monolayers in an intact form.
Introduction
More than 40% of drug candidates in the drug development process exhibit poor solubility, leading to poor and variable bioavailability (Ranjita Citation2013). Thus, finding safe and effective formulations that improve the oral absorption of poorly soluble drugs is a problem that must be solved. In past decades, numerous methods have been developed to improve the solubility of poorly water-soluble drugs (Al-Kassas et al. Citation2017; Göke et al. Citation2018), such as lipid-based carrier systems, the formulation of drug nanoparticles, the generation of polymer-based nanofibre mats, and nanocrystal (NC).
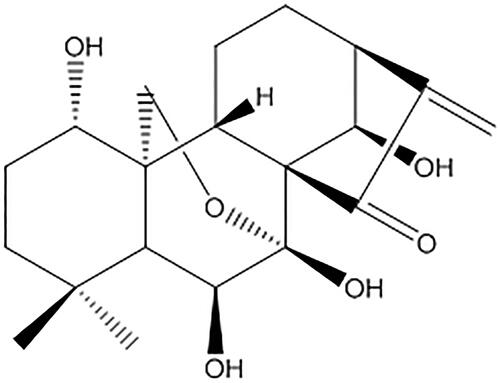
Oridonin (ORI), an ent-kaurene diterpenoid compound, was the active constituent of Rabdosia, the dry aerial part of Rabdosia rubescens (Hemsl.) Hara (Lamiaceae) (). In the last few decades, ORI has attracted attention due to its pharmacological properties, as many reports showed that ORI exerts a broad spectrum of antitumor activities against a number of human cancers and human cancer cell lines (Owona and Schluesener Citation2015). It has also demonstrated a versatile antiproliferative mechanism including regulation of the cell cycle, apoptosis, autophagy (Li et al. Citation2011) and antiangiogenic effects (Tian et al. Citation2017). ORI is a direct inhibitor of nucleolin in cancer cells (Vasaturo et al. Citation2018), and it can enhance the radiosensitivity of cancer cells (Li et al. Citation2018). It has been reported that ORI has antiproliferative and apoptosis-inducing effects on cells from various types of cancer, including oral (Yang et al. Citation2018), osteosarcoma (Lu et al. Citation2018), colon (Wu et al. Citation2016), gastric (Shi et al. Citation2016), prostate (Ming et al. Citation2016), laryngeal (Kang et al. Citation2015), lung (Wang et al. Citation2014), breast (Wang et al. Citation2013), gallbladder (Bao et al. Citation2014), nasopharyngeal carcinoma (Zhang et al. Citation2017), pancreatic (Gui et al. 2017) and neuroblastoma (Zhang et al. Citation2016).
Figure 1. The chemical structure of ORI.
However, oral bioavailability of ORI is fairly limited due to poor water solubility and absorption barrier (Zhang et al. Citation2016). These pharmaceutical problems present a serious challenge in the development process of new drug products. We have used strategies to improve the solubility and bioavailability of ORI by structural modifications and building up drug delivery systems in recent years (Zhang et al. Citation2020). New drug delivery techniques have been investigated to overcome these problems, which involve self-microemulsifying drug delivery systems (Liu et al. Citation2009), nanoparticles (Zheng et al. Citation2012; Li et al. Citation2014; Liu et al. Citation2017; Pi et al. Citation2017), nanostructured lipid carriers (Jia et al. Citation2012; Zhou et al. Citation2015), liposomes (Sun et al. Citation2014; Wang et al. Citation2017), nano-micelles (Zhao et al. Citation2013; Ke et al. Citation2017), nanosuspension (Lou et al. Citation2011; Zhang et al. Citation2016), PEGylated ORI conjugates (Shen et al. Citation2013) and ORI-conjugated multiwalled carbon nanotubes (Wang and Li Citation2016).
NC, developed in 1990s, was a novel nano-drug delivery system for increasing bioavailability of poorly soluble drugs. No carrier was needed. Nanocrystals (NCs) were a highly dispersed sub-colloidal system directly formed from pure drug particles with the assistance of stabilizers in medium. NCs are defined as nanoparticles of pure drug without any matrix material and with an average diameter of 1 µm (typically in the range of 100–500 nm) (Rabinow Citation2004; Shi et al. Citation2015). Mechanically, NCs have been demonstrated to enhance the oral bioavailability of poorly soluble drugs by improving the solubility and dissolution rate and extending the bioadhesion of the drugs to the intestinal wall (Nagarwal et al. Citation2011).
At present, the main three preparation methods of NCs are top-down, bottom-up and combinative technologies (Fan et al. Citation2018). Top-down method, or the dispersed method, includes media milling and high-pressure homogenization, while the bottom-up method (precipitation method) consists of co-precipitation, emulsifying and supercritical fluid crystallization method. With the method of high pressure homogenization, the saturated solubility and dissolution rate of oridonin nanocrystals (ORI-NCs) significantly increased (Gao et al. Citation2007); in vitro and in vivo anticancer tests showed that ORI-NCs had stronger inhibition effect on proliferation of K562 and SMMC-7721 cells and on S-180 and H22 tumour-bearing mice (Lou et al. Citation2009, Citation2011). In addition, their pharmacokinetics and tissue distribution after intravenous injection were also investigated (Gao et al. Citation2008).
In the present study, NC formulation can enhance the intestinal transport and oral bioavailability of berberine (He et al. Citation2015; Xiong et al. Citation2018). However, both the in vitro cellular uptake and the in vivo fate of NCs have not been fully explored due to the limitation of current detection technologies (Lu et al. Citation2016).
Madin-Darby canine kidney (MDCK) cells were selected to mimic intestinal barriers as their mucus film, similar polarity and tight junctions as epithelial monolayers (Miao et al. Citation2016). MDCK can be used to observe the transmembrane pathways and mechanisms of NCs (Deng et al. Citation2017). In this study, to clarify the transmembrane process, we prepared ORI-NCs with fluorescence probe DiO loaded (ORI/DiO-NCs) and investigated the internalization and transcytosis process on MDCK cells. Anti-solvent precipitation method was adopted in preparation of ORI-NCs. Particle size and morphology of ORI-NCs were analysed by dynamic laser scanning (DLS) and transmission electron microscope, respectively. Differential scanning calorimetry (DSC) and X-ray diffraction (XRD) were adopted to explore crystallography of ORI-NCs. To study in vitro cytotoxicity, sulforhodamine B (SRB) method was used to test the inhibition effect of ORI bulk drugs and ORI-NCs on proliferation of MDCK cells. Quantitative analysis by HPLC was performed to study the endocytosis and transcytosis of ORI-NCs and ORI bulk drug, and the process was observed by confocal laser spectrum microscopy (CLSM) and flow cytometry.
Materials and methods
Materials
ORI (98%) was purchased from Langze Biotech. Co. Ltd. (Nanjing, China). Polyvinyl pyrrolidone K30 (PVP K30) and SRB were provided by Sigma-Aldrich (St. Louis, MO). Fluorescein sodium 3,3-dioctadecyl oxacarbocyanine perchlorate (DiO, Mw = 881.72) and 1,1-dioctadecyl-3,3,3′,3′-tetramethylindocarbocyanine perchlorate (DiI, Mw = 933.88) were purchased from J&K Chemical Ltd. (Shanghai, China). Foetal bovine serum was purchased from Gibco (Carlsbad, CA). Cell culture media DMEM (pH 7.4), 0.25% tyrisin/0.02% EDTA, penicillin–streptomycin and RIPA lysis buffer were obtained from Macgene Biotechnology Ltd. (Beijing, China). BCA protein assay kit was provided by ThermoFisher (Waltham, MA).
MDCK cells were purchased from Institute of Basic Medical Science Chinese Academy of Medical Science (Beijing, China). Transwells (12 wells, 3 μm pore size, polycarbonate membranes) were provided by Corning Incorporated Costar (Cambridge, MA).
Preparation of ORI-NCs and ORI/DiO-NCs
ORI-NCs were prepared with anti-solvent method. Briefly, 20 mg of ORI was dissolved into 0.7 mL ethanol (organic phase); 60 mg PVP was dissolved into 12 mL double distilled water (water phase). The organic phase was injected into water phase under probe sonication and then sonicated for 10 min.
In order to prepare ORI/DiO-NCs, DiO and ORI were dissolved in ethanol simultaneously. The following steps were the same as that in preparation of ORI-NCs.
Characterization of ORI-NCs
Particle size, PDI and zeta potential of ORI-NCs were measured by dynamic light scattering (DLS) using the Malvern Zetasizer Nano ZS (Malvern, UK) at 25 °C. The morphology of ORI-NCs was observed by transmission electron microscopy (TEM, JEM 1200EX, JEOL, Tokyo, Japan). Briefly, ORI-NCs suspension was diluted and then placed on PARA film. Carbon-coated copper grid was set on the drop and kept still for 2 min before the drop was removed. Negative staining was performed with uranyl acetate dehydrate and then observed by TEM after desiccated.
XRD analysis
Crystallography characters of four types of powder (ORI, PVP, physical mixture of ORI and PVP, ORI-NCs) were explored using a PANalytical Xpert Pro Diffractometer (PANalytical, Almelo, Netherlands) with a Cu-Kα anode as source of radiation. Standard runs were performed using a 40 kV voltage, a 40 mA current and a scanning rate of 4°/min over a 2θ range of 5–50°.
DSC analysis
DSC was performed on Q100 instrument (TA Instruments, New Castle, DE). Four types of powder (ORI, PVP, physical mixture of ORI and PVP, ORI-NCs) were placed in a nonhermetically sealed aluminium pan and proceeded to thermal analysis. The temperature range was from 20 °C to 260 °C at a heating rate of 10 °C/min with a constant N2 flow of 100 mL/min.
Stability of ORI-NCs and ORI/DiO-NCs
ORI-NCs and ORI/DiO-NCs were kept at 4 °C for 30 days and 48 h, respectively. Then, particle size, PDI and zeta potential of ORI-NCs and ORI/DiO-NCs were measured.
Dissolution
Dissolution behaviour of ORI and ORI-NCs in vitro was determined using a dissolution tester (ZRS-8G, Tianjin, China) with the paddle method and were dispersed into 900 mL PBS (7.4), which was used as the release medium to simulate the in vivo environment; the temperature was set to 37 °C and the speed was 100 rpm. At predetermined time points, 5 mL of medium was withdrawn and immediately replaced by the same volume of fresh medium to keep a constant volume. The samples were filtered with an ORI-saturated 0.22 μm micropore film. The amount of dissolved drug was determined by HPLC. Each sample was analysed in triplicate.
MDCK cells culture
MDCK cells were cultured in 25 cm2 culture bottles with DMEM medium containing 10% of FBS and 1% penicillin–streptomycin at 37 °C in 95% relative humidity and 5% CO2 atmosphere. After cells were approximately 80% confluent, medium was removed and cells were washed with pre-warmed PBS buffer for three times. Then, cells were harvested by 1–2 mL 0.25% tyrisin/0.02% EDTA was added and complete culture medium was added. After dispersed into single-cell suspension, cells were collected by centrifugation, resuspended by fresh complete medium and seeded in new culture bottle according to the rate of 1:3 of the total cells. Then, cells were incubated in the environment mentioned above.
Cytotoxicity of ORI-NCs on MDCK cells (SRB analysis)
MDCK cells were seeded in 96-well plate at a density of 1 × 10⁴ cells per well and allowed to grow and differentiate at 37 °C in 5% CO2 atmosphere. After 24 h, 100 μL ORI-NCs and ORI bulk drugs were added to cells according to the concentrations of 8.5, 17, 34, 84 and 135 μg/mL and incubated for 4 h. After incubation, culture media were removed and 100 μL of trichloroacetate was added to fix cells. The samples were kept still at room temperature for 5 min and then at 4 °C for 1 h. Cells were washed with water for five times and then dried in air. Then, cells were stained by 100 μL 0.4% SRB at room temperature for 20 min. Unfixed SRB was removed by 1% ethylic acid for five times and dried in air. Absorbance was read from the Thermo Multiskan™ FC Microplate Reader (ThermoFisher, Waltham, MA) at the wavelength of 540 nm after the sample was added with 200 μL 10 mmol/L Tris-buffer (pH = 10.5) and shaken to dissolve. The inhibition rate was calculated as follows:
where Acontrol and Atest referred to the absorbance of samples incubated with drug solution and blank DMEM, respectively.
Endocytosis of ORI-NCs on MDCK cells
MDCK cells were seeded in cell culture plate at the density of 1.5 × 10⁶ per well and incubated at 37 °C, 5% CO2 for 24 h. ORI bulk drug was dissolved in DMSO and then diluted with blank DMEM medium (the final DMSO in the solution was less than 0.5%). Then, 84 μg/mL ORI-NCs and ORI bulk drugs were added to cells and then incubated for 30, 60 and 120 min. The medium was removed and cells were washed with cooled PBS three times. Then, 250 μL RIPA lysis buffer was added and incubated at 4 °C for 30 min. Samples were centrifugated at the speed of 15,000 rpm, at 4 °C for 10 min. Supernatant was collected and fivefold volume of ethanol was added to precipitate protein and extract drugs. Content of protein was decided by BCA assay and then 100 μL samples were centrifugated at the speed of 15,000 rpm, at 4 °C for 10 min. Surfactant was collected and analysed by HPLC method.
Establishment of methodology of HPLC analysis
HPLC analysis was performed on an LC-20AT (Shimadzu, Kyoto, Japan). Ultraviolet detection was performed at 239 nm using the following parameters: ZORBAX Eclipse XDB-C18 column (4.6 × 250 mm, 5 μm); injection volume of 50 μL; flow rate of 1.0 mL/min; oven temperature of 30 °C. The mobile phase consisted of 56% acetonitrile and 44% water.
Standard curve: A total of 105.6 μg/mL of ORI was dissolved in methanol and then diluted to 105.6, 52.8, 26.4, 13.2, 6.6 and 3.3 μg/mL drug solution, separately. After incubation with cells, 90 μL RIPA lysis buffer was collected and mixed with 10 μL drug solution. Standard curve was calculated according to peak area (Y) and concentration of ORI (X).
To test accuracy of methodology, 10 μL, 3.3, 26.4 and 105.6 μg/mL drug solution was mixed with 90 μL of RIPA lysis buffer incubated with cells. Then, the samples were disposed as the above steps and analysed by HPLC (n = 6). Precision was tested with three samples mentioned above for twice a day and lasted for three days (n = 6).
Flow cytometry method
MDCK cells were cultured in 24-well plates at the density of 1.5 × 10⁶ per well. After the cells were approximately 80% confluent, the cells were washed three times with PBS buffer. Then, 84 μg/mL ORI/DiO-NCs (concentration of ORI) were added into plates and incubated with cells for 15, 30, 60 and 120 min. After incubation, the medium was removed and cells were again rinsed three times with cooled PBS buffer. The cells were harvested by 200 μL 0.25% trypsin/0.02% EDTA treatment and complete culture medium was added. The cells were then collected by centrifugation at the speed of 1000 rpm for 5 min and rinsed three times with PBS buffer. The intracellular fluorescence intensity of DiO was analysed using flow cytometry at the wavelength of 488 nm (FACscan, Becton Dickinson, San Jose, CA).
MDCK cells were seeded onto glass slides. After the cells were approximately 80% confluent, 2 μg/mL DiI was added and incubated for 35 min. Then, cells were washed for three times and 84 μg/mL ORI/DiO-NCs were added into plates, and incubated with cells for 15, 30, 60 and 120 min. After incubation, the cells were rinsed three times with cooled PBS buffer and fixed by paraformaldehyde for 15–20 min. Cell nuclei were stained for 20 min with 4 μg/mL Hoechst 33342. After addition with antifade Mounting Medium (glycerol:PBS = 1:1 [v:v]), the sample was observed with CLSM (TCS SP8, Leica, Wetzlar, Germany). The wavelengths of DiI, DiO and Hoechst were 543, 488 and 405 nm, respectively.
Transcytosis of ORI-NCs on MDCK monolayers
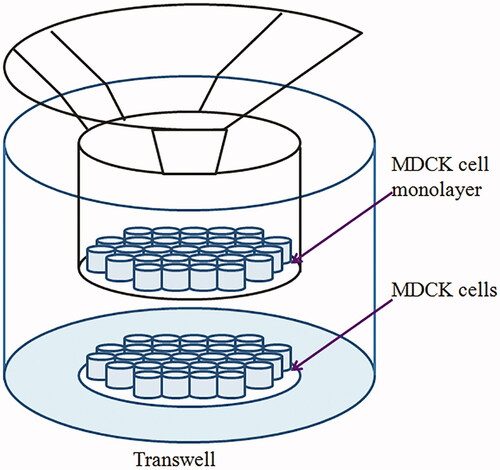
MDCK cells were seeded in transwell filters (12-well plates) at a density of 4 × 10⁵ cells per well and allowed to grow and differentiate at 37 °C in a 5% CO2 in air atmosphere. Volume of complete media in apical and basolateral chamber was 0.5 mL and 1.5 mL, separately. Cell monolayers were used when the transepithelial electrical resistance (TEER) exceeded 250 Ω cm2. MDCK cells were added with drug group and control group, the control group contained the same concentration of DiO as the drug group. CLSM was used to investigate the time dependence of transcytosis process on MDCK monolayers. In brief, MDCK cells were seeded onto glass slides set in basolateral chamber at a density of 1 × 10⁴ cells per well and in transwell filters (12-well plates) at a density of 4 × 10⁵ cells per well. After the TEER value of transwell exceeded 250 Ω cm2 and cells on glass slide were about 80–90% confluent, 2 μg/mL DiI was added to basolateral chamber in the drug group and incubated for 35 min, and the control group was not added with DiI. Then, cells were washed and 84 μg/mL ORI/DiO-NCs was added to the apical chambers (). The control group was only added with DiO. After 150, 210 and 270 min incubation, the medium was removed and the cells in basolateral chamber were washed with cooled PBS for three times. The following steps to observe the samples were the same as described before.
Figure 2. Schematic diagram of the methods used in the transportation experiment.
Statistical analysis
The results are expressed as mean ± standard deviation (SD). All results were analysed by analysis of variance (ANOVA) or t-test with software IBM SPSS Modeler 17.0 (Armonk, NY). A p value less than 0.05 was considered statistically significant, while a p value less than 0.01 was considered to be highly significant.
Results
Characterization of ORI-NCs and ORI/DiO-NCs
The mean particle size, PDI and zeta potential of NCs are shown in . ORI-NCs exhibited the size around 274 nm; the small PDI indicates narrow distribution of particle size. ORI/DiO-NCs demonstrated similar particle size with only a little increase, and their zeta potential was close to neutral.
Table 1. Particle size and zeta potential (means ± SD, n = 3) of ORI-NCs, ORI/DiO-NCs.
Stability of ORI-NCs and ORI/DiO-NCs
In order to explore the stability of ORI-NCs and ORI/DiO-NCs, ORI-NCs and ORI/DiO-NCs were stored in dark place at 4 °C for 48 h and 30 days, separately. Then, their particle size, PDI and zeta potential were measured by DLS. As shows, both of the NCs did not demonstrate significant after storage. Thus, ORI-NCs and ORI/DiO-NCs were stable and could be used in the following experiment.
Table 2. Stability (means ± SD, n = 3) of ORI-NCs, ORI/DiO-NCs.
TEM analysis
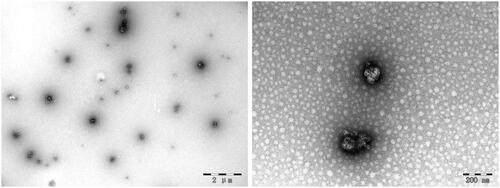
The TEM images of ORI-NCs are shown in . ORI-NCs were like balls in shape with the size around 280 nm, which was consistent with the result of DLS analysis.
Figure 3. TEM images of ORI-NCs.
XRD analysis
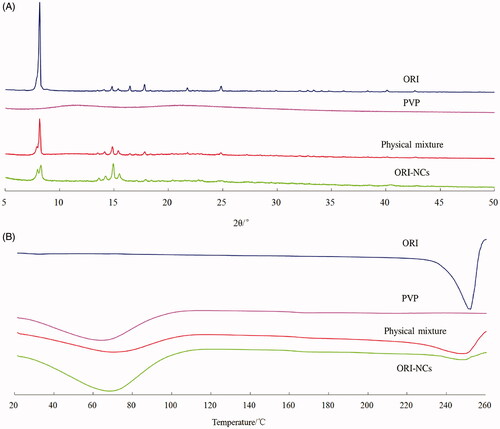
As shows, sharp peaks in the diffraction patterns of ORI bulk drug could be observed, while PVP exhibited no peaks. At the same angle with ORI bulk drug, sharp peaks existed in the diffraction pattern of ORI-NCs and physical mixture of ORI and PVP, illustrating that the crystal form of ORI was not changed in the preparation of NCs.
Figure 4. (A) XRD profiles and (B) DSC pattern of ORI, PVP, physical mixture of ORI and PVP, ORI-NCs.
DSC analysis
As shows, the endothermic peaks of ORI bulk drug and PVP corresponded to the temperatures of 253 °C and 68 °C, respectively. Both peaks could be observed in the curves of mixture of ORI and PVP. Per the curve of ORI-NCs, endothermic peaks existed at the same temperature with that of ORI bulk drug. Thus, the crystallography characteristics of ORI in NCs were the same with that of bulk drugs.
Dissolution
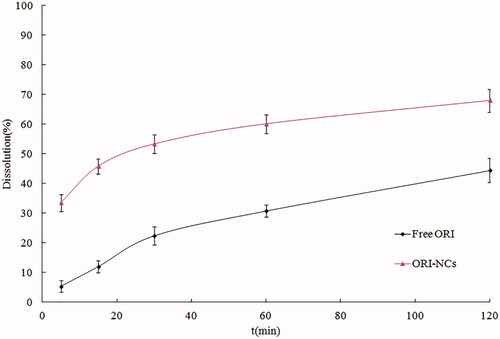
The dissolution profiles of pure ORI, ORI-NCs in water are shown in . It can be seen that the raw material possessed a slow dissolution, and the accumulative dissolution was just 44.3% at 120 min. The dissolution rate of pure ORI was limited to a great extent by its poor water solubility. ORI suspensions exhibited a rapid dissolution in the first 5 min, the accumulative dissolution was 33.5% at 5 min, the accumulative dissolution was 67.9% at 120 min. The dissolutions of pure ORI and ORI-NCs were incomplete. The phenomenon suggested that ORI dissolution was either dominated by the intrinsic solubility or by the dispersity and wettability.
Figure 5. Dissolution profiles of pure ORI, suspensions of ORI-NCs powder.
Cytotoxicity test
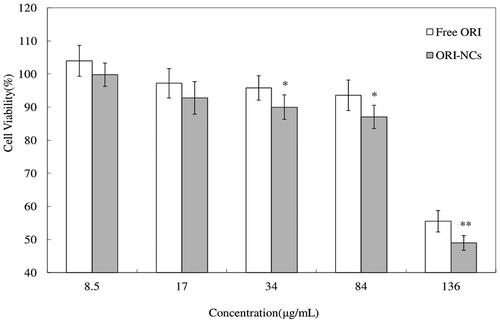
In , both free ORI and ORI-NCs exhibited effect on inhibition the proliferation of MDCK cells. Cell viability was decreased with the increase of concentration, which suggested the concentration-dependent effect of ORI-NCs and ORI bulk drug on MDCK cells. There was no significant difference between free ORI and ORI-NCs on cell viability at concentration of 8.5 and 17 μg/mL. At higher concentration (34, 84 and 135 μg/mL), ORI-NCs significantly reduced the cell viability compared with free ORI (p < 0.05, p < 0.01).
Figure 6. Cytotoxicity of free ORI and ORI-NCs in MDCK cells for 4 h. *p< 0.05 versus free ORI and **p< 0.01 versus free ORI.
Quantitative analysis of internalization of ORI-NCs
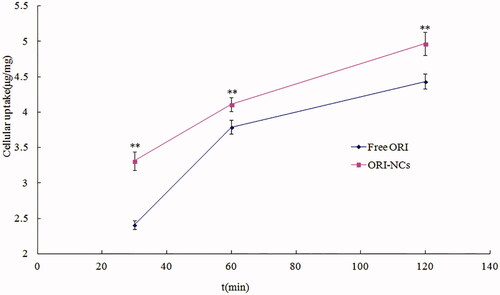
The accuracy of low, medium and high concentration was 97.65 ± 0.52%, 100.56 ± 0.31% and 102.08 ± 0.22%, separately. The intra-day RSD was 0.56%, 0.30% and 0.73% and the inter-day RSD was 2.62%, 1.24% and 0.84%, respectively. The quantitative analysis of endocytosis amount was performed by HPLC. As shows, free ORI and ORI-NCs could be taken up by MDCK cells. The endocytosis amount increased as the time went by, indicating the time dependence. Compared with free ORI, ORI-NCs demonstrated significantly higher endocytosis amount in MDCK cells.
Figure 7. HPLC quantitative analysis of endocytosis of free ORI and ORI-NCs in MDCK cells. **p< 0.01 versus free ORI.
Flow cytometry analysis of endocytosis of ORI-NCs
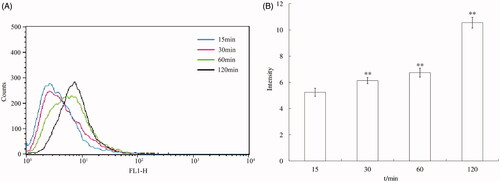
The result of internalization of ORI-NCs at different time points is shown in . At 15, 30, 60 and 120 min, the intracellular fluorescence intensity kept increasing and significant increase was observed compared with the previous time (p < 0.01). Thus, the endocytosis process was time dependent.
Figure 8. (A) The flow cytometry images of the endocytosis of ORI-NCs at 15, 30, 60 and 120 min. (B) The intracellular intensity of the internalized ORI-NCs in MDCK cells. **p< 0.01 versus the previous time.
CLSM analysis of time dependence of endocytosis of ORI-NCs on MDCK cells
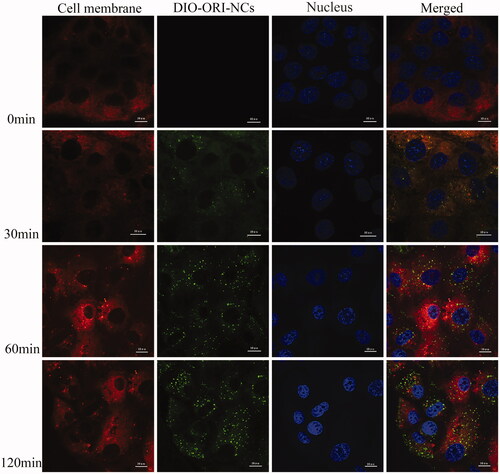
shows the endocytosis kinetics of ORI/DiO-NCs observed by CLSM. ORI/DiO-NCs could be observed in cytoplasm, while no ORI/DiO-NCs were delivered into nucleus. The endocytosis process was time dependent in 120 min. The data coincided with the results of flow cytometry.
Figure 9. Confocal images of MDCK cells incubated with ORI/DiO-NCs for 0, 30, 60 and 120 min.
Confocal analysis of transmembrane behaviour of ORI-NCs
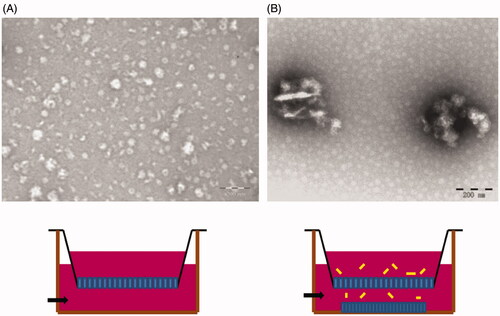
The transcytosis experiment was performed with the materials in . The cells in apical chamber were MDCK polarized monolayer. When ORI-NCs transport through the monolayer, they would be taken up by cells seeded in glass dishes. According to , some green fluorescent spots could be observed in cytoplasm near the membrane, indicating that the ORI-NCs may transport through the monolayer and reach the cells in basolateral dishes. In , DIO distributed evenly in MDCK cells. Compared with the drug group (), there were no obvious green fluorescent spots in the control group (). The results demonstrated that DIO did not enrich in endosome of MDCK as a bright spot. TEM was also applied to observe the transmembrane of ORI-NCs. Images of were taken to represent (A) basolateral chamber of MDCK monolayers, (B) basolateral chamber of MDCK monolayers incubated with ORI-NCs for 270 min. In , no particles with the size around 280 nm were observed, while ORI-NCs could be clearly observed in basolateral chamber of transwell (), suggesting that ORI-NCs were transported in an intact form. According to and , ORI/DiO-NCs could transport through the monolayer and reached the cells in basolateral dishes, and the fluorescence intensity of DiO kept increasing during the process, suggesting the ORI-NCs transported through the monolayer with time-dependent characteristics.
Figure 10. (A) Confocal images of MDCK epithelial cells incubated with ORI-NCs for 150, 210 and 270 min. (B) Confocal images of MDCK epithelial cells incubated with DIO for 150, 210 and 270 min.
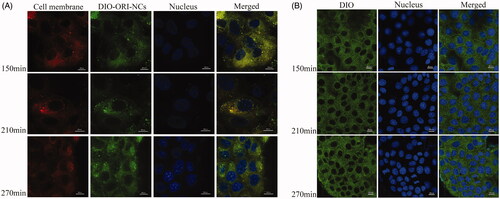
Figure 11. (A) TEM image of medium in basolateral chamber of monolayer without ORI-NCs. (B) TEM image of medium in basolateral chamber of MDCK monolayers incubated with ORI-NCs for 270 min.
Conclusions
Nowadays, top-down (dispersed method) is the major method used to produce NCs. Under mechanic force, large drug particles were dispersed into small ones. Although this method has been widely used in industry, its application in mechanism study was limited since NCs could not load fluorescence probes and were hard to be observed in cells. Bottom-up method sets up a platform for entrapping fluorescence probes into NCs and study their endocytosis or transmembrane behaviours (He et al. Citation2015). In our study, the anti-solvent precipitation method was adopted in preparation of ORI-NCs, DiOs were loaded into ORI-NCs, and the hybrid NCs were used for transmembrane research.
The inhibition rate of proliferation of cells was relevant to the endocytosis and accumulation of drugs in cells. Our research showed the internalization amount of ORI-NCs was higher in MDCK cells compared with free ORI, which could explain the higher cytotoxicity of ORI-NCs. As the HPLC, flow cytometry and CLSM result showed, ORI-NCs could be taken up by MDCK cells and the process was time dependent. The design of MDCK monolayers on the inside and outside of transwell filters helped to observe the endocytosis and transcytosis behaviours of ORI-NCs directly. In conclusion, our study indicated that ORI-NCs transported through the monolayer in an intact form.
Disclosure statement
No potential conflict of interest was reported by the author(s).
Additional information
Funding
References
- Al-Kassas R, Bansal M, Shaw J. 2017. Nanosizing techniques for improving bioavailability of drugs. J Control Release. 260:202–212.
- Bao RF, Shu YJ, Wu XS, Weng H, Ding Q, Cao Y, Li ML, Mu JS, Wu WG, Ding QC, et al. 2014. Oridonin induces apoptosis and cell cycle arrest of gallbladder cancer cells via the mitochondrial pathway. BMC Cancer. 14:217.
- Deng FY, Zhang H, Wang X, Zhang Y, Hu HX, Song SY, Dai WB, He B, Zheng Y, Wang XQ, et al. 2017. Transmembrane pathways and mechanisms of rod-like paclitaxel nanocrystals through MDCK polarized monolayer. ACS Appl Mater Interfaces. 9(7):5803–5816.
- Fan MX, Geng SC, Liu Y, Wang J, Wang YT, Zhong J, Yan ZQ, Yu L. 2018. Nanocrystal technology as a strategy to improve drug bioavailability and antitumor efficacy for the cancer treatment. Curr Pharm Des. 24(21):2416–2424.
- Gao L, Zhang DR, Chen MH, Zheng TT, Wang SM. 2007. Preparation and characterization of an oridonin nanosuspension for solubility and dissolution velocity enhancement. Drug Dev Ind Pharm. 33(12):1332–1339.
- Gao L, Zhang DR, Chen MH, Duan CX, Dai WT, Jia LJ, Zhao WF. 2008. Studies on pharmacokinetics and tissue distribution of oridonin nanosuspensions. Int J Pharm. 355(1–2):321–327.
- Göke K, Lorenz T, Repanas A, Schneider F, Steiner D, Baumann K, Bunjes H, Dietzel A, Finke JH, Glasmacher B, et al. 2018. Novel strategies for the formulation and processing of poorly water-soluble drugs. Eur J Pharm Biopharm. 126:40–56.
- Gui ZF, Luo F, Yang YY, Shen C, Li SQ, Xu J. 2017. Oridonin inhibition and miR-200b-3p/ZEB1 axis in human pancreatic cancer. Int J Oncol. 50(1):111–120.
- He Y, Xia DN, Li QX, Tao JS, Gan Y, Wang C. 2015. Enhancement of cellular uptake, transport and oral absorption of protease inhibitor saquinavir by nanocrystal formulation. Acta Pharmacol Sin. 36(9):1151–1160.
- Jia LJ, Shen JY, Zhang DR, Duan CX, Liu GP, Zheng DD, Tian XN, Liu Y, Zhang Q. 2012. In vitro and in vivo evaluation of oridonin-loaded long circulating nanostructured lipid carriers. Int J Biol Macromol. 50(3):523–529.
- Kang N, Cao SJ, Zhou Y, He H, Tashiro SI, Onodera S, Qiu F, Ikejima T. 2015. Inhibition of caspase-9 by oridonin, a diterpenoid isolated from Rabdosia rubescens, augments apoptosis in human laryngeal cancer cells. Int J Oncol. 47(6):2045–2056.
- Ke ZC, Zhang ZH, Wu H, Jia XB, Wang YJ. 2017. Optimization and evaluation of oridonin-loaded Soluplus®-Pluronic P105 mixed micelles for oral administration. Int J Pharm. 518(1–2):193–202.
- Li CY, Wang EQ, Cheng Y, Bao JK. 2011. Oridonin: an active diterpenoid targeting cell cycle arrest, apoptotic and autophagic pathways for cancer therapeutics. Int J Biochem Cell Biol. 43(5):701–704.
- Li CY, Zhang DR, Guo YY, Guo HJ, Li TT, Hao LL, Zheng DD, Liu GP, Zhang Q. 2014. Galactosylated bovine serum albumin nanoparticles for parenteral delivery of oridonin: tissue distribution and pharmacokinetic studies. J Microencapsul. 31(6):573–578.
- Li SR, Shi D, Zhang LY, Yang F, Cheng GH. 2018. Oridonin enhances the radiosensitivity of lung cancer cells by upregulating Bax and downregulating Bcl-2. Exp Ther Med. 16(6):4859–4864.
- Liu Y, Liu JG, Liang J, Zhang MY, Li Z, Wang Z, Dang BL, Feng NP. 2017. Mucosal transfer of wheat germ agglutinin modified lipid–polymer hybrid nanoparticles for oral delivery of oridonin. Nanomedicine. 13(7):2219–2229.
- Liu Y, Zhang P, Feng NP, Zhang X, Wu S, Zhao JH. 2009. Optimization and in situ intestinal absorption of self-microemulsifying drug delivery system of oridonin. Int J Pharm. 365(1–2):136–142.
- Lou HY, Gao L, Wei XB, Zhang Z, Zheng DD, Zhang DR, Zhang XM, Li Y, Zhang Q. 2011. Oridonin nanosuspension enhances anti-tumor efficacy in SMMC-7721 cells and H22 tumor bearing mice. Colloids Surf B Biointerfaces. 87(2):319–325.
- Lou HY, Zhang XM, Gao L, Feng FF, Wang JY, Wei XB, Yu ZQ, Zhang DR, Zhang Q. 2009. In vitro and in vivo antitumor activity of oridonin nanosuspension. Int J Pharm. 379(1):181–186.
- Lu Y, Li Y, Wu W. 2016. Injected nanocrystals for targeted drug delivery. Acta Pharm Sin B. 6(2):106–113.
- Lu Y, Sun Y, Zhu JW, Yu LS, Jiang XB, Zhang J, Dong XC, Ma B, Zhang Q. 2018. Oridonin exerts anticancer effect on osteosarcoma by activating PPAR-γ and inhibiting Nrf2 pathway. Cell Death Dis. 9(1):15.
- Miao X, Li Y, Wang X, Lee MY, Zheng Y. 2016. Transport mechanism of coumarin 6 nanocrystals with two particle sizes in MDCKII monolayer and larval zebrafish. ACS Appl Mater Interfaces. 8(20):12620–12630.
- Ming M, Sun FY, Zhang WT, Liu JK. 2016. Therapeutic effect of oridonin on mice with prostate cancer. Asian Pac J Trop Med. 9(2):184–187.
- Nagarwal RC, Kumar R, Dhanawat M, Das N, Pandit JK. 2011. Nanocrystal technology in the delivery of poorly soluble drugs: an overview. Curr Drug Deliv. 8(4):398–406.
- Owona BA, Schluesener HJ. 2015. Molecular insight in the multifunctional effects of oridonin. Drugs R D. 15(3):233–244.
- Pi J, Jiang JH, Cai HH, Yang F, Jin H, Yang PH, Cai JY, Chen ZW. 2017. GE11 peptide conjugated selenium nanoparticles for EGFR targeted oridonin delivery to achieve enhanced anticancer efficacy by inhibiting EGFR-mediated PI3K/AKT and Ras/Raf/MEK/ERK pathways. Drug Deliv. 24(1):1549–1564.
- Rabinow BE. 2004. Nanosuspensions in drug delivery. Nat Rev Drug Discov. 3(9):785–796.
- Ranjita S. 2013. Nanosuspensions: a new approach for organ and cellular targeting in infectious diseases. J Pharm Investig. 43(1):1–26.
- Shen JY, Zhang DR, Zhao ZX, Jia LJ, Zheng DD, Liu GP, Hao LL, Zhang Q, Tian XN, Li CY, et al. 2013. Synthesis, characterization, in vitro and in vivo evaluation of pegylated oridonin conjugates. Int J Pharm. 456(1):80–86.
- Shi J, Guo F, Zheng AP, Zhang XY, Sun JX. 2015. Progress in the study of drug nanocrystals. Pharmazie. 70:757–764.
- Shi M, Lu XJ, Zhang J, Diao H, Li GM, Xu L, Wang T, Wei J, Meng WY, Ma JL, et al. 2016. Oridonin, a novel lysine acetyltransferases inhibitor, inhibits proliferation and induces apoptosis in gastric cancer cells through p53- and caspase-3-mediated mechanisms. Oncotarget. 7(16):22623–22631.
- Sun XY, Qu CX, Lin H, Dong JY. 2014. In vitro and in vivo evaluation of freeze-dried oridonin-loaded PEGylated liposomes. Lat Am J Pharm. 33:1144–1150.
- Tian LL, Xie KJ, Sheng DL, Wan XQ, Zhu GF. 2017. Antiangiogenic effects of oridonin. BMC Complement Altern Med. 17(1):192.
- Vasaturo M, Cotugno R, Fiengo L, Vinegoni C, Dal Piaz F, De Tommasi N. 2018. The anti-tumor diterpene oridonin is a direct inhibitor of nucleolin in cancer cells. Sci Rep. 8(1):16735.
- Wang CJ, Li W, Hu BC. 2017. The anti-tumor effect of folate-targeted liposome microbubbles loaded with oridonin as ultrasound-triggered tumor-targeted therapeutic carrier system. J Drug Target. 25(1):83–91.
- Wang CJ, Li W. 2016. Preparation, characterization, and in vitro and vivo antitumor activity of oridonin-conjugated multiwalled carbon nanotubes functionalized with carboxylic group. J Nanomater. 10:1687–1693.
- Wang SP, Zhong ZF, Wan JB, Tan W, Wu GS, Chen MW, Wang YT. 2013. Oridonin induces apoptosis, inhibits migration and invasion on highly-metastatic human breast cancer cells. Am J Chin Med. 41(1):177–196.
- Wang YY, Lv YF, Lu L, Cai L. 2014. Oridonin inhibits mTOR signaling and the growth of lung cancer tumors. Anticancer Drugs. 25(10):1192–1200.
- Wu QX, Yuan SX, Ren CM, Yu Y, Sun WJ, He BC, Wu K. 2016. Oridonin upregulates PTEN through activating p38 MAPK and inhibits proliferation in human colon cancer cells. Oncol Rep. 35(6):3341–3348.
- Xiong W, Sang W, Linghu KG, Zhong ZF, Cheang WS, Li J, Hu YJ, Yu H, Wang YT. 2018. Dual-functional Brij-S20-modified nanocrystal formulation enhances the intestinal transport and oral bioavailability of berberine. Int J Nanomed. 13:3781–3793.
- Yang J, Ren XY, Zhang LP, Li YY, Cheng B, Xia J. 2018. Oridonin inhibits oral cancer growth and PI3K/Akt signaling pathway. Biomed Pharmacother. 100:226–232.
- Zhang LD, Liu Z, Liu H, Ran DM, Guo JH, Jiang B, Wu YL, Gao FH. 2016. Oridonin enhances the anticancer activity of NVP-BEZ235 against neuroblastoma cells in vitro and in vivo through autophagy. Int J Oncol. 49(2):657–665.
- Zhang P, Zhao SR, Liu F, Sun XJ, Liu H. 2017. Oridonin induces apoptosis in human nasopharyngeal carcinoma cells involving ROS generation. Folia Biol (Praha). 63(4):155–163.
- Zhang XW, Zhang TP, Lan YL, Wu BJ, Shi ZH. 2016. Nanosuspensions containing oridonin/HP-β-cyclodextrin inclusion complexes for oral bioavailability enhancement via improved dissolution and permeability. AAPS PharmSciTech. 17(2):400–408.
- Zhang YY, Wang SH, Dai MM, Nai JJ, Zhu LQ, Sheng HG. 2020. Solubility and bioavailability enhancement of oridonin: a review. Molecules. 25(2):332.
- Zhao YX, Hua HY, Zhao Y, Zhang ZZ. 2013. Cytotoxicity and cellular kinetics of oridonin-loaded cholesterol formate-graft chitosan copolymer nano-micelles. J Control Release. 172(1):e90–e91.
- Zheng DD, Duan CX, Zhang DR, Jia LJ, Liu GP, Liu Y, Wang FH, Li CY, Guo HJ, Zhang Q. 2012. Galactosylated chitosan nanoparticles for hepatocyte-targeted delivery of oridonin. Int J Pharm. 436(1–2):379–386.
- Zhou XT, Zhang XW, Ye YH, Zhang TP, Wang H, Ma ZG, Wu BJ. 2015. Nanostructured lipid carriers used for oral delivery of oridonin: an effect of ligand modification on absorption. Int J Pharm. 479(2):391–398.