
Abstract
Context
Plastics can break down into millions of microplastic (MPs, < 5 mm) particles in the soil and ocean. These MPs can then affect the function of the reproductive system. There is currently no effective solution to this problem aside from traditional Chinese medicine. We have previously used Yishen Tongluo formula (YSTL) to treat sperm DNA damage caused by some toxic substances.
Objective
To investigate the mechanism underlying the repair of mouse sperm DNA fragmentation caused by polystyrene microplastics by YSTL.
Materials and methods
An animal model of polystyrene microplastic (PS-MP)-induced sperm DNA damage was replicated by gavage of SPF ICR (CD1) mice PS-MPs at 1 mg/d and treated with YSTL at 11.89, 23.78 and 47.56 g/kg, respectively, for 60 days. The Sperm DNA fragmentation index (DFI) of each group was detected and compared. The target genes of YSTL identified by transcriptomic and proteomic analyses were validated by qRT-PCR and western blotting.
Results
The DFI of the PS group (20.66%) was significantly higher than that of the control group (4.23%). The medium and high doses of the YSTL group (12.8% and 11.31%) exhibited a significant repairing effect. The most enriched pathway was PI3K/Akt. TBL1X, SPARC, hnRNP0, Map7D1, Eps8 and Mrpl27 were screened and SPARC was validated.
Discussion and conclusions
The precise mechanism by which YSTL inhibits PD-MPs DNA damage may be associated with the PI3K/Akt pathway and SPARC. It provides a new direction for using traditional Chinese medicine to prevent and repair reproductive system injury caused by MPs.
Introduction
Plastic products have become commonplace since their introduction in the 1950s. Plastic has become a threat to human existence because it requires hundreds of years to decompose (Guzzetti et al. Citation2018). Worldwide, landfill disposal is the most common method of plastic disposal, but this process does not properly break down the material. Because of the physical and chemical features of plastics, plastics that are discarded in landfills degrade into microplastics (MPs), which have a diameter of 5 mm and can reach both the soil and the ocean. Aquatic organisms such as fish and crustaceans ingest MPs via the food chain (Jambeck et al. Citation2015). MPs have been discovered in the human stool (Huang et al. Citation2021). Due to their small size and the various toxic compounds, additives and chemicals found within them, MPs have the potential to inflict mechanical damage to the intestine, reduce fertility, influence the organismal growth rates and exert long-term negative consequences on ecosystems (Horton et al. Citation2020; Prata et al. Citation2020).
MPs have been reported to have adverse effects on marine and terrestrial mammals (Sharma and Chatterjee Citation2017; Xu et al. Citation2020; Yong et al. Citation2020), particularly within the digestive system (Jin et al. Citation2019; Li et al. Citation2020). In recent years, an increasing number of studies have shown that MPs also affect the reproductive system (Xie et al. Citation2020; Jin et al. Citation2021). However, no solution for the reproductive toxicity caused by MPs has been found.
Yishen Tongluo formula (YSTL) consists of Cuscuta chinensis Lam (Convolvulaceae), Epimedium brevicornu Maxim (Berberidaceae), Rehmannia glutinosa Oliver (Scrophulariaceae), Salvia miltiorrhiza Bunge (Labiatae), Astragalus membranaceus Moench (Leguminosae), Cyathula officinalis K.C. Kuan (Amaranthaceae) and Whitmania pigra Whitman (Haemopidae) in a ratio of 20:20:10:30:20:10:6. YSTL has been successfully utilized in clinical practice to treat oligoasthenozoospermia (Chen et al. Citation2020; Zhang et al. Citation2020; Chen et al. Citation2021). YSTL was also shown to reduce sperm DNA fragmentation index (DFI) in our previous studies (Chen et al. Citation2020) and prevent DNA abnormal methylation in sperm (Sun et al. Citation2019).
In this study, we replicated the sperm DNA damage caused by polystyrene microplastics (PS-MPs) in a mouse model. We then observed the effect of intervention with YSTL on the DFI of the model mice. Finally, we used transcriptomic and proteomic analyses, followed by qRT-PCR and western blotting, to investigate the mechanism by which YSTL repairs sperm DNA damage.
Materials and methods
Animals
We obtained 40 male SPF ICR (CD1) mice from Henan Skbex Biotechnology Co., Ltd. (Anyang, China, licence number: SCXK(YU)2020-0005) with a body weight of 30–40 g. The mice were weighed and numbered and then grouped into five groups randomly using a random digit table generated by SPSS 26.0 software. We obtained approval from the Ethics Committee of the Traditional Chinese Medicine Hospital (TCM) of Henan Province for experimental and surgical procedures (Approval No.: PZ-HNSZYY-2020-020). During the research, the animals were housed in the individually ventilated cage (IVC) system of the central laboratory at the Henan Hospital of TCM (Licence No.: SYXK (Henan) 2011-0002). The conditions in the IVC system were 21–25 °C, 38–60% humidity, 22 air exchanges/h and a 12 h light/dark cycle. One week of adaptation feeding was permitted before the formal experiment began. Animals were fed with standard animal feed and purified water.
Materials
Polystyrene microspheres (90 nm, 2.5%) were purchased from J&K Scientific Ltd. The pharmacy at the Henan Province Hospital of Traditional Chinese Medicine (HPHTCM) supplied the seven herbal medicines that compose YSTL. These herbal medicines were then decocted into a concentration mixture equivalent to 3 g of crude herbal medicine per millilitre. YSTL was kept refrigerated at 4 °C until use. shows the Chinese and scientific names and doses of all the Chinese herbal ingredients. All the herb names have been checked at International Plant Names Index (IPNI, https://www.ipni.org/) and W3Tropicos web-based databases (https://www.tropicos.org/).
Table 1. Herbal ingredients and doses in YSTL.
PS-MP-induced sperm DNA damage model
As described in the literature (Jin et al. Citation2021), we used intragastric administration of PS-MPs in a preliminary experiment to establish a model of sperm DNA damage in mice. After 30 days of intragastric administration of 100 μL PS-MPs (10 mg/mL), minimal sperm DNA damage was observed, with no significant difference compared to the control. Thus, we extended the modelling period to 60 days, at which point we found that the sperm DFI of the PS-MP-treated mice increased remarkably in comparison with that of the controls. Based on this pilot experiment, we used continuous PS-MP exposure at 1 mg/d for 60 days to construct our mouse sperm DNA damage model.
Experimental design
Following the adaptation phase, the mice were randomly divided into five groups (n = 8). Control group members were continuously administered normal saline. The four experimental groups were established as follows: PS group (PS-MPs at 1 mg/d), YSTLL group (PS-MPs at 1 mg/d + YSTL at 11.89 g/kg), YSTLM group (PS-MPs at 1 mg/d + YSTL at 23.78 g/kg) and YSTLH group (PS-MPs at 1 mg/d + YSTL at 47.56 g/kg). YSTL and PS-MPs were administered orally (intragastric) once per day for 60 days (comparable to two spermatogenesis and maturation cycles in mice). YSTL dose was calculated with the body surface area method (Nair and Jacob Citation2016). Calculation formula: Mice: 23.78 g/kg = 12.3 × Human: (YSTL 116 g ÷ 60 kg). A laparotomy was performed to remove the testes and epididymis after the last treatment. After anaesthesia with an intraperitoneal injection of sodium pentobarbital (50 mg/kg) (Wang et al. Citation2019), the mice were weighed, and their testicles and epididymis were removed and then sacrificed by cervical dislocation. After the epididymis was removed, the blood was flushed with sterile normal saline, and the epididymal tail was severed under a microscope. The sperms were completely discharged after shocking for 1–3 min in 1 mL of normal saline, and the solution became very turbid. The retrieved sperms were frozen at −80 °C for DFI determination. The testicles were frozen in liquid nitrogen and stored at −80 °C until transcriptomic and proteomic analyses were performed.
Sperm chromatin structure assay (SCSA)
In the HPHTCM Reproductive Laboratory, we performed a modified sperm chromatin structure assay (SCSA), as described below (Evenson Citation2016). The sperm suspension was briefly defrosted, mixed with 800 mL of cold TNE buffer and then strained through a 100 µ nylon sieve. Using the same buffer, the sperm concentration in the filtered sperm suspension was diluted to 2–3 × 10⁶/mL. An acid detergent solution (200 μL) was deposited in a FACS tube, and 100 μL of the sperm suspension was added. The spermatozoa were stained with acridine orange staining solution (600 μL) after exactly 30 s. Flow cytometry (BD AccuriTM C5) was performed for each sample to assess and gate out 5000 sperm. Utilizing Accuri™ C6 plus software (BD), we computed the percentage of (red) single-stranded to (green) double-stranded fluorescence (% DFI).
Transcriptomic analysis
RNA extraction, library preparation and sequencing
After 60 days of the interventions, nine mice (three from each group) were chosen at random for transcriptomic analysis. Total RNA was isolated with TRIzol reagent (Life, cat. 265709, CA, USA) according to the kit instructions. The quality of the extracted RNA was confirmed using an Agilent 2100 Bioanalyzer Platform (Agilent, cat. G2939AA, CA, USA) and RNase-free agarose gel electrophoresis, A Ribo-Zero Magnetic Kit (Epicenter, USA) was used to eliminate aggregated prokaryotic mRNA and aggregated eukaryotic mRNA. By using arbitrary primers, aggregated mRNA fractions were split into short segments and converted into cDNA; second-strand cDNA was generated with dNTPs, DNA polymerase I and RNase H. Purifying the cDNA segments using the QIAQuick PCR isolation kit (Qiagen, Netherlands), followed by end repair, base introduction and ligation with Illumina sequencing adapters. The ligated products were sequenced using an Illumina NovaSeq 6000 (Wang et al. Citation2009).
Analysis of differentially expressed genes (DEGs) and trend analysis
DESeq2 (Love et al. Citation2014) software was employed for the analysis of differentially expressed genes across two groups (two samples were analysed with edgeR 20). We considered DEGs with an FDR (false discovery rate) of 0.05 and an absolute fold change of 2 as putative genes impacted by YSTL activity, and a trend analysis was performed on the screened DEGs. To normalize the expression information of every sample to 0, log2 (v1/v0) and log2 (v2/v0), and STEM (Short Time-series Expression Miner) software (Ernst and Bar-Joseph Citation2006) was used to stratify three groups of eight profiles with distinct expression patterns; patterns with a p ≤ 0.05 in the cluster analysis were deemed significantly distinct. The DEGs of Profiles 2 and 5 in the plots were then subjected to a Gene Ontology (GO) and Kyoto Encyclopedia of Genes and Genomes (KEGG) analysis. With FDR (Benjamini and Hochberg Citation1995)-correction, GO keywords or pathways that have a p value of 0.05 and a Q-value of 0.05 were considered to be significantly abundant.
Proteomic analysis
DIA proteome analysis
The samples were lysed in lysis buffer, which consisted of a cocktail of 2% SDS, 1 mg/mL protease inhibitor and 7 M urea, to isolate the total protein quantification (He et al. Citation2019). The proteins were digested with serial-grade modified trypsin (Promega, WI) at a substrate to enzyme ratio of 50:1 weight-to-weight over 16 h at 37 °C. The resulting peptide mixture was then redissolved in aqueous ammonium formate at a concentration of 20 mM and a pH of 10.0. For high-pH separation, a reversed-phase XBridge C18 column (4.6 mm × 250 mm, 5 μm) (Waters Corporation, USA) was utilized. The peptides were redissolved in 30 μL of an aqueous solution containing 0.1% formic acid and then identified using an Orbitrap Fusion Lumos and an EASY-nLC 1200 (Thermo Fisher Scientific, MA, USA). The raw data received were processed and analysed on the Spectronaut X platform (Biognosys AG, Switzerland) using the default parameters to obtain information regarding protein expression.
Differentially expressed proteins (DEPs) and trend analysis
GO and KEGG pathway enrichment analyses were performed for Profiles 2 and 5 as described above, and a trend analysis was conducted on the DEPs identified among the three groups.
Nine-quadrant map analysis
We constructed nine-quadrant maps to screen out genes and proteins that have comparable expression features by using the R (v3.5.1) software to analyse the changes in gene and protein expression in the transcriptome and the proteome (Wang et al. Citation2020). The nine-quadrant map was analysed quantitatively and enriched for genes in each region. Two (three and seven) of these quadrants showed the same expression trends for genes and proteins, and attention was focussed on both.
qRT–PCR and Western blot validation
qRT–PCR was adopted to verify the RNA-seq data generated from the RNA preparations described above. NovoStart® SYBR High-Sensitivity qPCR SuperMix was used in the cDNA synthesis process on a LightCycler 480 RT-PCR apparatus manufactured by Roche in Switzerland (NovoProtein, China). All primer sequences are listed in . Three independent cDNA preparations were used for each reaction. The qPCR primers were evaluated by gel electrophoresis and thermal gradients. The 2−▵▵Ct method was utilized to assess relative expression.
Table 2. Primer sequences.
Western blots were conducted to confirm the aforementioned proteomics results. Testicular tissues were homogenized in RIPA buffer containing protease inhibitors, and the protein concentration was determined using the BCA technique. Proteins were fractionated on 7.5% PAGE gels before being transferred to NC membranes. Next, we blocked the membranes with 5% Tris-buffered saline (TBST)-skim milk for 2 h at RT, followed by rinsing with TBST. After overnight incubation with primary antibodies at 4 °C, membranes were incubated with the corresponding secondary antibodies for 1 h at RT. Enhanced chemiluminescence reagents were used to visualize the protein bands, and ImageJ was used to quantify the protein intensities. The data are shown as the mean ± standard deviation, and a two-tailed Student’s t-test with a significance level of p < 0.05 was utilized to compare groups.
Results
YSTL repairs PS-MP-induced sperm DNA damage in mice
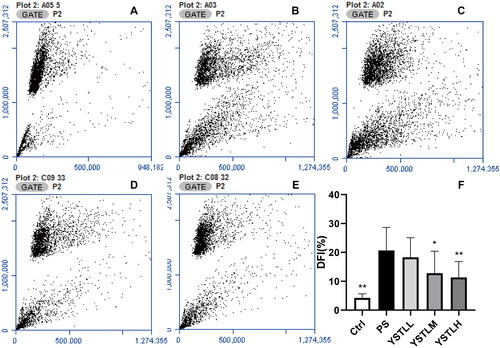
The sperm DFI of mice treated with PS-MP was significantly greater than that of control animals (20.66% vs. 4.23%, p = 0.000; ). Relative to the PS group, the DFI of the YSTLM (12.8%, p = 0.018) and YSTLH (11.31%, p = 0.005) groups showed a remarkable decrease. There was no significant difference in DFI between the YSTLM group and the YSTLH group. Transcriptional and proteomic analyses were performed on three mice from each of the three groups (control, PS, and YSTLM) to support the DFI results.
Figure 1. Sperm chromatin structure assay (SCSA) results. SCSA of sperm cells collected from the cauda epididymis (caudal sperm) in mice after exposure to PS-MPs. A–E: Flow cytometry results (DFI) (A: Control, B: PS, C: YSTLL, D: YSTLM and E: YSTLH). F: Histogram of flow cytometry results. Data are presented as the mean ± SE. The asterisks show significant differences between the PS group and the other three groups (**p < 0.01, *p < 0.05).
Transcriptomic trend analysis of DEGs
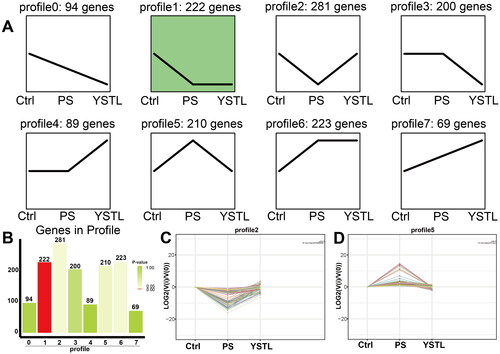
In the first step, we identified 1388 DEGs for each group through pairwise comparisons of the total mRNA expression in each group. Then we conducted a trend analysis of these DEGs and classified the DEGs into eight trend types according to the differences in the patterns of the DEGs across the three groups (). Profile 2 included 281 DEGs that were downregulated as a result of PS-MP exposure and upregulated in response to YSTL intervention (p > 0.05, . Profile 5 contained 210 DEGs that were upregulated following exposure to PS-MP and downregulated following YSTL administration (p > 0.05, ).
Figure 2. Trend analysis of DEGs. A: Trend pattern diagram based on the trend normalization of the gene expression data. The black line represents the trend line. B: Histogram of the number of genes exhibiting each trend and associated p values. The height of the column represents the number of genes, and the colour of the column represents the p value. C and D: Trend charts for Profiles 2 and 5, respectively. Each line in the figure represents a gene. The abscissa indicates the number of samples, and the ordinate indicates log2(V(i)/V(0)), i.e., the log2 value of the ratio of the expression amount of sample (i) to the expression amount of the first sample.
GO and KEGG analyses of transcriptomic trends for profiles 2 and 5
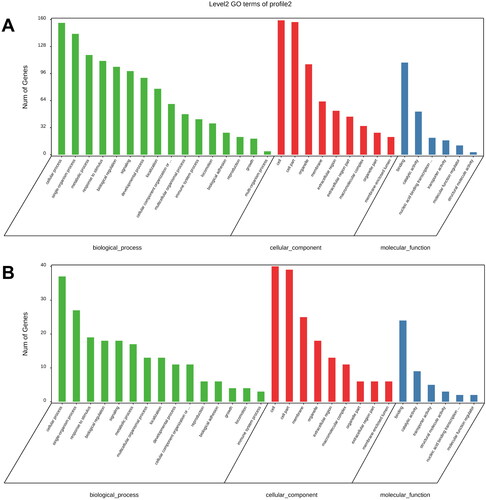
According to the GO analysis, Profiles 2 and 5 share a high degree of similarity across the 3 groups. In the BP group, the six GO terms with the highest number of genes, including both profiles, were associated with cellular mechanisms (GO: 0009987), single-organism process (GO: 0044699), metabolic process (GO: 0008152), response to stimulus (GO: 0050896), biological regulation (GO: 0065007) and signalling (GO: 0023052). In the CC category, the same top four GO terms that accounted for the greatest number of genes in both groups, namely, membrane (GO: 0016020), cell (GO: 0005623), cell part (GO: 0044464) and organelle (GO: 0043226). Binding (GO: 0005488) and catalytic activity (GO: 0003824) were the top two MF GO keywords with the highest gene counts in both analyses ().
Figure 3. Histogram of GO enrichment and classification of DEGs. The abscissa indicates the second-level GO term, the ordinate indicates the number of genes annotated with the term, and different colours represent different types of GO terms. A: Profile 2; B: Profile 5.
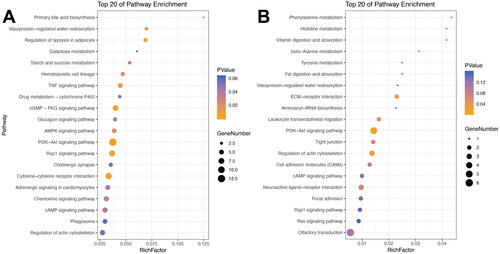
KEGG pathway analysis was also conducted for Profiles 2 and 5. The PI3K-Akt signalling cascade (ko04151), Rap1 signalling cascade (ko04015), lipolysis modulation in adipocytes (ko04923), cGMP-PKG signalling pathway (ko04022), and cytokine-cytokine receptor interaction (ko04060) were the 5 pathways with the smallest p and Q-values in Profile 2 (). For Profile 5, the five pathways with the smallest p and Q-values were the PI3K-Akt signalling pathway (ko04151), regulation of the actin cytoskeleton (ko04810), ECM-receptor interaction (ko04512), leukocyte transendothelial migration (ko04670) and phenylalanine metabolism (ko00360) ().
Figure 4. KEGG enrichment bubble diagram of DEGs. The top 20 pathways with the lowest Q-value and p value are plotted. The vertical axis indicates the pathway, the abaxial axis indicates the enrichment factor (divided by the number of different genes in the pathway), the size represents the number of DEGs, and the intensity of the red colour indicates the (lower) the Q-value. A: Profile 2; B: Profile 5.
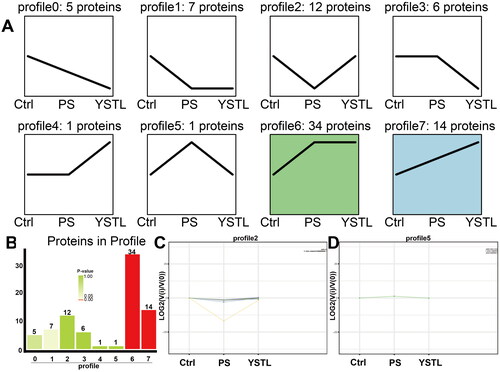
Proteomic trend analysis of DEPs
Using criteria similar to those listed above, 80 DEPs were selected for trend analysis. The DEPs were divided into eight different trend types, designated 0 through 7 (). Among these groups, we focussed on Profiles 2 and 5. In Profile 2, 12 DEPs showed downregulated expression as a result of PS-MP exposure and the opposite trend when YSTL was applied (p > 0.05, ). In Profile 5, 1 DEP was upregulated following exposure to PS-MP and downregulated following YSTL administration (p > 0.05, ). Due to the small number of DEPs enriched in the proteome, GO and KEGG pathway analyses could not be performed.
Figure 5. Trend analysis of DEPs. A: Trend pattern diagram based on trend normalization of the protein data. The black line represents the trend line. B: Histogram of the number of proteins exhibiting each trend and associated p values. The height of the column indicates the number of proteins, and the colour of the column indicates the p value. C and D: Trend charts for Profiles 2 and 5, respectively. Each line in the figure represents a protein. The abscissa indicates the number of samples, and the ordinate is log2(V(i)/V(0)), i.e., the log2 value of the ratio of the expression level in the sample (i) to the expression level in the first sample.
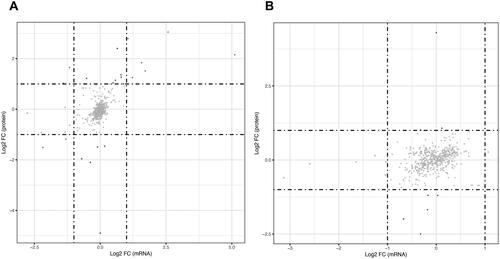
Nine-quadrant diagram screening of YSTL target genes and proteins
The transcriptome and proteome of the control group were compared with those of the PS group () and that of the YSTL group (). DEG patterns that matched the relevant protein were clustered in the third and seventh quadrants of the nine-quadrant layout. Upregulated mRNAs and proteins were found in the third quadrant, whereas downregulated mRNAs and proteins were found in the seventh quadrant. analysis of the third- and seventh-quadrant genes indicated that the mRNA and protein levels were increased in the PS group and restored to normal levels in the YSTL group (Aass, Aldh1a7, GSTA3, Bhmt and Svs1). We identified the genes that were downregulated by PS-MPs and those that were recovered by the YSTL by comparing the seventh quadrant () and third quadrant genes ().
Figure 6. Nine-quadrant diagrams. A: Control vs. PS, B: PS vs. YSTL. The horizontal axis is the multiple of transcriptome difference (log2), and the vertical axis is the multiple of protein difference (log2). Each dot represents a gene/protein; red dots represent consistent or opposing trends, green dots represent cases with differentially gene but not differential protein expression, and blue dots represent cases with differential protein but not differential gene expression. (cases in which the difference multiple is reached but the p value is not are shown in grey).
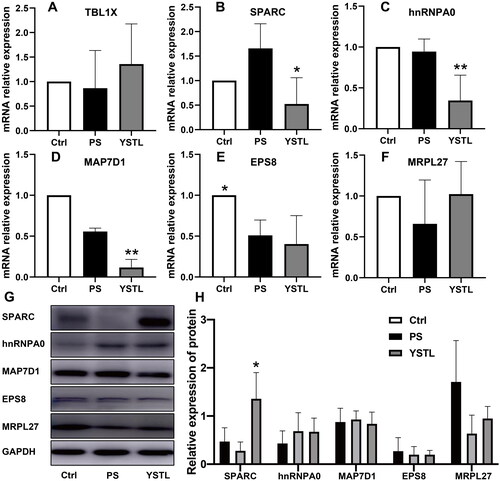
Validation of the expression of screened YSTL target genes and proteins
Western blotting and qRT-PCR were used to verify the expression patterns of the nine-quadrant screening genes (TBL1X, SPARC, hnRNP0, Map7D1, Eps8 and Mrpl27) (). qRT-PCR was conducted on three separate samples from each group (n = 3/group). The transcriptional level showed similar expression trends for TBL1X, SPARC and Mrpl27 based on RNA-seq data. The levels of hnRNP0, Map7D1 and Eps8 did not recover in the YSTL group, contrary to the RNA-seq results. We also analysed the same samples using western blots and found that SPARC and Mrpl27 showed similar expression trends to those observed using DIA. SPARC was expressed at a lower level in the PS group than in the control group (p > 0.05) and at a significantly increased level in the YSTL group compared to the PS group (p = 0.011). No protein band was observed in our western blot for TBL1X, possibly due to problems with the antibody.
Figure 7. qRT–PCR and western blot verification. The expression levels of TBL1X, SPARC, hnRNP0, Map7D1, Eps8 and Mrpl27, which were screened from the nine-quadrant diagrams, were verified by qRT–PCR and western blot. A-F: qRT–PCR. G: Western blot. H: Relative protein expression. Mean ± SD, n = 3 for qRT–PCR and western blot. Compared with the PS group, *p < 0.05, **p < 0.01.
Discussion
At present, plastic pollution has reached an critical level. Deep in the Pacific Ocean, between California and Hawaii, there is an island of plastic waste six times the size of the UK that has been dubbed the ‘eighth continent’ or the ‘Great Pacific Waste Patch’ (Lebreton et al. Citation2018). Over the past 60 years, the garbage patch has been growing in size. Simultaneously, a 7–11 km long belt of plastic deposits was discovered in the Mariana Trench, the deepest point of the world’s oceans (Peng et al. Citation2018). The oceans will contain more plastic than fish (in terms of weight) by 2050, according to the United Nations Environment Programme (UNEP Citation2016).
However, to date, modern medicine has no good solution for the decline in sperm quality caused by MPs. Currently, MP removal treatments address only the MPs in sewage (Cristaldi et al. Citation2020). Although most wastewater treatment plants have an MP removal efficiency of more than 90%, millions of MP particles are still released into the aquatic environment every day and may enter the human body through certain aquatic organisms.
Globally, approximately 15% of individuals of child-bearing age experience infertility, and infertility increases in incidence every year, with nearly half of cases being caused by male factors (Inhorn and Patrizio Citation2015). The quality of human sperm has declined gradually as a result of modernization. For instance, the average number of sperm in sample ejaculates decreased from 113 × 106/mL in 1940 to 66 × 106/mL in 1990 (Carlsen et al. Citation1992). The World Health Organization (WHO) has published 6 editions of the Lab Manual for the Investigation and Processing of Human Semen. The normal sperm count in semen has decreased from 60 × 106/mL (the first edition) (WHO Citation1980) to 15 × 106/mL (the fifth edition) (WHO Citation2010). Sperm concentrations have dropped to one-eighth of what they were 70 years ago, and sperm quality has also dropped significantly. Other factors may have been involved. Regardless, plastic pollution is one of the world’s most complex challenges.
At present, semen analysis is the main lab test used for assessing the quality of male sperm. However, research has shown that at least 50% of infertility patients have normal semen analysis results (Le et al. Citation2019). Even though sperm morphology can be only roughly obtained from semen examination, this approach cannot be used to evaluate sperm DNA, which is crucial since it influences an embryo’s health. Given that half of the chromosomes in a fertilized egg originate from the sperm, the genetic information delivered by sperm is essential for offspring health. Key genes controlling human growth, development, and reproduction are encoded in the genetic material supplied by the sperm, particularly those for the reproductive system development of male offspring (Casanovas et al. Citation2019).
Sperm DFI serves as an indicator of sperm DNA integrity. Studies have found that the DFI of infertility patients is significantly higher than that of the general population (Esteves et al. Citation2017). The DFI of men in couples with a history of recurrent abortion was also significantly higher than that of men in couples without a history of related abortion, although their semen analysis results were normal (McQueen et al. Citation2019). The literature shows that when the DFI > 27%, the successful pregnancy rate significantly decreases, resulting in infertility or miscarriage (Corona et al. Citation2019). These results indicate that sperm DFI is vital for a healthy pregnancy. DFI is also commonly utilized for male fertility assessment in clinical practice. Abnormal DFI can be caused by many factors, but two of the most important are exposure to hazardous compounds and patient age. (Zeqiraj et al. Citation2018).
MP exposure has been found to increase sperm DFI in rats (Amereh et al. Citation2020). We replicated this model in a pilot experiment in mice and found that the effect took longer to manifest, possibly because the spermatogenesis cycle of rats is significantly longer than that of mice. Therefore, we created a mouse model of PS-MP-induced DNA damage to observe the influence of TCM on DNA damage. This model is efficient and economical and worth replicating.
Some everyday vegetables have antioxidant properties, and extracts of broccoli and caraway have been shown to protect sperm DNA integrity from damage caused by cold temperatures (Raeeszadeh et al. Citation2021, Citation2022). Similar to these vegetables, herbs in YSTL have similar effects. Our previous studies found that YSTL protects sperm DNA from some toxic substances, such as benzo(a)pyrene and Tripterygium glycosides. Unexplained male infertility may be caused by MPs, which was also analysed in our recent study (Zhang et al. Citation2022), and this study found that YSTL could be tried to treat these patients.
Several herbal extracts in YSTL have been reported to protect sperm DNA from some physical and chemical damage. Cuscuta chinensis flavonoids can reduce the methylation levels of ERα and H19/Igf2 genes by inhibiting the expression of DNA methyltransferase (DNMTs), thereby reducing the levels of adult male reproductive hormones and receptors, and ultimately alleviating the negative effects of BPA on testicular development in male mice (Wei et al. Citation2020). Epimedium brevicornu flavonoids effectively reduced oxidative DNA damage in ageing rat testis through a p53-dependent pathway (Zhao et al. Citation2017). The addition of astragalus polysaccharides to the semen freezer extender prevented DNA damage caused by low temperature (Zhao et al. Citation2020).
The transduction protein (β)-like 1X-linked (TBL1X) gene is strongly associated with infertility (Fabian-Jessing et al. Citation2018). Although its exact mechanism is not well understood, it is directly related to testosterone concentration, spermatogenesis and sperm motility (Pacheco et al. Citation2020). Our results also showed that TBL1X mRNA expression decreased after PS-MP exposure and increased after YSTL intervention.
SPARC, a multifunctional secretory glycoprotein, belongs to the stromal cell protein family and is closely associated with invasion and bone metastasis in certain tumours, such as prostate cancer (Edwards Citation2012). However, SPARC also plays a significant role in the maturation, stabilization and repair of neuromuscular connections after injury (Brayman et al. Citation2021). The main phenotypic characteristics of Sparc-deficient mice are defects in the amount and morphology of fibrin collagen, and they show inactivated fibrotic responses in many different tissue environments (Bradshaw Citation2016). Here, SPARC was downregulated in the PS group and recovered after YSTL intervention, suggesting that the increase in DFI caused by YSTL repair following PS-MP exposure was caused by SPARC-mediated fibre repair.
Ribonucleoproteins (hnRNPs) are essential for nucleic acid metabolism and the control of a wide variety of cellular functions. Cancers of the lung, pancreas and stomach have all been linked to abnormal hnRNP expression (Romero-Garcia et al. Citation2014). Although an association between hnRNP0 and sperm DNA damage has not been reported, hnRNP0 is involved in the repair process after cellular DNA damage (Reinhardt et al. Citation2010). Upregulation of this gene after PS-MP exposure and its recovery after YSTL intervention was also observed, although the differences in expression were not significant.
Map7D1 is a relatively newly identified gene that has been less well studied. It is closely associated with lymph node metastasis in some tumours such as breast cancer (Wu et al. Citation2021) and acral melanoma (Lim and Lee Citation2021). In our study, MAP7D1 protein expression increased after PS exposure and recovered after YSTL intervention, suggesting that MPs can cause reproductive toxicity and tissue carcinogenesis.
Eps8 is an important actin-binding protein that has a significant function in maintaining the stability of the blood-testis barrier (BTB) (Wei et al. Citation2021). Consistent with the literature, we also found that Eps8 was downregulated in mice after PS-MP exposure, but this downregulation was not significant. This may be because the modelling dose we used (1 mg/d) was much lower than the 20 mg/kg used in other studies. No significant changes in Eps8 were observed after YSTL intervention, indicating that YSTL does not protect sperm DNA through the BTB.
Currently, there are few studies on Mrpl27, which is mainly involved in mitochondrial translation and extension, respiratory electron transport, ATP synthesis and mitochondrial intima tissue (Zhuang et al. Citation2021).
This study has some limitations. Due to limited financial support, only three cases from each group underwent omics detection, qRT-PCR and western blot validation, resulting in discrete data. In the future research, the sample size should be increased (more than five cases in each group).
Conclusions
A sperm DNA damage model was established in mice by 60 days of exposure to PS-MPs. PS-MPs can damage sperm DNA, but YSTL can alleviate this damage. The specific mechanism may be associated with the PI3K/Akt pathway and SPARC.
Author contributions
Chenming Zhang and Zulong Wang: Methodology, project administration and writing-original draft. Sicheng Ma: Resources. Rubing Chen: Formal analysis. Shiqi Wang: Data curation. Hao Zhang: Validation. Zhong Hua: Visualization. Zulong Wang & Zixue Sun: Study conceptualization, funding acquisition, writing- reviewing & editing. All writers have reviewed and approved the manuscript.
Disclosure statement
No potential conflict of interest was reported by the author(s).
Additional information
Funding
References
- Amereh F, Babaei M, Eslami A, Fazelipour S, Rafiee M. 2020. The emerging risk of exposure to nano(micro)plastics on endocrine disturbance and reproductive toxicity: from a hypothetical scenario to a global public health challenge. Environ Pollut. 261:114158.
- Benjamini Y, Hochberg Y. 1995. Controlling the false discovery rate: a practical and powerful approach to multiple testing. J R Stat Soc Ser B Stat Methodol. 57(1):289–300.
- Bradshaw AD. 2016. The role of secreted protein acidic and rich in cysteine (SPARC) in cardiac repair and fibrosis: does expression of SPARC by macrophages influence outcomes? J Mol Cell Cardiol. 93:156–161.
- Brayman VL, Taetzsch T, Miko M, Dahal S, Risher WC, Valdez G. 2021. Roles of the synaptic molecules Hevin and SPARC in mouse neuromuscular junction development and repair. Neurosci Lett. 746:135663.
- Carlsen E, Giwercman A, Keiding N, Skakkebaek NE. 1992. Evidence for decreasing quality of semen during past 50 years. BMJ. 305(6854):609–613.
- Casanovas A, Ribas-Maynou J, Lara-Cerrillo S, Jimenez-Macedo AR, Hortal O, Benet J, Carrera J, Garcia-Peiro A. 2019. Double-stranded sperm DNA damage is a cause of delay in embryo development and can impair implantation rates. Fertil Steril. 111(4):699–707.e1.
- Chen X, Sun ZX, Zhao SP, Zhang XH, Chen JS, Wang R, Men B. 2020. Yishen Tongluo recipe combined with minimally invasive surgery for the treatment of varicocele-associated asthenospermia. Nat J Androl. 26:341–345. Chinese.
- Chen YD, Bi FG, Sun ZX. 2021. A network pharmacology approach to determine the underlying mechanisms of action of Yishen Tongluo formula for the treatment of oligoasthenozoospermia. PLoS One. 16(6):e0252906.
- Corona G, Minhas S, Giwercman A, Bettocchi C, Dinkelman-Smit M, Dohle G, Fusco F, Kadioglou A, Kliesch S, Kopa Z, et al. 2019. Sperm recovery and ICSI outcomes in men with non-obstructive azoospermia: a systematic review and meta-analysis. Hum Reprod Update. 25(6):733–757.
- Cristaldi A, Fiore M, Zuccarello P, Conti GO, Grasso A, Nicolosi I, Copat C, Ferrante M. 2020. Efficiency of wastewater treatment plants (WWTPs) for microplastic removal: a systematic review. IJERPH. 17(21):8014.
- Edwards IJ. 2012. Proteoglycans in prostate cancer. Nat Rev Urol. 9(4):196–206.
- Ernst J, Bar-Joseph Z. 2006. STEM: a tool for the analysis of short time series gene expression data. BMC Bioinf. 7(1):1–11.
- Esteves SC, Agarwal A, Majzoub A. 2017. An evidence-based perspective on the role of sperm chromatin integrity and sperm DNA fragmentation testing in male infertility. Transl Androl Urol. 6(Suppl 4):S665–S672.
- Evenson DP. 2016. The Sperm Chromatin Structure Assay (SCSA (R)) and other sperm DNA fragmentation tests for evaluation of sperm nuclear DNA integrity as related to fertility. Anim Reprod Sci. 169:56–75.
- Fabian-Jessing BK, Vestergaard EM, Plomp AS, Bergen AA, Dreschler WA, Duno M, Winiarska BS, Neumann L, Gaihede M, Vorum H, et al. 2018. Ocular albinism with infertility and late-onset sensorineural hearing loss. Am J Med Genet A. 176(7):1587–1593.
- Guzzetti E, Sureda A, Tejada S, Faggio C. 2018. Microplastic in marine organism: environmental and toxicological effects. Environ Toxicol Pharmacol. 64:164–171.
- He B, Shi J, Wang X, Jiang H, Zhu HJ. 2019. Label-free absolute protein quantification with data-independent acquisition. J Proteomics. 200:51–59.
- Horton AA, Newbold LK, Palacio-Cortes AM, Spurgeon DJ, Pereira MG, Carter H, Gweon HS, Vijver MG, van Bodegom PM, da Silva MAN, et al. 2020. Accumulation of polybrominated diphenyl ethers and microbiome response in the great pond snail Lymnaea stagnalis with exposure to nylon (polyamide) microplastics. Ecotoxicol Environ Saf. 188:109882.
- Huang W, Yin H, Yang Y, Jin L, Lu G, Dang Z. 2021. Influence of the co-exposure of microplastics and tetrabromobisphenol A on human gut: simulation in vitro with human cell Caco-2 and gut microbiota. Sci Total Environ. 778:146264.
- Inhorn MC, Patrizio P. 2015. Infertility around the globe: new thinking on gender, reproductive technologies and global movements in the 21st century. Hum Reprod Update. 21(4):411–426.
- Jambeck JR, Geyer R, Wilcox C, Siegler TR, Perryman M, Andrady A, Narayan R, Law KL. 2015. Plastic waste inputs from land into the ocean. Science. 347(6223):768–771.
- Jin H, Ma T, Sha X, Liu Z, Zhou Y, Meng X, Chen Y, Han X, Ding J. 2021. Polystyrene microplastics induced male reproductive toxicity in mice. J Hazard Mater. 401:123430.
- Jin YX, Lu L, Tu WQ, Luo T, Fu ZW. 2019. Impacts of polystyrene microplastic on the gut barrier, microbiota and metabolism of mice. Sci Total Environ. 649:308–317.
- Le MT, Nguyen TAT, Nguyen HTT, Nguyen TTT, Nguyen VT, Le DD, Nguyen VQH, Cao NT. 2019. Does sperm DNA fragmentation correlate with semen parameters? Reprod Med Biol. 18(4):390–396.
- Lebreton L, Slat B, Ferrari F, Sainte-Rose B, Aitken J, Marthouse R, Hajbane S, Cunsolo S, Schwarz A, Levivier A, et al. 2018. Evidence that the Great Pacific Garbage Patch is rapidly accumulating plastic. Sci Rep. 8(1):4666.
- Li BQ, Ding YF, Cheng X, Sheng DD, Xu Z, Rong QY, Wu YL, Zhao HL, Ji XF, Zhang Y. 2020. Polyethylene microplastics affect the distribution of gut microbiota and inflammation development in mice. Chemosphere. 244:125492.
- Lim Y, Lee DY. 2021. Identification of genetic mutations related to invasion and metastasis of acral melanoma via whole-exome sequencing. J Dermatol. 48(7):999–1006.
- Love MI, Huber W, Anders S. 2014. Moderated estimation of fold change and dispersion for RNA-seq data with DESeq2. Genome Biol. 15(12):550.
- McQueen DB, Zhang J, Robins JC. 2019. Sperm DNA fragmentation and recurrent pregnancy loss: a systematic review and meta-analysis. Fertil Steril. 112(1):54–60.e3.
- Nair AB, Jacob S. 2016. A simple practice guide for dose conversion between animals and human. J Basic Clin Pharm. 7(2):27–31.
- Pacheco HA, Rezende FM, Penagaricano F. 2020. Gene mapping and genomic prediction of bull fertility using sex chromosome markers. J Dairy Sci. 103(4):3304–3311.
- Peng X, Chen M, Chen S, Dasgupta S, Xu H, Ta K, Du M, Li J, Guo Z, Bai S. 2018. Microplastics contaminate the deepest part of the world’s ocean. Geochem Persp Let. 9(1):1–5.
- Prata JC, da Costa JP, Lopes I, Duarte AC, Rocha-Santos T. 2020. Environmental exposure to microplastics: an overview on possible human health effects. Sci Total Environ. 702:134455.
- Raeeszadeh M, Khademi N, Akbari A. 2021. The effects of broccoli and caraway extracts on serum oxidative markers, testicular structure and function, and sperm quality before and after sperm cryopreservation. Cryobiology. 99:11–19.
- Raeeszadeh M, Shokrollahi B, Khademi N, Akbari A. 2022. Superior effect of broccoli methanolic extract on control of oxidative damage of sperm cryopreservation and reproductive performance in rats: a comparison with vitamin C and E antioxidant. Theriogenology. 181:50–58.
- Reinhardt HC, Hasskamp P, Schmedding I, Morandell S, van Vugt MATM, Wang X, Linding R, Ong S-E, Weaver D, Carr SA, et al. 2010. DNA damage activates a spatially distinct late cytoplasmic cell-cycle checkpoint network controlled by MK2-mediated RNA stabilization. Mol Cell. 40(1):34–49.
- Romero-Garcia S, Prado-Garcia H, Lopez-Gonzalez JS. 2014. Transcriptional analysis of hnRNPA0, A1, A2, B1, and A3 in lung cancer cell lines in response to acidosis, hypoxia, and serum deprivation conditions. Exp Lung Res. 40(1):12–21.
- Sharma S, Chatterjee S. 2017. Microplastic pollution, a threat to marine ecosystem and human health: a short review. Environ Sci Pollut Res Int. 24(27):21530–21547.
- Sun ZX, Zhang CM, Li PC, Chen JS, Wang ZL, Men B. 2019. Protective effect of Yishen Tongluo recipe against benzo(a)pyrene-induced sperm DNA methylation changes in male rats. National journal of Andrology. 25:154–159. Chinese.
- [UNEP] United Nations Environment Programme. 2016. The new plastics economy rethinking the future of plastics. Geneva: The World Economic Forum.
- Wang W, Xu D, Zhong L, Zhang W, Kang J, Zhou J, Ka W, Sun D, Xia X, Xie L, et al. 2019. Quantitative proteomics reveals TMOD1-related proteins associated with water balance regulation. PLoS One. 14(7):e0219932.
- Wang Z, Gerstein M, Snyder M. 2009. RNA-Seq: a revolutionary tool for transcriptomics. Nat Rev Genet. 10(1):57–63.
- Wang Z, Wu W, Guan X, Guo S, Li C, Niu R, Gao J, Jiang M, Bai L, Leung EL, et al. 2020. 20(S)-Protopanaxatriol promotes the binding of P53 and DNA to regulate the antitumor network via multiomic analysis. Acta Pharm Sin B. 10(6):1020–1035.
- Wei Y, Han C, Li S, Cui Y, Bao Y, Shi W. 2020. Cuscuta chinensis flavonoids down-regulate the DNA methylation of the H19/Igf2 imprinted control region and estrogen receptor alpha promoter of the testis in bisphenol A exposed mouse offspring. Food Funct. 11(1):787–798.
- Wei YX, Zhou Y, Long CL, Wu H, Hong YF, Fu Y, Wang JK, Wu YH, Shen LJ, Wei GH. 2021. Polystyrene microplastics disrupt the blood-testis barrier integrity through ROS-Mediated imbalance of mTORC1 and mTORC2. Environ Pollut. 289:117904.
- [WHO] World Health Organization. 1980. WHO Laboratory manual for the examination of human semen and semen-cervical mucus interaction. 1st ed. Singapore: Press Concern.
- [WHO] World Health Organization. 2010. WHO laboratory manual for the examination and processing of human semen. 5th ed. Geneva: WHO Press.
- Wu SL, Zhang XY, Chang MQ, Huang CC, Qian J, Li Q, Yuan F, Sun LH, Yu XM, Cui XM, et al. 2021. Genome-wide 5-hydroxymethylcytosine profiling analysis identifies MAP7D1 as a novel regulator of lymph node metastasis in breast cancer. Genom Proteomics Bioinformatics. 19(1):64–79.
- Xie XM, Deng T, Duan JF, Xie J, Yuan JL, Chen MQ. 2020. Exposure to polystyrene microplastics causes reproductive toxicity through oxidative stress and activation of the p38 MAPK signaling pathway. Ecotox Environ Safe. 190:110133.
- Xu CY, Zhang BB, Gu CJ, Shen CS, Yin SS, Aamir M, Li F. 2020. Are we underestimating the sources of microplastic pollution in terrestrial environment? J Hazard Mater. 400:123228.
- Yong C, Valiyaveettil S, Tang B. 2020. Toxicity of microplastics and nanoplastics in mammalian systems. IJERPH. 17(5):1509.
- Zeqiraj A, Gashi Z, Elezaj S, Beadini S, Beadini N, Aliu H, Bexheti S, Hajrulai-Musliu Z, Shabani A. 2018. Sperm DNA fragmentation, age and male infertility. Indo Am J Pharm Sci. 5:13856–13860.
- Zhang C, Chen J, Ma S, Sun Z, Wang Z. 2022. Microplastics may be a significant cause of male infertility. Am J Mens Health. 16(3):15579883221096549.
- Zhang Q, Fan L, Li F, Sun Z, Zhang C, Chen R. 2020. Yishentongluo decoction in treatment of idiopathic asthenozoospermia infertility: study protocol for a randomized controlled trial. Medicine. 99(43):e22662.
- Zhao H, Song L, Huang W, Liu J, Yuan D, Wang Y, Zhang C. 2017. Total flavonoids of Epimedium reduce ageing-related oxidative DNA damage in testis of rats via p53-dependent pathway. Andrologia. 49(10):e12756.
- Zhao YL, Li SZ, Ren ZL. 2020. Effects of astragalus polysaccharides on the quality of frozen-thawed Tibetan boar spermatozoa and levels of genomic DNA methylation in the sperm. Thai J Vet Med. 50:467–472.
- Zhuang LP, Meng ZQ, Yang ZG. 2021. MRPL27 contributes to unfavorable overall survival and disease-free survival from cholangiocarcinoma patients. Int J Med Sci. 18(4):936–943.