
Abstract
Context
Arjunolic acid (AA) is a triterpenoid saponin found in Terminalia arjuna (Roxb.) Wight & Arn. (Combretaceae). It exerts cardiovascular protective effects as a phytomedicine. However, it is unclear how AA exerts the effects at the molecular level.
Objective
This study investigates the cardioprotective effects of arjunolic acid (AA) via MyD88-dependant TLR4 downstream signaling marker expression.
Materials and methods
The MTT viability assay was used to assess the cytotoxicity of AA. LPS induced in vitro cardiovascular disease model was developed in H9C2 and C2C12 myotubes. The treatment groups were designed such as control (untreated), LPS control, positive control (LPS + pyrrolidine dithiocarbamate (PDTC)-25 µM), and treatment groups were co-treated with LPS and three concentrations of AA (50, 75, and 100 µM) for 24 h. The changes in the expression of TLR4 downstream signaling markers were evaluated through High Content Screening (HCS) and Western Blot (WB) analysis.
Results
After 24 h of co-treatment, the expression of TLR4, MyD88, MAPK, JNK, and NF-κB markers were upregulated significantly (2-6 times) in the LPS-treated groups compared to the untreated control in both HCS and WB experiments. Evidently, the HCS analysis revealed that MyD88, NF-κB, p38, and JNK were significantly downregulated in the H9C2 myotube in the AA treated groups. In HCS, the expression of NF-κB was downregulated in C2C12. Additionally, TLR4 expression was downregulated in both H9C2 and C2C12 myotubes in the WB experiment.
Discussion and conclusions
TLR4 marker expression in H9C2 and C2C12 myotubes was subsequently decreased by AA treatment, suggesting possible cardioprotective effects of AA.
Introduction
Cardiovascular disease has become a global health issue especially due to the modern lifestyle. Various types of cardiovascular diseases include myocardial hypertrophy, myocardial ischemia, myocardial damage, atherosclerosis plaques, diabetic cardiomyopathy, myocarditis, and perimyocarditis. Current literature implicates the inflammatory signaling pathway Toll-like receptor 4 (TLR-4)-Myeloid differentiation primary response 88 (MyD88) signaling pathway as the major pathway responsible for cardiac dysfunction (Chao Citation2009). Various research suggested that suppressing the TLR-4 signaling markers reduces the production of nuclear factor kappa B (NF-κB) followed by proinflammatory cytokines such as Interleukins (Fan et al. Citation2015).
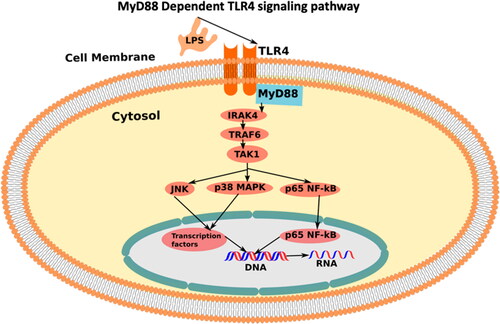
Toll-like receptors (TLRs) () are well-characterized as pattern recognition receptors in the innate immune system (Seneviratne et al. Citation2012). The mammalian TLRs can be categorized as cell membrane receptors (TLR1, TLR2, TLR4, TLR5, and TLR6) or intracellular receptors (TLR3, TLR7, TLR8, and TLR9). They are type 1 transmembrane proteins with an ectodomain consisting of leucine-rich repeats required to recognize exogenous (Pathogen Associated Molecular Patterns, PAMPs) or endogenous (Damage Associated Molecular Patterns, DAMPs) ligands; a transmembrane domain, which determines cellular localization; and an intracellular domain (TIR) needed for downstream signaling (Takeda and Akira Citation2005). Downstream signaling starts upon the recognition of DAMPs or PAMPs by TLRs leading to the recruitment of adaptor proteins such as MyD88 and TRIF.
Figure 1. MyD88-dependent TLR4 downstream signaling pathway stimulated upon the presence of LPS (the figure adopted by inkscape software).
The heart expresses at least two receptors involved in TLR signaling, i.e., TLR2 and TLR4 () (Frantz et al. Citation1999; Knuefermann et al. Citation2004). Studies have suggested that these receptors are in part responsible for cardiac dysfunction in endotoxic shock (by TLR4) and in bacterial sepsis. For example, TLR4 is essential for endotoxin-induced left ventricular (LV) dysfunction, whereas TLR2 is involved in cardiac dysfunction induced by a bacterial infection (Knuefermann et al. Citation2004).
Accordingly, recent evidence has implicated TLR4 as a central mediator of inflammation and organ injury after ischemia/reperfusion (I/R). In particular, TLR4 has been shown to play a role in the models of hepatic, pulmonary, brain, and renal warm I/R injury (Wu et al. Citation2004; Shen et al. Citation2005; Shimamoto et al. Citation2006; Caso et al. Citation2007). Moreover, mice deficient in TLR4 signaling demonstrated reduced infarct sizes and diminished inflammatory responses in models of regional warm myocardial ischemia/reperfusion mimicking myocardial infarction (Chong et al. Citation2004; Oyama et al. Citation2004).
LPS/MD-2/TLR-4 is necessary for activating the TLR-4 signaling (). Firstly, the lipopolysaccharide part of LPS is recognized by the myeloid differentiation factor 2 (MD-2) which non-covalently binds with TLR-4 and activates heterodimer (LPS/MD-2/TLR4)2. This activates intracellular signaling of LPS induced TLR-4 signaling pathway (Park et al. Citation2009).
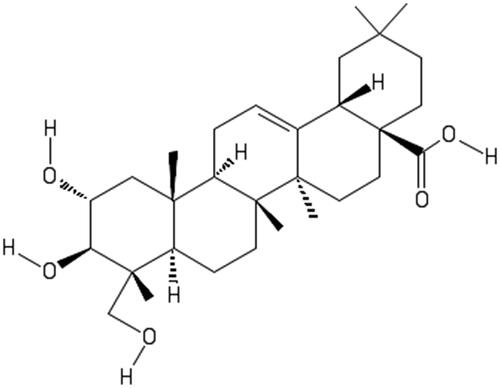
Arjunolic acid (AA), (2,3,23-trihydroxyolean-12-en-28-oic acid) (), is a chiral pentacyclic triterpenoid saponin isolated from Terminalia arjuna (Roxb.) Wight & Arn., (Combretaceae). In 2001, Sumitra et al. (Citation2001) reported the antioxidant features of AA as well as cardioprotective effects in lowering platelet aggregation and coagulation parameters in rats with isoproterenol-induced myocardial necrosis. To investigate the protective role of AA, doxorubicin-induced cardiac apoptosis model in rats was reported by Ghosh et al. (Citation2011). The study suggested that AA treatment prevented doxorubicin-induced activation of the c-Jun N-terminal Kinase (JNK)-p38 and p53 signaling pathways, which are involved in the regulation of apoptosis in the heart tissue. They further confirmed the effects of AA in the prevention of doxorubicin-induced structural damage and apoptosis in the heart tissue of the rats (Ghosh et al. Citation2011).
Figure 2. Structure of arjunolic acid (2,3,23- trihydroxyolean-12-en-28-oic acid) (the figure adopted by ChemDraw).
When cardiac toxicity was induced by oral sodium nitrite, AA therapy was shown to enhance the cytokine balance by decreasing the levels of pro-inflammatory cytokines and increasing the levels of anti-inflammatory cytokines in the heart tissue of the rats (Al-Gayyar et al. Citation2014). Rats with abdominal aortic constriction-induced cardiac hypertrophy and heart failure responded beneficially to arjunolic acid treatment, which significantly reduced high levels of carbonic anhydrase II and enhanced cardiac function (Kalyanavenkataraman et al. Citation2016).
A recent molecular docking analysis investigated the potential therapeutic effects of AA from Terminalia arjuna on APOE4, a genetic risk factor for coronary artery disease and Alzheimer’s disease. The findings demonstrated that AA had a high affinity for APOE4 and established stable connections to the key amino acid residues in the protein, suggesting a potential reduction in beta-amyloid plaques linked to atherosclerosis and coronary artery disease as well as Alzheimer’s disease (Hazarika et al. Citation2021).
Elsawy et al. (Citation2022) performed an in vivo study to evaluate the protective effects of AA in LPS-induced septic myocardial injury. The results showed that treatment with AA significantly improved cardiac function and reduced markers of oxidative stress and inflammation in rats with LPS-induced septic myocardial injury. Additionally, AA treatment improved mitochondrial function and reduced apoptosis in the heart tissue of the rats.
In a review, Hemaltha compiled the potential of AA indicating beneficial effects in cardioprotection, anticancer, antidiabetic, antifungal, antibacterial, antioxidant, and wound healing (Hemalatha et al. Citation2010). AA has been reported to possess a cardioprotective effect through different mechanisms. According to Miriyala et al. (Citation2015), arjunolic acid improved myocardial infarction (MI) by inhibiting reactive oxygen species (ROS) generation. The research demonstrated decreased levels of p47(phox)-serine phosphorylation and mitochondrial dysfunction upon treatment of AA (Miriyala et al. Citation2015). In a different study, cardiac fibrosis was reversed by AA by inhibiting non-canonical transforming growth factor (TGF)-β signaling. Inhibition of TGF-β-activated kinase 1 (TAK1) phosphorylation leads to the reduction of p38 mitogen-activated protein kinase (MAPK) and nuclear factor kappa B (NF-κB) p65 activation (Bansal et al. Citation2017). To evaluate vascular inflammation and cardiac dysfunction associated with type 1 diabetes, Manna and Sil (Citation2012) reported extended research covering hyperglycemia, membrane disintegration, oxidative stress, vascular inflammation, and the activation of oxidative stress-induced signaling cascades leading to cell death mechanisms. The molecular mechanisms were evaluated by measuring NF-κB and MAPKs (p38 and ERK1/2) activations, mitochondrial membrane depolarization, cytochrome C release, caspase 3 activation, and PARP cleavage in apoptotic cell death in the diabetic cardiac tissue. The results supported the cardioprotective effects of AA (Manna and Sil Citation2012). Oxidative myocardial injury was induced by arsenic where cardiac glutathione (GSH) and total thiol contents decreased whereas the levels of oxidized glutathione (GSSG), lipid peroxidation end products, and protein carbonyl content increased. The cardioprotective effects of AA were further confirmed by histological analysis (Manna et al. Citation2008).
Taken together, these studies have used a variety of experimental models to investigate the effects of AA on cardiac function and cardiovascular disease, including isoproterenol-induced myocardial injury in rats, doxorubicin-induced cardiac apoptosis in mice, oral sodium nitrite-induced cardiac toxicity in rats, abdominal aortic constriction-induced cardiac hypertrophy and heart failure in rats, molecular docking analysis with a coronary artery disease target APOE4, and LPS-induced septic myocardial injury in rats. AA has been demonstrated to have potential pharmacological effects as a cardioprotective drug, although the molecular basis for this effect is not well known. Therefore, in order to create potential therapeutic agents, this study sought to better define the molecular mechanisms of AA. As a result, this research may pave the way for the development of a novel therapeutic agent for cardiovascular disease research.
Materials and methods
Cell lines, chemicals, and reagents
H9C2 and C2C12 myoblast cell lines were procured from ATCC (USA). List of chemicals, reagents and consumables: Dulbecco’s modified Eagle’s medium (DMEM) (Thermo Fisher Scientific, USA), Fetal Bovine Serum (Thermo Fisher Scientific, USA), Penicillin-streptomycin (Thermo Fisher Scientific, USA), Horse Serum (Thermo Fisher Scientific, USA), Bovine Serum Albumin (BSA) (Thermo Fisher Scientific, USA), Trypsin EDTA (Thermo Fisher Scientific, USA), Lipopolysaccharide (LPS) extracted from E. coli (Sigma, L3024) (Thermo Fisher Scientific, USA), 3-(4,5-dimethyl-2-thiazolyl)-2,5-diphenyl-2H-tetrazolium bromide (MTT) (Thermo Fisher Scientific, USA), HCS Plate CellCarrier-96 ultra + LID (6055302, Perkin Elmer), 4′,6-diamidino-2-phenylindole, DAPI (Thermo Fisher Scientific, USA), Triton X-100 (Thermo Fisher Scientific, USA), Primary antibodies: TLR4 (1/250), MyD88 (1/500), p38 MAPK (1/1000), JNK (1/1000), NF-κB (1/1000) (Abcam, USA), Secondary antibodies for Western blot (Abcam, USA): Goat Anti-Mouse Immunoglobulin G (Heavy and light chain), IgG H&L (Horseradish Peroxidase, HRP) preadsorbed (ab97040) (1/1000) and Goat Anti-Rabbit IgG H&L (HRP) preadsorbed (ab7090) (1/1000), Secondary antibodies for HCS (Abcam, USA): Goat Anti-Rabbit IgG H&L (Cyanine, Cy3 labelled) preadsorbed (ab6939) (1/1000) and Goat Anti-Rabbit IgG H&L (Cyanine, Cy5 labelled) preadsorbed (ab6564) (1/1000), ECL, enhanced chemiluminescence gel, Cell counting slides with trypan blue dye for Bio-Rad cell counter TC-20 (Bio-Rad, USA). Arjunolic acid (AA) was procured from Sigma-Aldrich (SMB00119) with a purity of ≥ 95% (LC/MS-ELSD). 1-Pyrrolidinecarbodithioic acid ammonium salt (PDTC) was procured from Sigma-Aldrich (P8765-5G) with a purity of ∼99%.
Cell culture
H9C2 myoblast cell lines and C2C12 myoblast were cultured according to the protocol described by Morabito et al. (Citation2010). In short, the H9C2 myoblast and C2C12 myoblast cell lines were maintained in Dulbecco’s modified Eagle’s medium (DMEM) supplement with 10% fetal bovine serum, 100 units/mL penicillin, and 100 µg/mL streptomycin at 37 °C in humidified atmosphere containing 5% CO2. For the C2C12 myoblast cell lines, the cell density was 5 × 10³ cells/cm2 in a T-25 or T-75 cell culture flask. The H9C2 myoblast cell lines were cultured at a density of 5 × 10³ cells/cm2 in a T-25 or T-75 cell culture flask. Both the cell lines were sub-cultured upon 70-80% confluency when the cells with lower passage were used for experiments. The cells were counted using Bio-Rad’s TC20TM cell counter.
H9C2 and C2C12 myoblast differentiation (myoblast to myotube)
The differentiation of the rat heart H9C2 myoblast and C2C12 myoblast cells (ATCC, USA) into myotube cells was performed according to the protocol described by Gilde et al. (Citation2003) and Mishra and Chatterjee (Citation2014). Firstly, the H9C2 and C2C12 myoblasts were maintained in a growth medium containing Dulbecco’s modified Eagle’s medium (DMEM) supplement with 10% fetal bovine serum, 100 units/mL penicillin, and 100 µg/mL streptomycin at 37 °C in humidified atmosphere containing 5% CO2. Cells were seeded in the T-25 flasks for western blot and 96 well-plate for HCS experiments at a density of 5 × 10³ cells/cm2. The grown medium was changed every two days. Upon reaching the confluence, the growth medium was changed to a differentiation medium by using DMEM supplemented with 2% horse serum. The differentiation medium was changed every two days and the cell differentiated by 4-5 times of medium switch. The cell differentiation was confirmed by observing the cell fusion through an inverted microscope.
Cell grouping and treatments
LPS and three different dosages of AA were used to co-treat cultured H9C2 and C2C12 myotube cells for 24 h. The MTT assay was used to assess arjunolic acid’s cytotoxicity. Myotubes in the control group were left untreated, while those in the LPS control group received only LPS treatment. LPS and PDTC (25 µM) comprised the positive control group. LPS and AA were combined in the AA treatment groups (100, 75 and 50 µM). Using H9C2 and C2C12 myotubes, the following treatment groups were created for this study: control (cells were cultured with DMEM), LPS control (cells were cultured with DMEM and 1 µg/mL LPS for 24 h), positive control (cells were cultured with DMEM, 1 µg/mL LPS, and 25 µM PDTC for 24 h), AA-100 µM treatment group (cells were cultured with DMEM, 1 µg/mL LPS, and 100 µM AA for 24 h), AA-75 µM treatment group (cells were cultured with DMEM, 1 µg/mL LPS, and 75 µM AA for 24 h), AA-50 µM treatment group (cells were cultured with DMEM, 1 µg/mL LPS, and 50 µM AA for 24 h).
Cell viability assay of AA by MTT assay
The MTT [3-(4,5-dimethylthiazol-2-yl)-2,5-diphenyltetrazo-lium bromide] assay was performed according to Bakar and Tan (Citation2017). C2C12 myoblast cells and H9C2 myoblast cells were seeded at a cell count of 5.0 × 10³ and 5 × 10³ cells/well, respectively, in a 96-well plate. Then the cells were incubated in 100 µL DMEM per well for 24 h in a humidified condition of 5% CO2. Different doses of arjunolic acid (3.12, 6.25, 12.5, 25, 50, 100, 200, 400 µM) were added to each well. The first well was treated with the highest AA concentration (400 µM) followed by serial dilution of the rest of the seven dose groups. The MTT solution 20 µL per well in the concentration of 5 mg/mL was introduced to the cells followed by an incubation for 4 h at 37 °C in the dark. The plate was then agitated to ensure the dissolution of the formazan crystal. Absorbance was measured at the wavelength of 590 nm using a multi-well plate reader (Synergy HTX, Software Version 2.09.1).
The percentage of viable cells was interpreted by normalizing the log (Absorbance) from 0% (smallest mean) to 100% (largest mean). Then, a nonlinear regression model was used by selecting Log (inhibitor) vs. normalized response– variable slope in GraphPad Prism 8 to acquire the results for IC50. The mean of each group was compared with the untreated control group using one-way ANOVA followed by Dunnett’s test using IBM SPSS software. Significance levels were marked as *p < 0.05, **p < 0.01, ***p < 0.001. All the MTT experiments took place using n = 3 when at least three independent studies were performed to validate the replicability of the results.
LPS treatment protocol
LPS was prepared according to the manufacturer’s protocol. In brief, LPS was dissolved in PBS (1 mg/mL) and sonicated for 2 min before treating the cells. The stock was sterilized with a 0.22 µm pore-size syringe filter (Beiter et al. Citation2018). The cells were treated with 1 µg/mL of LPS.
High content screening (HCS)
The H9C2 and C2C12 myoblasts were seeded in 96 well HCS Plate CellCarrier-96 ultra + LID (6055302, Perkin Elmer). Both the cell lines were differentiated according to the differentiation protocol to form myotubes. The HCS was performed according to the protocol described by Proszynski et al. (Citation2009) and Rahiman et al. (Citation2017) with some modifications. Cells were fixed by Image-iTTM Fixative Solution (High purity 4% formaldehyde in PBS, methanol-free) according to the manufacturer’s protocol using 15 µL of Image-iTTM Fixative Solution for 10-15 min at room temperature followed by washing with PBS. Cell permeabilization was done with 0.5% Triton X-100 (Procured from Thermofisher) for 15 min. Nonspecific staining was blocked with a blocking buffer (Starting block solution) for 1 h at room temperature. Primary antibodies were added to the cells and incubated overnight at 4 °C. The cells were incubated with secondary antibodies Goat Anti-Rabbit IgG H&L (Cy3) preadsorbed (AB6939, Abcam) or Goat Anti-Rabbit IgG H&L (Cy5) Preadsorbed (AB6564, Abcam) according to the host-antibody interaction pattern for 2 h. The nuclei were stained by DAPI Solution (Thermofisher, 62248) at 1 µg/mL for 15 min at room temperature under subdued lab lighting according to the manufacturer’s protocol. Cells were washed three times with PBS in between the incubations.
The IN Cell Analyzer 2200 (GE Healthcare) was used to acquire the microscopic images. Ten fields from each well were scanned at two magnifications (10× and 60×). Using the appropriate excitation and emission filters on the IN Cell Analyzer 2200, three dyes—DAPI, Cy3, and Cy5—emitted fluorescence signals were detected.
Image analysis was done by customizing the myotube analysis protocol of the IN Cell Developer Toolbox v1.9.2.
Three phases of high content screening were carried out. The treated myotube cells were first stained with primary and secondary antibodies in the immunocytochemistry stage, which was followed by nuclear counterstaining (DAPI). The IN Cell Analyzer 2200 was used to acquire the image in the second stage. In the last step, IN Cell Developer Toolbox v1.9.2 analyzed the images. The goal of the study was to use HCS analysis to convert phenotypic signals from rat heart H9C2 myotubes and skeletal muscle cell C2C12 myotubes into quantitative data. The ability of HCS to acquire a large number of high-quality photos is a crucial characteristic. As a result, the image components could be distinguished with great accuracy. The HCS study incorporated 4′,6-diamidino-2-phenylindole (DAPI, Thermo Scientific) staining to identify the nucleus. Using primary (MyD88, NF-κB, JNK, and MAPK) and secondary (secondary antibody labeled with Cy3 and Cy5) antibodies, the expression of TLR4 signaling proteins was assessed. Consequently, the images labeled both the counterstained nucleus and the intracellular proteins. The proteins stained with antibodies were located in the cytoplasm and nucleus. The myotube segmentation protocol from the context mode of the IN Cell Developer Toolbox software was used to segment the myotube and stain both the nucleus and myotube. The protocol for image analysis was modified in accordance with the microscopic images acquired by the IN Cell Analyzer 2200 during immunocytochemistry investigations. The phenotypic data from the segmented myotube images was converted into quantitative data when the image analysis procedure had finished.
Western blot
Western blot analysis was performed according to the previously reported protocol by Bakar and Tan (Citation2017) with some modifications. In short, the H9C2 myotubes and C2C12 myotubes were lysed by RIPA lysis and extraction buffer by ThermoFisher. The protein concentration was measured by the BCA protein assay kit (23227 Pierce™). The protein sample was prepared by adding Lane Marker Reducing Sample Buffer (5×) (39000 PierceTM). Prior to loading into the gel, the samples were heated at 95 °C for 2 min and allowed to cool at room temperature. The SDS-PAGE separating gel (10%) and stacking gel (5%) were prepared according to the manufacturer’s protocol. To separate the proteins by electrophoresis on a Bio-Rad small gel tank, equal amounts of extracted proteins (20 µg) were loaded equally into each well of SDS-PAGE stacking gel. The separated proteins were transferred to a polyvinylidene difluoride (PVDF) membrane using an iBlot 2 Thermo-Fisher Scientific dry transfer device. The Starting Block T20 (TBS) Blocking Buffer was used as a blocking buffer for 1 h at room temperature with agitation that contains a proprietary protein formulation in Tris-buffered saline at pH 7.5 with 0.05% Tween-20 detergent. The PVDF membrane was incubated overnight at 4 °C on a belly dancer with the diluted primary antibodies of the selected markers [TLR-4 (1:250), MyD88 (1:500), IRAK-4 (1:1000), p65 NF-κB (1:1000), JNK (1:1000), p38 (1:1000)]. The membrane was washed 3 times by PBS-T for 5 min each time. According to the reactivity of the primary antibody’s species, the secondary antibodies were chosen as horseradish peroxidase (HRP) labeled goat anti-mouse IgG H&L or goat anti-rabbit secondary antibodies (1:2000, ab97040, or ab7090) and diluted in StartingBlock T20. The membranes were then incubated on the belly dancer for 2 h at room temperature before being thoroughly washed. ECL Plus Western Blotting Substrate (32134 PierceTM) was used for signal detection in accordance with the manufacturer’s instructions. Briefly, 2 mL of PierceTM ECL Plus Western Blotting Substrate Solution A and 50 µL of Solution B were combined, and the mixture was incubated for 5 min at room temperature. The result was visualized by chemiluminescence Gel Imager and analyzed by ChemiDoc as well as Image lab software (Bio-Rad).
Statistical analysis
Statistical analysis was performed by IBM SPSS software, Version 22. The MTT dose groups were compared with the control group by one-way ANOVA followed by a Dunnett t-test. The HCS analysis data were analyzed by one-way ANOVA followed by Bonferroni post hoc test. For Western Blot analysis, the treatment groups were compared using one-way ANOVA followed by a post hoc Dunnett t-test. Significance level were marked as *p < 0.05, **p < 0.01, ***p < 0.001 for the area of myotube of untreated control, LPS (1 µg/mL) control + PDTC (25 µM), LPS (1 µg/mL) +AA (50, 75 and 100 µM) vs. LPS treated (1 µg/mL).
Results
Cell toxicity studies
The MTT assay was aimed to determine the safety and viability of rat myocardium cell H9C2 myoblast and mouse skeletal muscle cell C2C12 myoblast upon exposure to AA at different concentrations (3.12, 6.25, 12.5, 25, 50, 100, 200, 400 µM). The cells were treated with AA for 24 h after the cell monolayer was determined to be 70-80% confluent. As shown in , the absorbance (Mean) of the dissolved formazan was captured at 590 nm wavelength using a multi-well plate reader (Synergy HTX, Software Version 2.09.1).
Figure 3. MTT viability assay of AA in H9C2 and C2C12 myoblast cells. The experiment was performed according to Bakar and Tan (Citation2017). MTT viability assay result was analyzed by GraphPad Prism, Version 8. A nonlinear regression model was used to determine IC50. Finally, statistical analysis was performed in IBM SPSS, Version 22. In The treatment groups (3.12, 6.25, 12.5, 25, 50, 100, 200, 400 µM) were compared with the untreated control group by one-way ANOVA followed by a post hoc Dunnett t-test. Significance level were marked as* p < 0.05, **p < 0.01, ***p < 0.001. Three independent experiments took place where each experiment contained n = 3 wells. Total absorbance (Mean) of n = 9 is shown. In , three independent experiment data were compiled and drawn in nonlinear regression to determine the IC50. The untreated cells were normalized to 100%.
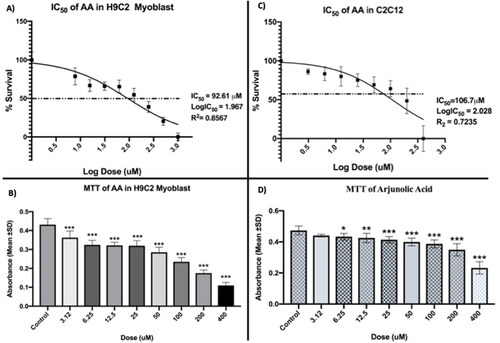
According to the findings, the absorbance (Mean) started to dramatically fall when compared to the untreated control. Less absorbance than the untreated control shows the existence of dead cells because the dead cell was unable to convert the MTT into formazan crystals. As a result, the considerable dose-dependent drop in absorbance with increasing doses shows that cell death occurs at greater concentrations. In this regard, our goal was to ascertain the IC50, or the concentration at which 50% of the cells were still viable.
shows the non-linear regression model that was used to calculate the IC50 of AA (A and C). The IC50 of AA for H9C2 and C2C12 myoblast was determined by the non-linear regression model to be 92.61 µM and 106.7 µM, respectively.
HCS immunocytochemistry analysis
Effects of AA on LPS-stimulated H9C2 myotubes
Effect of AA on the MyD88 expression in LPS-stimulated H9C2 myotubes
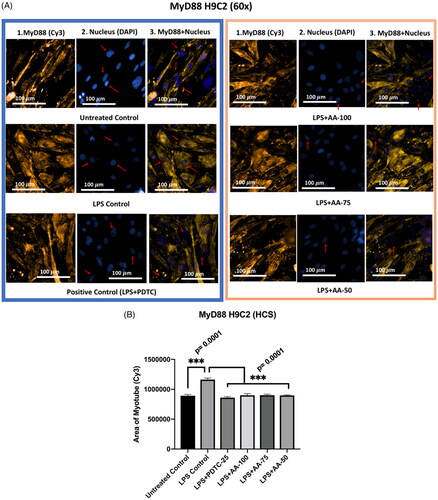
The effect of AA was evaluated on the expression of MyD88 in LPS-stimulated H9C2 myotubes. In this regard, we treated the differentiated H9C2 myotubes in six groups such as untreated control, LPS (1 µg/mL) control, LPS (1 µg/mL) + PDTC (25 µM), LPS (1 µg/mL) + AA (50, 75 and 100 µM).
The findings revealed that (), demonstrating the upregulation of MyD88 markers upon LPS stimulation, the LPS control group was significantly different (***p < 0.001) from all other groups. Additionally, there was no statistically significant difference between the LPS + AA-treated group and the untreated control groups, which indicates great hope for reversing the LPS-stimulated upregulations.
Figure 4. A) Differentiated H9C2 myotubes stained with primary anti-MyD88 and secondary antibody labeled with Cy3 fluorescent dye along with DAPI counterstaining. B) Area of myotube (Mean ± SEM) results of MyD88 in H9C2 myotube. .1 column shows the MyD88 stained with Cy3, A.2 shows the counterstained picture of DAPI staining, and A.3 is the merged images of both Cy3 and DAPI staining. The images of were captured in 60× magnification by in cell Analyzer 2200. Whereas shows the area of segmented myotubes. The dose groups were compared with control and LPS control groups by one-way ANOVA followed by the Dunnett t-test. Significance level were marked as *p < 0.05, **p < 0.01, ***p < 0.001 for the area of myotube of untreated control, LPS (1 µg/mL) control + PDTC (25 µM), LPS (1 µg/mL) + AA (50, 75 and 100 µM) vs. LPS treated (1 µg/mL).
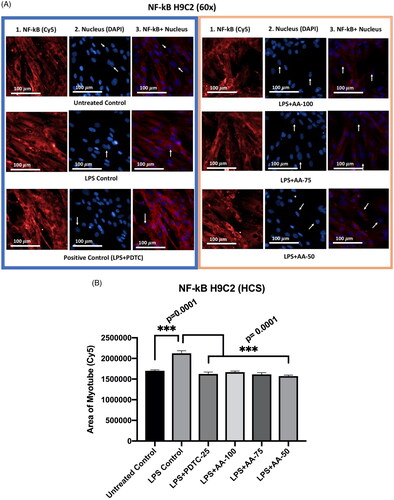
Effect of AA on NF-κB expression in LPS-stimulated H9C2 myotubes
NF-κB plays an important role in inflammation and the MyD88-dependent TLR4 signaling pathway. The study aimed to investigate the expression of NF-κB markers upon LPS stimulation of H9C2 myotubes. An NF-κB inhibitor PDTC was used as a drug control for the experiment. The experiment groups were of untreated control, LPS (1 µg/mL) control, LPS (1 µg/mL) +PDTC (25 µM), LPS (1 µg/mL) +AA (50, 75 and 100 µM) for 24 h. The untreated group was compared with other groups and there was a significant difference with LPS groups that provides evidence of NF-κB stimulations upon LPS treatment. Furthermore, the treatment groups were compared with LPS (1 µg/mL) treated groups when the results () showed that the upregulation of NF-κB was significantly reduced (***p < 0.001) by cotreatment of LPS (1 µg/mL) +PDTC (25 µM), LPS (1 µg/mL) +AA (50, 75 and 100 µM). Therefore, we could infer that the NF-κB stimulations were upregulated whereas the AA-treated groups reduced the protein expression level of NF-κB significantly.
Figure 5. A) Differentiated H9C2 myotubes stained with primary anti-NF-κB and secondary antibody labeled with Cy5 fluorescent dye along with DAPI counterstaining. B) Area of myotube (Mean ± SEM) results of NF-κB in H9C2 myotube. .1 column shows the NF-κB stained with Cy5, A.2 shows the counterstained picture of DAPI staining, and A.3 is the merged images of both Cy5 and DAPI staining. The images of were captured in 60x magnification by in cell Analyzer 2200. Whereas shows the area of segmented myotubes. The dose groups were compared with control and LPS control groups by one-way ANOVA followed by the Dunnett t-test. Significance level were marked as *p < 0.05, **p < 0.01, ***p < 0.001 for the area of myotube of untreated control, LPS(1 µg/mL) control + PDTC (25 µM), LPS (1 µg/mL) + AA (50, 75 and 100 µM) vs. LPS treated (1 µg/mL).
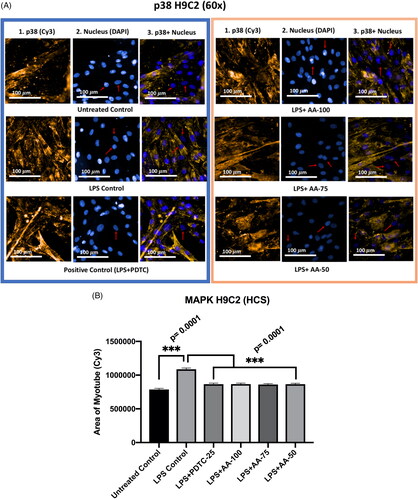
Effect of AA on the p38 MAPK expression in LPS-stimulated H9C2 myotubes
Mitogen-activated protein kinases (MAPKs) are important markers in the TLR4 signaling pathway. It has been reported that the MAPKs work mediates the transportation of different extracellular stimuli to intracellular space consequently inflammatory responses or apoptosis occur in the cell. As our study includes the treatment of LPS to look closely into the TLR4 signaling pathway, it is important to observe how AA treatment influences p38 MAPK marker regulation.
The differentiated H9C2 myotubes were treated in six groups (untreated control, LPS (1 µg/mL) control, LPS (1 µg/mL) +PDTC (25 µM), LPS (1 µg/mL) +AA (50, 75 and 100 µM) when compared with untreated control, LPS control and drug control (PDTC). The results () showed that the LPS control was significantly different (***p < 0.001) from the rest of the groups indicating the upregulation of p38 MAPK protein. As the PDTC (25 µM) and AA (50, 75, and 100 µM) treated groups were cotreated with LPS (1 µg/mL), the result suggests that the cardioprotective effects of PDTC and AA were mediated by downregulating p38 MAPK expression when stimulated by LPS treatment.
Figure 6. A) Differentiated H9C2 myotubes stained with primary anti-p38 MAPK and secondary antibody labeled with Cy3 fluorescent dye along with DAPI counterstaining. B) Area of myotube (Mean ± SEM) results of p38 MAPK in H9C2 myotube. .1 column shows the p38 MAPK stained with Cy3, A.2 shows the counterstained picture of DAPI staining, and A.3 is the merged images of both Cy3 and DAPI staining. The images of were captured in 60× magnification by in cell Analyzer 2200. Whereas shows the area of segmented myotubes. The dose groups were compared with control and LPS control groups by one-way ANOVA followed by the Dunnett t-test. Significance level were marked as *p < 0.05, **p < 0.01, ***p < 0.001 for the area of myotube of untreated control, LPS (1 µg/mL) control + PDTC (25 µM), LPS (1 µg/mL) + AA (50, 75 and 100 µM) vs. LPS treated (1 µg/mL).
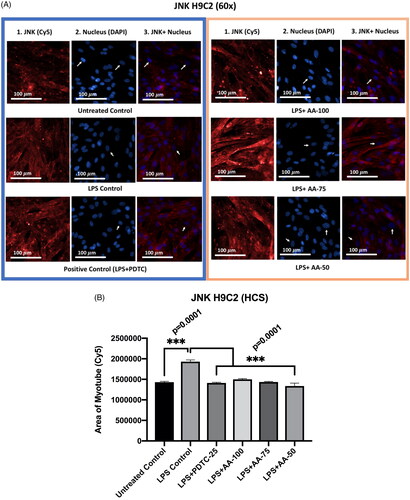
Effect of AA on the JNK expression in LPS-stimulated H9C2 myotubes
From the results (), we could see that there was no significant difference between the untreated control group with PDTC (25 µM) and AA (50, 75, and 100 µM) treated groups even though the PDTC (25 µM) and AA (50, 75 and 100 µM) were cotreated with LPS (1 µg/mL). Secondly, the JNK marker expression in the LPS treated group was significantly increased (p < 0.001) from the rest of the groups. Thirdly, there was no significant difference between PDTC (25 µM) and AA (50, 75, and 100 µM) as well as the untreated control group. Therefore, the results suggest that AA and PDTC suppressed JNK protein expression in LPS stimulated H9C2 myotube.
Figure 7. A) Differentiated H9C2 myotubes stained with primary anti-JNK and secondary antibody labeled with Cy5 fluorescent dye along with DAPI counterstaining. B) Area of myotube (Mean ± SEM) results of JNK in H9C2 myotube. .1 column shows the JNK stained with Cy5, A.2 shows the counterstained picture of DAPI staining, and A.3 is the merged images of both Cy5 and DAPI staining. The images of were captured in 60× magnification by in cell Analyzer 2200. Whereas shows the area of segmented myotubes. The dose groups were compared with control and LPS control groups by one-way ANOVA followed by the Dunnett t-test. Significance level were marked as *p < 0.05, **p < 0.01, ***p < 0.001 for the area of myotube of untreated control, LPS (1 µg/mL) control + PDTC (25 µM), LPS (1 µg/mL) + AA (50, 75 and 100 µM) vs. LPS treated (1 µg/mL).
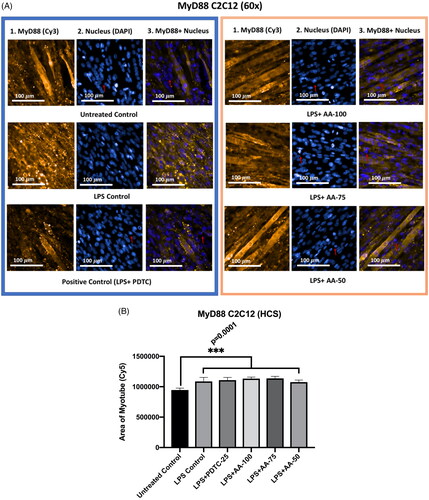
Effect of AA on the MyD88 expression in LPS-stimulated C2C12 myotubes
The results () showed that MyD88 protein expression in the untreated control group was significantly different (***p < 0.001) from all other groups indicating the upregulation of MyD88 markers upon LPS stimulation. However, there were no significant differences between LPS control with LPS + PDTC and LPS + AA treated groups, which shows that AA at all concentrations tested and PDTC was not able to suppress the increased expression of MyD88 in LPS stimulated C2C12 myotube.
Figure 8. A) Differentiated C2C12 myotubes stained with primary anti-MyD88 and secondary antibody labeled with Cy3 fluorescent dye along with DAPI counterstaining. B) Area of myotube (Mean ± SEM) results of MyD88 in C2C12 myotube. .1 column shows the MyD88 stained with Cy3, A.2 shows the counterstained picture of DAPI staining, and A.3 is the merged images of both Cy3 and DAPI staining. The images of were captured in 60× magnification by in cell Analyzer 2200. Whereas shows the area of segmented myotubes. The dose groups were compared with control and LPS control groups by one-way ANOVA followed by the Dunnett t-test. Significance level were marked as *p < 0.05, **p < 0.01, ***p < 0.001 for the area of myotube of untreated control, LPS (1 µg/mL) control + PDTC (25 µM), LPS (1 µg/mL) + AA (50, 75 and 100 µM) vs. LPS treated (1 µg/mL).
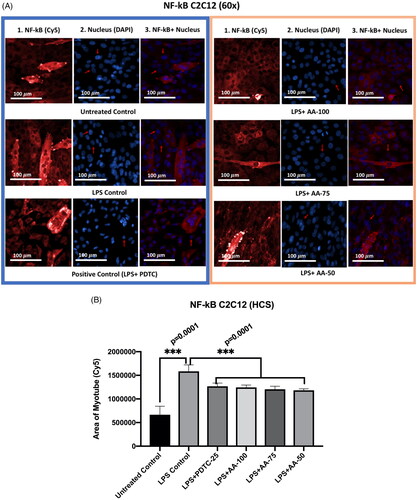
Effect of AA on the NF-κB expression in LPS-stimulated C2C12 myotubes
The experiment groups () were of untreated control, LPS (1 µg/mL) control, LPS (1 µg/mL) +PDTC (25 µM), LPS (1 µg/mL) +AA (50, 75 and 100 µM) for 24 h. The untreated group was compared with other groups and there was a significant difference with LPS groups that provides evidence of increased NF-κB protein expression upon LPS treatment. Furthermore, the treatment groups were compared with LPS (1 µg/mL) treated groups when the results showed that the upregulation of NF-κB was significantly reduced (***p < 0.001) by cotreatment of LPS (1 µg/mL) +PDTC (25 µM), LPS (1 µg/mL) +AA (50, 75 and 100 µM). Therefore, we could conclude that LPS increased NF-κB expression and that AA was able to dramatically lower NF-κB protein expression, although not to the level of the untreated control.
Figure 9. A) Differentiated C2C12 myotubes stained with primary anti-NF-κB and secondary antibody labeled with Cy5 fluorescent dye along with DAPI counterstaining. B) Area of myotube (Mean ± SEM) results of NF-κB in C2C12 myotube. .1 column shows the NF-κB stained with Cy5, A.2 shows the counterstained picture of DAPI staining, and A.3 is the merged images of both Cy5 and DAPI staining. The images of were captured in 60× magnification by in cell Analyzer 2200. Whereas shows the area of segmented myotubes. The dose groups were compared with control and LPS control groups by one-way ANOVA followed by the Dunnett t-test. Significance level were marked as *p < 0.05, **p < 0.01, ***p < 0.001 for the area of myotube of untreated control, LPS (1 µg/mL) control + PDTC (25 µM), LPS (1 µg/mL) +AA (50,75 and 100 µM) vs. LPS treated (1 µg/mL).
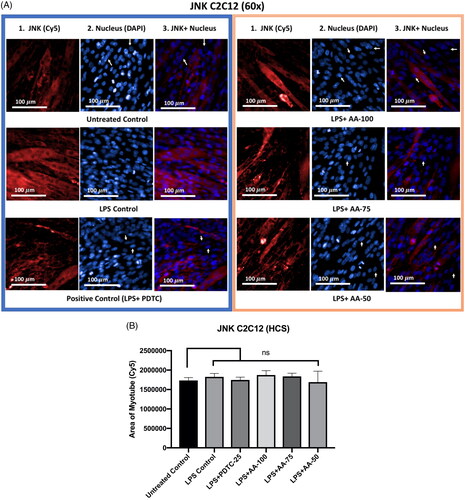
Effect of AA on the JNK expression in LPS-stimulated C2C12 myotubes
The results () showed that, despite being co-treated with LPS (1 µg/mL), there was no discernible difference between the untreated control and LPS control groups, as well as between PDTC (25 µM) and AA (50, 75, and 100 µM) treated groups. The findings suggested that LPS treatment did not affect the C2C12 myotube’s ability to express more JNK protein.
Figure 10. A) Differentiated C2C12 myotubes stained with primary anti-JNK and secondary antibody labeled with Cy5 fluorescent dye along with DAPI counterstaining. B) Area of myotube (Mean ± SEM) results of JNK in C2C12 myotube. .1 column shows the JNK stained with Cy5, A.2 shows the counterstained picture of DAPI staining, and A.3 is the merged images of both Cy5 and DAPI staining. The images of were captured in 60× magnification by in cell Analyzer 2200. Whereas shows the area of segmented myotubes. The dose groups were compared with control and LPS control groups by one-way ANOVA followed by the Dunnett t-test. Significance level were marked as *p < 0.05, **p < 0.01, ***p < 0.001 for the area of myotube of untreated control, LPS (1 µg/mL) control + PDTC (25 µM), LPS (1 µg/mL) +AA (50, 75 and 100 µM) vs. LPS treated (1 µg/mL).
Western blot analysis on H9C2 myotube
The toll-like receptor 4 (TLR4) signaling pathway is important for cardiac inflammation and other diseases.
From the results (), LPS treated groups were significantly different from all of the other groups except AA (50 µM) treated groups. Moreover, the expression of TLR4 was significantly reduced in LPS (1 µg/mL) +PDTC (25 µM) and LPS (1 µg/mL) +AA (50, 75, and 100 µM) treated groups. Additionally, there were no significant differences within untreated control, LPS (1 µg/mL) +PDTC (25 µM) and LPS (1 µg/mL) +AA (50, 75 and 100 µM). Therefore, it can be postulated that the LPS stimulation increased the expression of TLR4 markers whereas the AA and positive control PDTC reduced the upregulation significantly. The effect of AA was dependent on the concentration used as 50 µM of AA resulted in a much lower decrease of TLR4 expression which was not significantly different compared to the LPS control group.
Figure 11. Changes in TLR4, MyD88, JNK, and NF-κB protein expressions in C2C12 myotube upon stimulation of LPS (1 µg/mL). Representative Western blot analysis showed the expression levels of TLR4(a), MyD88(b), JNK(c), and NF-κB(d). the results were analyzed in densitometric analysis by ImageLab software (BioRad). the data was normalized by β-actin when the absorbance was expressed as Mean ± SD. The n = 3 for each group where three independent experiments were performed. The untreated control was considered as 1 and the rest of the groups were normalized likewise. The dose groups were compared with control and LPS control groups by one-way ANOVA followed by a Dunnett t-test. Significance level were marked as *p < 0.05, **p < 0.01, ***p < 0.001 for the area of myotube of untreated control, LPS (1 µg/mL) + PDTC (25 µM), LPS (1 µg/mL) + AA (50, 75 and 100 µM) vs. LPS treated (1 µg/mL).
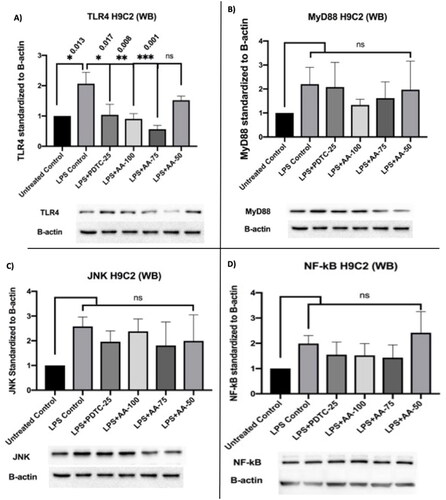
The results () showed that the MyD88 upregulation was highest in the LPS (1 µg/mL) treated group followed by the LPS (1 µg/mL) +PDTC (25 µM) treated group. Additionally, the LPS (1 µg/mL) +AA (75 and 100 µM) treated groups inhibited the LPS stimulation and it was similar to the untreated control. However, the statistical analysis did not show any significance even though the clear differences were visible. But all three independent studies showed a trend of AA-treated groups to downregulate MyD88 marker expression. Therefore, the result showed possible cardioprotective effects by AA reducing MyD88 protein upregulations in individual experiments.
The results () showed an increase in JNK protein expression in the groups LPS (1 µg/mL) +PDTC (25 µM) and LPS (1 µg/mL) +AA (50, 75 and 100 µM) treated groups whereas the AA managed to reduce the upregulation at different doses. Therefore, the results suggest the probable activity of AA to inhibit JNK protein expression in LPS stimulated H9C2 myotube.
According to the findings (), LPS treatment resulted in an upregulation of NF-κB, which was decreased in the LPS (1 µg/mL) +PDTC (25 µM), LPS (1 µg/mL) +AA (75 and 100 µM), but this difference was not statistically significant. As a result, the finding raises the possibility that AA has cardioprotective properties.
Western blot analysis on C2C12 myotube
In this study, we treated the C2C12 myotubes in vitro to investigate the effect of AA upon LPS stimulation in the western blot of protein extract.
The results for TLR4 marker expression (), LPS treated groups were significantly (*p < 0.01) different from the rest of the groups except AA (50 µM) treated groups. Additionally, the expression of TLR4 was significantly reduced in LPS (1 µg/mL) +PDTC (25 µM) and LPS (1 µg/mL) +AA (50, 75 and 100 µM) treated groups. Moreover, there were no significant differences within untreated control, LPS (1 µg/mL) +PDTC (25 µM) and LPS (1 µg/mL) +AA (50, 75 and 100 µM). Therefore, it can be postulated that the LPS stimulation increased the expression of TLR4 markers whereas the AA and positive control PDTC reduced the upregulation significantly.
Figure 12. Changes in TLR4, MyD88, p38, and NF-κB protein expressions in C2C12 myotube upon stimulation of LPS (1 µg/mL). Representative Western blot analysis showed the expression levels of TLR4(a), MyD88(b), p38(c), and NF-κB(d). the results were analyzed in densitometric analysis by ImageLab software (BioRad). the data was normalized by β-actin when the absorbance was expressed as Mean ± SD. The n = 3 for each group where three independent experiments were performed. The untreated control was considered as 1 and the rest of the groups were normalized likewise. The dose groups were compared with control and LPS control groups by one-way ANOVA followed by a Dunnett t-test. Significance level were marked as *p < 0.05, **p < 0.01, ***p < 0.001 for the area of myotube of untreated control, LPS (1 µg/mL) + PDTC (25 µM), LPS (1 µg/mL) +AA (50, 75 and 100 µM) vs. LPS treated (1 µg/mL).
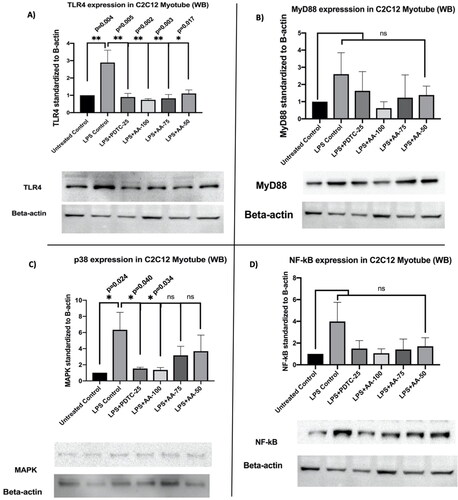
The results () for MyD88 marker expression revealed that the MyD88 upregulation was highest in the LPS (1 µg/mL) followed by LPS (1 µg/mL) +PDTC (25 µM) treated group. Moreover, the LPS (1 µg/mL) +AA (50, 75, and 100 µM) treated groups inhibited the upregulation of MyD88 upon LPS stimulation and it was very close to untreated control. However, the statistical analysis did not show any significant differences even though the mean differences between the groups were visible.
The results () showed that the LPS control was significantly different (*p < 0.05) from the rest of the untreated group which indicates the upregulation of p38 MAPK protein upon LPS stimulation. Moreover, the LPS (1 µg/mL) +PDTC (25 µM) and LPS (1 µg/mL) +AA (100 µM) showed a significant decrease in the p38 which was upregulated by LPS stimulation when they were compared with LPS (1 µg/mL) treated group. As the PDTC (25 µM) and AA (100 µM) treated groups were cotreated with LPS (1 µg/mL), the result suggests the significant cardioprotective effects of AA by downregulating the p38 MAPK expression upon treatment of LPS.
The results from NF-κB marker expression (), the NF-κB was upregulated upon LPS treatment where LPS (1 µg/mL) +PDTC (25 µM), LPS (1 µg/mL) +AA (75 and 100 µM) treated groups showed a decrease in mean differences in NF-κB upregulation even though it is not statistically significant. This might suggest a possible cardioprotective effect of AA.
Discussion
The present study investigated the effects of AA on the H9C2 myotube and C2C12 myotube upon activation of TLR4 signaling pathway markers by LPS stimulation.
Our findings provide molecular evidence that LPS stimulation increases the expression of downstream signaling markers for TLR4 that are mediated by MyD88. When combined with LPS, AA reduces the expression of TLR4 signaling markers, which is important in cardioprotection.
Previous reports suggested that AA possesses a cardioprotective effect through different mechanisms. According to Miriyala et al. (Citation2015), AA improved myocardial infarction (MI) by inhibiting the generation of ROS. The research observed decreased levels of p47(phox)-serine phosphorylation and mitochondrial dysfunction upon treatment with AA (Miriyala et al. Citation2015). In a different study, cardiac fibrosis was reversed by arjunolic acid by inhibiting non-canonical (TGF)-β signaling. TAK1 phosphorylation leads to the reduction of p38 MAPK and NF-κB p65 activation (Bansal et al. Citation2017). To evaluate vascular inflammation and cardiac dysfunction associated with type 1 diabetes, Manna and Sil (Citation2012) evaluated the molecular mechanisms by measuring NF-κB and MAPKs (p38 and ERK1/2) activations, mitochondrial membrane depolarization, cytochrome C release, caspase 3 activation, and PARP cleavage in apoptotic cell death in the diabetic cardiac tissue. Their results supported the cardioprotective effects of AA. Oxidative myocardial injury was induced by arsenic where cardiac GSH and total thiol contents decreased whereas the levels of GSSG, lipid peroxidation end products, and protein carbonyl content increased. Hazarika et al. (Citation2021) conducted a molecular docking analysis that showed arjunolic acid had a strong binding affinity with APOE4, a genetic risk factor for coronary artery disease and Alzheimer’s disease. This suggests that AA may be useful in reducing the formation of beta-amyloid plaques and atherosclerosis. Finally, Elsawy et al. (Citation2022) demonstrated the protective effects of AA against LPS-induced septic myocardial injury in rats. This study suggests that AA may be useful in protecting against sepsis-induced cardiac damage.
The toll-like receptor 4 (TLR4) signaling pathway is important for cardiac inflammation and other diseases. Skeletal muscle cell C2C12 has been extensively used to evaluate the expression of TLR4 signaling markers in different research. Moreover, the C2C12 myoblast and differentiated C2C12 myotubes showed upregulation of TLR4 upon LPS stimulation (Frost et al. Citation2004). MyD88, an adaptor receptor of the TLR4 signaling pathway has been reported to be accountable for sensitivity upon LPS stimulation. According to Kawai et al. (Citation1999), the MyD88 knockout mice have failed to show sensitivity to LPS treatment in various experiments like shock response, B cell proliferative response, or macrophage stimulated cytokine secretions. That supported the hypothesis that MyD88 is important for LPS response (Kawai et al. Citation1999). Evidence implicates that MAPKs are important markers in the TLR4 signaling pathway. It has been reported that the MAPKs mediate the transportation of different extracellular stimuli to intracellular space consequently inflammatory responses or apoptosis occur in the cell (Ranneh et al. Citation2021). Additionally, the LPS stimulation has been observed to increase p38 MAPK (Meng et al. Citation2013). As this study includes the treatment of LPS to look closely into the TLR4 signaling pathway, it is important to observe how AA treatment influences p38 MAPK marker regulation. JNKs belong to larger MAPKs which are also important markers of the TLR4/JNK/MAPK signaling pathway. MAPK plays a key role in making a bridge between membrane proteins (TLR4) and intracellular targets. JNK markers are derived from three genes, JNK1, JNK2, JNK3, with at least 10 isoforms. Researchers has revealed that JNK1 and JNK2 are present in all cells and tissues. However, the JNK3 marker could be traced in the brain (in abundance) and heart (lesser abundance) (Bode and Dong Citation2007). When analyzing the LPS-stimulated epithelial-mesenchymal transition (EMT), Li et al. (Citation2014) found that JNK/MAPK was situated in the downstream signaling of TLR4. Inflammation and the MyD88-dependent TLR4 signaling pathway depend heavily on NF-κB. According to research, NF-κB markers are activated by LPS stimulation, which promotes the growth of cancer or inflammation (Ikebe et al. Citation2009; Sharifi-Rad et al. Citation2017). Therefore, in order to comprehend the TLR4 signaling pathway, our study examined the expression of the specific target markers, TLR4, MyD88, JNK, p38, and NF-κB.
According to the findings ( and ), it is evident that MyD88, NK-κB, p38, and JNK regulators were significantly upregulated in response to LPS stimulation. Additionally, the expression of the protein was downregulated considerably in the groups treated with PDTC (25 µM) and AA (50, 75, and 100 µM). TLR4 expression, however, significantly increased in response to LPS stimulation and significantly decreased in response to AA (75 and 100 µM) treatment. When exposed to AA, MyD88 (AA-50, 75, and 100 µM), NF-κB (AA-75, and 100 µM), and JNK (AA-50, 75, and 100 µM) all exhibited a tendency of downregulation. Therefore, it can be said that when administered to the H9C2 myotube, AA has a cardioprotective effect on the MyD88-dependent TLR4 signaling pathway.
Figure 13. The diagram shows the effects of AA on the LPS-induced MyD88-dependent TLR4 signaling pathway in H9C2 myotubes (HCS and WB). the overall effect of AA on the LPS-stimulated MyD88-dependent The TLR4 signaling pathway is shown in the figure. The diagram shows how TLR4-downstream signaling was monitored in H2C9 in response to LPS stimulation using both HCS and WB analysis. HCS was applied to MyD88, NF-κB, p38, and JNK (immunocytochemistry). NF-κB, JNK, TLR4, MyD88, and NF-κB were all exposed to WB (Immunoblotting). Starting from the left, the groups are LPS (1 µg/mL), LPS(1 µg/mL) + PDTC (25 µM), LPS (1 µg/mL) +AA (50, 75 and 100 µM).
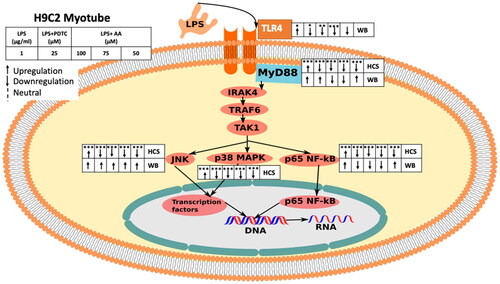
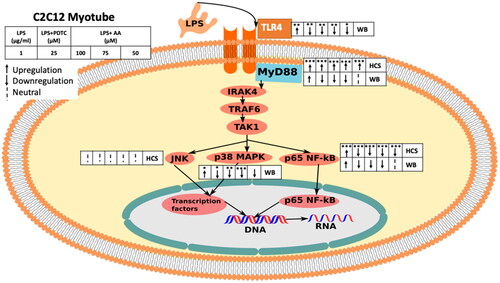
Figure 14. The figure depicts the overall effect of AA on C2C12 myotubes in the LPS-stimulated MyD88dependent TLR4 signaling pathway. The diagram shows how TLR4-downstream signaling was monitored in C2C12 in response to LPS stimulation using both HCS and WB analysis. HCS was applied to MyD88, NF-κB, and JNK (immunocytochemistry). TLR4, MyD88, NF-κB, and p38 were all exposed to WB (Immunoblotting). Starting from the left, the groups are LPS (1 µg/mL), LPS(1 µg/mL) + PDTC (25 µM), LPS (1 µg/mL) + AA (50, 75 and 100 µM).
Although LPS is known to cause cell damage and inflammatory reactions, the precise relationship between this cell damage and the onset of cardiovascular disease is still up for debate and requires more investigation. LPS, a component of the outer membrane of Gram-negative bacteria, is a potent activator of the immune system through its interaction with toll-like receptor 4 (TLR4) (Kawai et al. Citation1999; Park et al. Citation2009). It is well-established that LPS triggers the production of pro-inflammatory cytokines, such as tumor necrosis factor-alpha (TNF-α), interleukin-1 beta (IL-1β), and interleukin-6 (IL-6), leading to the initiation of an immune response (Takeda and Akira Citation2005). Moreover, LPS has been implicated in various pathological conditions, including septic shock and acute lung injury (Wu et al. Citation2004; Beiter et al. Citation2018).
Several studies have suggested a potential association between LPS and cardiovascular disease. In particular, TLR4, the primary receptor for LPS, has been implicated in cardiac dysfunction and myocardial injury in animal models (Chong et al. Citation2004; Oyama et al. Citation2004). Additionally, LPS has been shown to induce oxidative stress, apoptosis, and inflammatory responses in cardiac cells (Frost et al. Citation2004; Ghosh et al. Citation2011; Li et al. Citation2014). These findings indicate that LPS can indeed cause cell damage and trigger inflammatory pathways in cardiac tissues.
However, it is important to keep in mind that there are few in vivo studies and clinical data examining the precise connection between LPS-induced cell damage and the onset of cardiovascular disease in humans. Most of the evidence supporting the role of LPS in cardiovascular disease comes from animal models or in vitro studies using cell lines. There are limitations to using H9C2 cells, which are generated from rat embryonic cardiomyocytes, as a model for investigating cardiovascular illness because they do not accurately mimic the intricate interconnections and physiological conditions found in the human heart. Therefore, to clarify the specific involvement of LPS-induced cell damage in the onset and progression of cardiovascular disease, more study is required, including clinical trials and investigations utilizing pertinent animal models.
Conclusions
The current study suggests potential cardioprotective effects of AA and it could be a potential therapeutic agent for cardiovascular dysfunction. However, the focus of our study was on cellular experimentation, further in vivo and clinical studies would be necessary to develop AA as a new therapeutic agent for cardiovascular diseases.
Authors’ contributions
MMH conceived, designed, and performed all the experiments; analyzed the data, and wrote the paper. NAAN and WKL mentored the High Content Screening imaging and Western blot at Institute of Pharmaceutical and Nutraceuticals (IPharm). The study was carried out under the supervision of AA and PM. All authors revised and approved the final version of the manuscript.
Acknowledgements
The laboratory work (ICC and WB) was carried out at Institute of Pharmaceutical and Nutraceutical (IPharm), Penang, Malaysia.
Data availability
Data is available upon reasonable request from the corresponding authors.
Correction Statement
This article has been corrected with minor changes. These changes do not impact the academic content of the article.
Additional information
Funding
References
- Al-Gayyar MM, Al Youssef A, Sherif IO, Shams ME, Abbas A. 2014. Protective effects of arjunolic acid against cardiac toxicity induced by oral sodium nitrite: effects on cytokine balance and apoptosis. Life Sci. 111(1–2):18–26. doi: 10.1016/j.lfs.2014.07.002.
- Bakar MHA, Tan JS. 2017. Improvement of mitochondrial function by celastrol in palmitate treated C2C12 myotubes via activation of PI3K-AKT signaling pathway. Biomed Pharmacother. 93:903–912. doi: 10.1016/j.biopha.2017.07.021.
- Bansal T, Chatterjee E, Singh J, Ray A, Kundu B, Thankamani V, Sengupta S, Sarkar S. 2017. Arjunolic acid, a peroxisome proliferator-activated receptor agonist, regresses cardiac fibrosis by inhibiting non-canonical TGF-β signaling. J Biol Chem. 292(40):16440–16462. doi: 10.1074/jbc.M117.788299.
- Beiter T, Hudemann J, Burgstahler C, Nieß AM, Munz B. 2018. Effects of extracellular orotic acid on acute contraction-induced adaptation patterns in C2C12 cells. Mol Cell Biochem. 448(1-2):251–263. doi: 10.1007/s11010-018-3330-z.
- Bode AM, Dong Z. 2007. The functional contrariety of JNK. Mol Carcinog. 46(8):591–598. doi: 10.1002/mc.20348.
- Caso JR, Pradillo JM, Hurtado O, Lorenzo P, Moro MA, Lizasoain I. 2007. Toll-like receptor 4 is involved in brain damage and inflammation after experimental stroke. Circulation. 115(12):1599–1608. doi: 10.1161/CIRCULATIONAHA.106.603431.
- Chao W. 2009. Toll-like receptor signaling: a critical modulator of cell survival and ischemic injury in the heart. Am J Physiol Heart Circ Physiol. 296(1):H1–12. doi: 10.1152/ajpheart.00995.2008.
- Chong AJ, Shimamoto A, Hampton CR, Takayama H, Spring DJ, Rothnie CL, Yada M, Pohlman TH, Verrier ED. 2004. Toll-like receptor 4 mediates ischemia/reperfusion injury of the heart. J Thorac Cardiovasc Surg. 128(2):170–179. doi: 10.1016/j.jtcvs.2003.11.036.
- Elsawy H, Almalki M, Elmenshawy O, Abdel-Moneim A. 2022. In vivo evaluation of the protective effects of arjunolic acid against lipopolysaccharide-induced septic myocardial injury. Peer J. 10:12986.
- Fan X, Zhang Y, Dong H, Wang B, Ji H, Liu X. 2015. Trilobatin attenuates the LPS-mediated inflammatory response by suppressing the NF-κB signaling pathway. Food Chem. 166:609–615. doi: 10.1016/j.foodchem.2014.06.022.
- Frantz S, Kobzik L, Kim YD, Fukazawa R, Medzhitov R, Lee RT, Kelly RA. 1999. Toll4 (TLR4) expression in cardiac myocytes in normal and failing myocardium. J Clin Invest. 104(3):271–280. doi: 10.1172/JCI6709.
- Frost RA, Nystrom GJ, Lang CH. 2004. Lipopolysaccharide stimulates nitric oxide synthase-2 expression in murine skeletal muscle and C2C12 myoblasts via toll-like receptor-4 and C-Jun nh2-terminal kinase pathways. Am J Physiol Cell Physiol. 287(6):C1605–C1615. doi: 10.1152/ajpcell.00010.2004.
- Ghosh J, Das J, Manna P, Sil PC. 2011. The protective role of arjunolic acid against doxorubicin induced intracellular ROS dependent JNK-p38 and p53-mediated cardiac apoptosis. Biomaterials. 32(21):4857–4866. doi: 10.1016/j.biomaterials.2011.03.048.
- Gilde AJ, der Lee KAV, Willemsen PH, Chinetti G, der Leij FRV, der Vusse GJV, Staels B, Bilsen MV. 2003. Peroxisome proliferator-activated receptor (PPAR) alpha and PPARbeta/delta, but not PPARgamma, modulate the expression of genes involved in cardiac lipid metabolism. Circ Res. 92(5):518–524. doi: 10.1161/01.RES.0000060700.55247.7C.
- Hazarika L, Sen S, Doshi J. 2021. Molecular docking analysis of arjunolic acid from Terminalia arjuna with a coronary artery disease target APOE4. Bioinformation. 17(11):949–958. doi: 10.6026/97320630017949.
- Hemalatha T, Pulavendran S, Balachandran C, Manohar BM, Puvanakrishnan R. 2010. Arjunolic acid: a novel phytomedicine with multifunctional therapeutic applications. Indian J Exp Biol. 48:238–247.
- Ikebe M, Kitaura Y, Nakamura M, Tanaka H, Yamasaki A, Nagai S, Wada J, Yanai K, Koga K, Sato N, et al. 2009. Lipopolysaccharide (LPS) increases the invasive ability of pancreatic cancer cells through the TRL4/MyD88 signaling pathway. J Surg Oncol. 100(8):725–731. doi: 10.1002/jso.21392.
- Kalyanavenkataraman S, Nanjan P, Banerji A, Nair BG, Kumar GB. 2016. Discovery of arjunolic acid as a novel non-zinc binding carbonic anhydrase II inhibitor. Bioorg Chem. 66:72–79. doi: 10.1016/j.bioorg.2016.03.009.
- Kawai T, Adachi O, Ogawa T, Takeda K, Akira S. 1999. Unresponsiveness of myd88-deficient mice to endotoxin. Immunity. 11(1):115–122. doi: 10.1016/s1074-7613(00)80086-2.
- Knuefermann P, Sakata Y, Baker JS, Huang CH, Sekiguchi K, Hardarson HS, Takeuchi O, Akira S, Vallejo JG. 2004. Toll-like receptor 2 mediates staphylococcus aureus-induced myocardial dysfunction and cytokine production in the heart. Circulation. 110(24):3693–3698. doi: 10.1161/01.CIR.0000143081.13042.04.
- Li H, Li Y, Liu D, Liu J. 2014. LPS promotes epithelial–mesenchymal transition and activation of TKR4/JNK signaling. Tumour Biol. 35(10):10429–10435. doi: 10.1007/s13277-014-2347-5.
- Manna P, Sil PC. 2012. Impaired redox signaling and mitochondrial uncoupling contributes vascular inflammation and cardiac dysfunction in type 1 diabetes: protective role of arjunolic acid. Biochimie. 94(3):786–797. doi: 10.1016/j.biochi.2011.11.010.
- Manna P, Sinha M, Sil PC. 2008. Arsenic-induced oxidative myocardial injury: protective role of arjunolic acid. Arch Toxicol. 82(3):137–149. doi: 10.1007/s00204-007-0272-8.
- Meng Z, Yan C, Deng Q, Gao DF, Niu XL. 2013. Curcumin inhibits LPS-induced inflammation in rat vascular smooth muscle cells in vitro via ROS-relative TLR4-MAPK/NF-κB pathways. Acta Pharmacol Sin. 34(7):901–911. doi: 10.1038/aps.2013.24.
- Miriyala S, Chandra M, Maxey B, Day A, Clair DKS, Panchatcharam M. 2015. Arjunolic acid ameliorates reactive oxygen species via inhibition of p47phox-serine phosphorylation and mitochondrial dysfunction. Int J Biochem Cell Biol. 68:70–77. doi: 10.1016/j.biocel.2015.08.015.
- Mishra S, Chatterjee S. 2014. Lactosylceramide promotes hypertrophy through ROS generation and activation of ERK1/2 in cardiomyocytes. Glycobiology. 24(6):518–531. doi: 10.1093/glycob/cwu020.
- Morabito C, Rovetta F, Bizzarri M, Mazzoleni G, Fanò G, Mariggiò MA. 2010. Modulation of redox status and calcium handling by extremely low frequency electromagnetic fields in C2C12 muscle cells: a real-time, single-cell approach. Free Radic Biol Med. 48(4):579–589. doi: 10.1016/j.freeradbiomed.2009.12.005.
- Oyama JI, Blais C, Liu X, Pu M, Kobzik L, Kelly RA, Bourcier T. 2004. Reduced myocardial ischemia-reperfusion injury in toll-like receptor 4-deficient mice. Circulation. 109(6):784–789. doi: 10.1161/01.CIR.0000112575.66565.84.
- Park BS, Song DH, Kim HM, Choi BS, Lee H, Lee JO. 2009. The structural basis of lipopolysaccharide recognition by the TLR4–MD-2 complex. Nature. 458(7242):1191–1195. doi: 10.1038/nature07830.
- Proszynski TJ, Gingras J, Valdez G, Krzewski K, Sanes JR. 2009. Podosomes are present in a postsynaptic apparatus and participate in its maturation. Proc Natl Acad Sci USA. 106(43):18373–18378. doi: 10.1073/pnas.0910391106.
- Rahiman SSF, Morgan M, Gray P, Shaw PN, Cabot PJ. 2017. Inhibitory effects of dynorphin 3-14 on the lipopolysaccharide-induced toll-like receptor 4 signalling pathway. Peptides. 90:48–54. doi: 10.1016/j.peptides.2017.02.004.
- Ranneh Y, Akim AM, Hamid HA, Khazaai H, Fadel A, Zakaria ZA, Albujja M, Bakar MFA. 2021. Honey and its nutritional and anti-inflammatory value. BMC Complement Med Ther. 21(1):30. doi: 10.1186/s12906-020-03170-5.
- Seneviratne AN, Sivagurunathan B, Monaco C. 2012. Toll-like receptors and macrophage activation in atherosclerosis. Clin Chim Acta. 413(1–2):3–14. doi: 10.1016/j.cca.2011.08.021.
- Sharifi-Rad M, Varoni EM, Salehi B, Sharifi-Rad J, Matthews KR, Ayatollahi SA, Kobarfard F, Ibrahim SA, Mnayer D, Zakaria ZA, et al. 2017. Plants of the genus Zingiber as a source of bioactive phytochemicals: from tradition to pharmacy. Molecules. 22(12):2145. doi: 10.3390/molecules22122145.
- Shen XD, Ke B, Zhai Y, Gao F, Busuttil RW, Cheng G, Kupiec-Weglinski JW. 2005. Toll-like receptor and heme oxygenase-1 signaling in hepatic ischemia/reperfusion injury. Am J Transplant. 5(8):1793–1800. doi: 10.1111/j.1600-6143.2005.00932.x.
- Shimamoto A, Chong AJ, Yada M, Shomura S, Takayama H, Fleisig AJ, Agnew ML, Hampton CR, Rothnie CL, Spring DJ, et al. 2006. Inhibition of toll-like receptor 4 with eritoran attenuates myocardial ischemia-reperfusion injury. Circulation. 114(1_supplement):270. doi: 10.1161/CIRCULATIONAHA.105.000901.
- Sumitra M, Manikandan P, Kumar DA, Arutselvan N, Balakrishna K, Manohar BM, Puvanakrishnan R. 2001. Experimental myocardial necrosis in rats: role of arjunolic acid on platelet aggregation, coagulation and antioxidant status. Mol Cell Biochem. 224(1–2):135–142. doi: 10.1023/a:1011927812753.
- Takeda K, Akira S. 2005. Toll-like receptors in innate immunity. Int Immunol. 17(1):1–14. doi: 10.1093/intimm/dxh186.
- Wu HS, Zhang JX, Wang L, Tian Y, Wang H, Rotstein O. 2004. Toll-like receptor 4 involvement in hepatic ischemia/reperfusion injury in mice. Hepatobiliary Pancreat Dis Int. 3:250–253.