
 ?Mathematical formulae have been encoded as MathML and are displayed in this HTML version using MathJax in order to improve their display. Uncheck the box to turn MathJax off. This feature requires Javascript. Click on a formula to zoom.
ABSTRACT
This study examines the impact of tax incentives for long-term savings on total private savings using data for Latvia contained in HFCS 2014 and 2017. The survey shows that contributions to tax-favoured savings plans are not associated with lower consumer spending and therefore do not contribute to an increase in private savings. Instead, these savings are achieved by lowering other, non-tax-favoured savings. This substitution effect on non-tax-favoured savings remains statistically significant even when excluding households with very low consumption levels and the ones whose reference person is relatively young/old and with a low level of education. However, the observed effect is not significant at the very bottom of the distribution of non-tax-favoured savings. The results of this study raise concerns that without additional measures to encourage retirement savings, particularly in the lower segment of the savings distribution, income inequality among retirees will continue rising.
1. Introduction
The world’s population is ageing, putting pressure on old-age pension systems. In response to this challenge, governments are raising the retirement age and reforming pension systems to make pension benefits less generous. This enhances the role of personal wealth as a source of income after retirement. To stimulate the accumulation of wealth through private savings, governments introduce tax incentives for investment in certain long-term savings plans, such as private pension funds or life insurance schemes. Contributions to such plans are excluded from the person’s annual income base, which is subject to personal income tax.
From a theoretical point of view, the effect of these so-called tax-favoured savings on total private savings is ambiguous. On the one hand, a higher net return on savings (associated with tax relief) encourages economic agents to save more (the substitution effect), as the price of current consumption rises and individuals substitute future consumption for current consumption (i.e. save more). On the other hand, it makes a given wealth accumulation target easier to achieve, weakening the need to save (the income effect). The empirical evidence on the net private savings effect of tax-favoured vehicles is still inconclusive and is mostly limited to US literature, with only a small number of articles available about a few large European countries, such as the UK, Italy, Spain and Germany.
In this study, we examine empirical evidence from Latvia. Unlike many other European Union countries, the Latvian pension system is built on three pillars, one of which is the voluntary tax-favoured private pension scheme. Therefore, the present study expands the literature on (the degree of) substitution between tax-favoured and non-tax-favoured savings by examining the EU country that has undergone a transition to a market economy and has been at the forefront of introducing private pension schemes in the EU.
Tax-advantaged savings schemes are only successful in raising total private savings if individuals cut back on consumer spending rather than simply changing their savings strategy and shifting resources from one account to another. To uncover their impact, ideally, one needs to be able to observe what households would do in the absence of such schemes, which is obviously impossible. Instead, researchers look for a suitable identification strategy, whereby alternative strategies often lead to opposite conclusions even when applied to the same country.
This study is based on the Household Finance and Consumption Survey (HFCS), which provides detailed information on real and financial assets, liabilities, income, contributions to tax-favoured plans and consumption of households, as well as personal characteristics of the reference person of a household. We estimate the impact of tax-favoured savings on non-tax-favoured savings (and consumer spending) using the longitudinal subset of the households that were surveyed in two different years, i.e. in 2014 and 2017. This approach allows to account for heterogenous time invariant unobservable factors that may influence households’ saving decisions. To our knowledge, due to data limitations it is very rare in the empirical literature to follow the same households in two or more survey waves (without the need to construct the treatment group) to infer the savings effect.
The results obtained in the paper suggest that contributions to tax-favoured plans are not associated with lower consumer spending, which is a condition for increasing total private savings. Instead, such contributions come from a reshuffle of savings that would have been made anyway. Moreover, households seem to spend the entire tax refund they obtain. This effect on other modes of savings appears to be robust when excluding households with very low consumption levels as well as dropping households whose reference person is relatively young/old and with low educational attainment. However, the reshuffling effect does not appear to be statistically significant at the very bottom of non-tax-favoured saving distribution.
Although there is no evidence that advantageous tax treatment leads to higher savings rates, such tax incentives are not necessarily a waste of budgetary resources. Different savings vehicles are used for different purposes. Resources invested in tax-favoured plans are locked and cannot be used until the end of the contract, which helps to safeguard some wealth for a more secure retirement.Footnote1 Furthermore, contributions to a private pension or life insurance plans that are invested in bonds and stocks and accompanied by tax relief generate a higher net return to savings and raise total net wealth, even if they merely replace other savings. The latter effect should be particularly pronounced in Latvia, where the most significant financial asset class owned by households is depositedFootnote2 with no or a very low return.
To stimulate the accumulation of retirement wealth, a few proposals have been made in the literature. For example, automatic enrolment with the possibility for a saver to opt-out has been shown by Choi et al. (Citation2004), Beshears et al. (Citation2008) and Clark and Pelletier (Citation2022) among others to be an effective tool for generating private savings, particularly among young and low-income individuals (Beshears et al., Citation2016; Madrian & Shea, Citation2001) and those in the lower tail of the savings distribution (Choi et al., Citation2004), where according to the results of our study there is less evidence of reshuffling.
It should be noted, that the findings of this paper should be treated with great caution, due to the possible presence of time-varying unobservables and related identification issues. Unfortunately, we have not found a way to overcome this potential methodological problem.
The rest of the paper is organized as follows. Section 2 provides a review of the relevant literature. Section 3 discusses the background of the study, lays down empirical strategy and describes the dataset used. Section 4 explains the results of the empirical examination. Finally, Section 5 concludes.
2. Literature review
In this Section, we provide a brief review of the previous literature, examining whether tax reliefs for certain types of savings raise the total level of private savings and wealth or merely induce individuals to reshuffle their saving strategy and substitute from other savings types. Answering this question is not an easy task due to data limitations and econometric problems associated with the identification of the effect.
It was shown previously, mostly in the vast US literature examining the effect of tax incentives for IRA and 401(k), that employing an alternative research design (aimed to control for saver heterogeneity) may lead to contradicting results. Most of these studies relied upon: (a) between-group comparisons of saving behaviour of eligible vs. non-eligible households, assuming that the 401(k) eligibility is exogenous, (b) within-group changes by following the same household over time or by constructing the treatment group of households with similar saving propensities and (c) the cohort analysis by comparing saving behaviour of individuals of the same age at different points of time. Thus, Venti and Wise (Citation1986, Citation1990), Poterba et al. (Citation1995, Citation1996a) and Gelber (Citation2011) among others uncovered a positive effect of targeted saving incentives on private savings, implying that tax-favoured contributions represent new savings and are not accompanied by a concomitant reduction in other savings. In contrast, Engen et al. (Citation1994), Gale and Scholz (Citation1994) and Attanasio and De Leire (Citation1994) among others reported virtually no effect on total savings, reflecting savings reshuffling strategy. These and other studies of the voluminous literature on IRA and 401(k) effects were thoroughly reviewed in Poterba et al. (Citation1996b) and Bernheim (Citation2002).
In contrast to the large branch of the US literature, evidence using data from other (a few European) countries is scarce. Changes to the US tax code of the 1980s (including the Tax Reform Act of 1986) represented a large experimental base for flourishing literature, as they allowed for several identification strategies. Tax advantages for certain savings types in Europe are a more recent phenomenon. Also, data availability has not been satisfactory until recently. Notwithstanding, the existing scarce literature that uses data for European countries finds a very limited effect of tax incentives on savings.
Corneo et al. (Citation2009, Citation2010) shed some light on the effectiveness of the saving incentive programme (the Riester scheme) in Germany. They conduct a comprehensive treatment analysis and present a negligible effect of the programme on household savings. Participation in the Riester scheme merely induces private households to reshuffle their saving strategy and reallocate some of the savings (that would have been implemented anyway) to the tax-favoured savings vehicle.
On the contrary, the empirical evidence from the British Household Survey has been mixed. Guariglia and Markose (Citation2000) argue that tax-favoured and non-tax-favoured savings are conducted for different reasons, i.e. with, respectively, retirement vs. precautionary motives in mind. Therefore, they do not offset each other completely, and a tax advantage scheme is able to generate new savings. Similarly, Rossi (Citation2009) reports the absence of the crowding-out effect of the contributions to personal pension plans on other savings of British households. Moreover, Rossi (Citation2009) shows that private pension funds tend to enhance other forms of savings. Attanasio et al. (Citation2004) disagrees and claims that the extent of new savings in the UK generated by tax-favoured programmes has been rather limited.
There are also a few studies that investigate the effect of supplementary pension provision in Spain. The study by Anton et al. (Citation2014), which is close to our paper methodologically, infers the impact of tax incentives on household and national savings using a longitudinal survey in Spain and the fixed effects technique. It suggests that after time invariant unobservable factors are controlled for, contributions to private pension funds do not appear to raise national savings, but are at least effective in increasing private savings. However, Anton et al. (Citation2014) do not examine the role of heterogeneity on the impact of tax incentives. Ayuso et al. (Citation2019), in their most recent paper on this issue, also use Spanish data and employ an alternative instrumental variable approach to solving the omitted variable problem. They suggest that there is a large heterogeneity in the response of households to tax incentives, as saving behaviour depends on the age group. A somewhat larger displacement effect is found for the group of individuals that is closer to the retirement age. Individuals in that age group may treat supplementary pension schemes and other savings forms as close substitutes because for them retirement motives correspond to the precautionary ones and the illiquidity concern is far less important. Finally, for Italy, Paiella and Tiseno (Citation2014) found a substantial substitution of non-tax-favoured wealth for tax-favoured pension assets. They also showed that the effect on non-tax-favoured savings flows is negligible.
3. Background of the paper, data and empirical strategy
3.1. Overview of Latvia’s old-age pension system and tax-favoured savings plans
Latvia’s old-age pension system in its current form was established in 1996 when the fragmented defined benefit (DB) schemes were abolished. The current system consists of three pillars. The 1st pillar is the pay as you go (PAYG) scheme, which in comparison to most other countries, calculates pensions on the basis of mandatory notional defined contributions (NDC).Footnote3 The 2nd pillar is the funded pension scheme that is mandatory only to those individuals who were born after 1 July 1971. Other persons can choose whether to contribute to this scheme or to participate in the 1st pillar only. The 3rd pillar is an optional and entirely voluntary fully funded scheme, where individuals can choose a private pension fund to invest in. Participation in private pension funds is partly established by employers contributing to an open or closed private pension fund on behalf of their employees.
The demographic dependency ratioFootnote4 in Latvia is expected to double by 2060, reaching one of the worst expected indicators in the EU (European Commission, Citation2021). Pension benefits, paid out from the 1st and 2nd pillars, will become less generous in the future. If currently, new pensioners receive on average 55% of the average salary at retirement, then by 2070 the replacement provided by the first two pillars is projected to decrease markedly (European Commission, Citation2021). Adverse demographic developments will put Latvia’s pensioners in a much worse position as compared to pensioners in the rest of the EU (European Commission, Citation2021).
The role of personal savings in sustaining a higher rate of replacement has recently been acknowledged by economic experts in Latvia. For example, contributing at least 5% of a salary to a private pension fund may increase the replacement rate by more than 10 percentage points.Footnote5
Despite the low and declining replacement rate the Latvian old-age pension system can generate, making long-term savings is not popular in Latvia. Over the past 10 years, the gross household savings rate has been fluctuating in the range between −3% and 7% of the disposable income, far below the EU average of 12% (EurostatFootnote6).Footnote7 Moreover, among savers, only a relatively small part of savings is induced by the retirement motive (Fadejeva et al., Citation2018).Footnote8 To foster private savings, the Latvian government introduced tax incentives aimed at promoting voluntary participation in private pension schemes and life insurance plans.Footnote9 Contributions to private pension funds and life insurance plans, up to the limit of 10% of annual income, are deductible from the personal income tax base.Footnote10
Tax incentives for contributions to private pension funds have only partly been successful so far. The number of contributors has constantly been growing however it reached only about 1/3 of economically active persons in 2019. Moreover, many contributors are not active (in 2016, only around half of the members were active, OECD, Citation2018). Also, the accumulation of funds has so far been quite modest: in roughly two decades after the system was introduced, by the end-2019, private pension funds accumulated assets of around 1.8% of GDP, accounting for close to 1500 EUR per participant. Latvian voluntary private pension plans are now in the middle of the range compared to other voluntary arrangements in OECD and EU countries in terms of tax advantage for individuals (OECD, Citation2018).
3.2. Data and descriptive statistics
The study is based on the information obtained from HFCS of Latvian households carried out in 2014 and 2017.Footnote11 HFCS is a unique survey conducted by central banks of the Eurosystem aimed at measuring households’ net wealth and income.Footnote12 It contains detailed information on real and financial assets (such as deposits, holdings of stocks and bonds), liabilities, income and consumption of households. Information on liabilities (mortgage and non-mortgage debt and payments), all types of income and real estate in Latvia is cross-checked using data from administrative sources.
Information regarding voluntary participation in and contributions towards tax-favoured savings plans (private pension and life insurance schemes) is also part of the survey. In 2017, 27.4% participated in tax-favoured plans and only 12.2% of households, i.e. only half of all households with open accounts, had non-zero contributions.Footnote13 Participation in voluntary private pension and life insurance plans is higher for households with higher income and households in which the reference person is in the middle age group (35–44 years) or has received tertiary education (see ). HFCS does not record participation of any household whose income falls below the 20th percentile of income distributions, while participation in the second quantile is registered for only 1.5% of households.
Table 1. Participation and mean of tax-favoured savings contribution in 2014 and 2017 (conditional on participation and non-zero contributions).
The median share of net income that households contributed to the plans was 2% in 2014 and 3.6% in 2017. Households in the lower income quantiles and with a reference person over 55 years of age contribute, on average, a higher share of their net income towards tax-favoured savings. For households in the lower income quantiles, this phenomenon can be partly explained by the small number of observations. In addition to this, the share of households that are part of the shadow economy has been estimated by Benkovskis and Fadejeva (Citation2022) to be higher in low-income quantiles, resulting in a higher contribution rate.Footnote14 For persons that are at least 55 years of age, financial penalty is applied if pension contributions are withdrawn over quite a short two-year period, raising the net return to savings in private pension funds. Also, individuals closer to the retirement age tend to report savings for old age as the main reason for saving (see Fadejeva et al., Citation2020), which implies allocating a larger share of current income to tax-favoured plans. As shown by Ayuso et al. (Citation2019), in Spain, older individuals may consider supplementary pension schemes and other forms of savings as close substitutes, since for them, retirement and precautionary motives correspond, and the problem of illiquidity is much less important.
3.3. Methodology
We benefit from the fact that the dataset includes a number of householdsFootnote15 interviewed in both HFCS waves, i.e. in 2014 and 2017. Therefore, we can construct a longitudinal subset of the dataset and, in contrast to most previous studies, we estimate the relationship between contributions to tax-favoured and non-tax-favoured savings plans in first differences. This allows accounting for the presence of time-invariant unobserved factors that may simultaneously affect savings in both tax-favoured and non-tax-favoured plans. The equation we estimate in this paper exhibits the following specification:
(1)
(1) where
denotes non-tax-favoured savings of the household i,
are contributions to tax-favoured plans (private pension plans and/or life insurance schemes),
is net of tax monthly income,
and
stand for mortgage and non-mortgage debt payments respectively,
denotes total real assets,
is a household’s indebtedness level (total outstanding balance of a household’s liabilities).
symbol stands for a change in the corresponding indicator between 2014 and 2017. Alongside differenced monetary determinants of changes in non-tax-favoured savings, k different personal characteristics of the household’s reference person j
are included. These characteristics are: labour status, gender, age, education, the number of household members, region, income expectations, risk assessment and an indicator characterizing the household’s behaviour in the case of windfall revenue (see the description of the included variables in in Appendix).
We also estimate Equation (2) by substituting consumption expenditure for non-tax-favoured savings
.
and
are related, so that a rise in
with all other spending components being equal, may be accomplished by either reducing
or
:
(2)
(2) When estimating both Equations (1) and (2), we drop the observations whose dependent variable is below the 1st percentile or above the 99th percentile to get rid of the outliers in consumption and savings.
Running two regressions allows examining both the savings and consumption behaviour of contributors vs. non-contributors. In the first specification, under the null hypothesis the effect on non-tax-favoured savings is not statistically different from zero, hence tax incentives represent new savings and contributors do not finance their contributions from non-tax-favoured savings that would otherwise have been done. In the second regression, the null hypothesis states that tax incentives have no effect on consumption expenditure and merely induce reshuffling of the savings strategy. The outcome may be somewhere in between if households partly offset non-tax-favoured savings, while sacrificing part of the current consumption. To check the validity of estimates, these two regression types can be seen as a mirror image of one another. It is possible that the data on non-tax-favoured savings contain a measurement error that may reduce the power of the coefficient test when non-tax-favoured savings are used as a dependent variable.
For both regressions, we also employ quantile estimation to examine whether the effect varies across the distribution of the dependent variable. For example, households with a very low level of savings may not be able to offset contributions by reducing other types of savings. Therefore, the estimation results may differ at the different points of the distribution.
The estimations presented below are based on the data from the subset of 668 Latvian households that participated in both waves of HFCS. Among the households that made a non-zero contribution in 2014, around 42% continued doing so in 2017. In turn, in 2017, around 60% of households that made a non-zero contribution did not participate in HFCS 2014.
We admit that the estimation strategy we employ in this paper exhibits a few caveats.
First, the identification of the causal effect is associated with controlling time-varying observable characteristics and time-invariant unobservable factors. Since our approach is unable to address the possible presence of unobserved time-varying variables (such as possible shifts in the preferences for savings or changes in risk perception), which are not independent of the dependent variable and contributions to tax-favoured schemes, its’ presence could lead to inconsistent estimators. To address it, we should ideally employ an instrumental variable approach. However, finding an instrument with a strong effect on contributions to tax-favoured vehicles without affecting savings using other schemes is difficult (see Anton et al. (Citation2014) for discussion). There have been no changes to eligibility or any other reforms of the tax legislation over the period of 2014–2017 that would contribute to identifying the effect. We believe though that such shifts in preferences are not very likely to occur over a relatively short period of time and do not undermine the results of our study. Second, it is possible that those who start contributing to tax-favoured plans reshuffle their accrued liquid assets followed by changes to saving/consumption patterns at a later stage. To test for this, we would need to employ data on stocks of financial assets and run a regression with non-pension assets (and/or changes in their value) being a dependent variable. However, administrative data on financial assets (except for private pension and life insurance) was not available in 2014 and 2017 HFCS surveys for Latvia.Footnote16 Information on financial asset stock (deposits, bonds, equity) is self-reported by households and thus is heavily underreported.Footnote17 Against this background, we decided to refrain from including changes in financial assets in the set of explanatory variables.
4. Empirical findings
4.1. Baseline estimation results
As explained above, we focus on the households present in both waves of HFCS, which allows us to employ the longitudinal dataset and estimate Equations (1) and (2) using household-specific differences in savings and consumption between 2014 and 2017. Thus, we filter out time-invariant unobserved characteristics, such as tastes for savings, attitude towards risk, etc. Still, however, we are unable to control for the possibility that the same person/household may experience a shift in savings taste (or any other unobservable variable that simultaneously affects both savings types) over time. We find it though, unlikely that such a shift could have occurred over the three-year horizon, which in our case is a time period with no significant macroeconomic shocks that could potentially shift the saving paradigm of Latvian households. Although we are not able to test whether unobserved tastes for savings changed, we can examine the developments in savings rates across the two groups of households: those that did not contribute in 2014 and started contributing in 2017 (i.e. new contributors) and those that did not contribute in both years. We find that the median decline in savings rates in both groups was 0.089 and 0.084, respectively, implying that at least the observable taste for savings has evolved similarly.
reports the estimation results of the key coefficient that relates changes in contributions to tax-favoured savings schemes and (a) changes in non-tax-favoured savings (Equation (1)), (b) changes in consumption expenditure (Equation (2)).Footnote18 The estimates indicate that households with higher contributions to tax-favoured plans exhibit smaller non-tax-favoured savings, i.e. such contributions are made at the expense of other types of savings. Thus, in the most detailed specification, a household with a change in monthly contributions to tax-favoured plans of 100 EUR lowers other, non-tax-favoured savings by 92.8 EUR. Moreover, one cannot reject the null hypothesis that the coefficient of interest is equal to −1, thus a complete displacement between the two types of savings cannot be ruled out. Consistently with this finding, we also document that consumption does not statistically differ between households with high vs. low/no contributions to tax-favoured schemes. The coefficient of interest is close to zero and is not statistically significant.
Table 2. Estimates of the displacement effect on non-tax-favoured savings and consumption.
In addition to these estimates, the following exercise was performed. The contribution variable was replaced by the binary dummy (equal to 1 if a non-participant household switches to participation over the three-year period). The impact of this binary variable on non-tax-favoured savings turns negative and is statistically significant. The results indicate that the difference in non-tax-favoured savings of contributors vs. non-contributors is 64.88 EUR. This amount is close to the median level of contributions (see ).
Overall, the results suggest that extra savings in private pension funds and life insurance schemes do not result in new savings for a household, which is merely reshuffling its saving strategy, while the tax refund provided by government may be used to increase consumer spending.
4.2. Quantile estimation results
Next, we employ quantile regressions to investigate whether the displacement effect uncovered above varies across the distribution of the dependent variable, i.e. change in non-tax-favoured savings and consumption. reports the estimation results. It shows that for non-tax-favoured savings, the change in contribution to tax-favoured plans, the estimated coefficients are all negative and mostly statistically significant, irrespective of whether these estimates are obtained at the top, bottom or median of non-tax-favoured savings distribution. However, the magnitude of the estimated offset seems to be somewhat larger and exhibits a higher level of significance (especially for the first-difference estimation) in the third quartile (75th percentile) and the median as compared to the first quartile (25th percentile).
Table 3. Estimates across the distribution of the dependent variable (at the 25th, 75th and 75th percentile).
This result is illustrated in and demonstrates the heterogeneity of the displacement effect across the deciles of the distribution. In fact, the effect does not appear statistically significant at the very bottom of the distribution, as standard errors of the estimates are particularly high for the very low levels of non-tax-favoured savings.
Figure 1. Estimate of the displacement effect on non-tax-favoured savings across its distribution.
Note: The black line is the displacement coefficient, the grey shaded area is the 95% confidence interval.
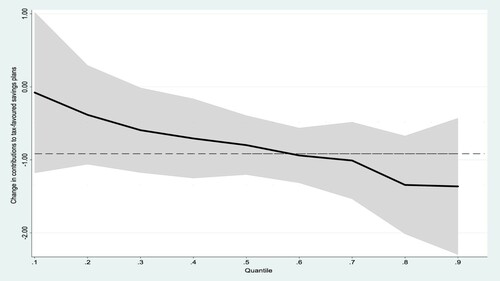
This finding implies that the displacement effect is more pronounced for households with abundant resources for reshuffling. It does not automatically follow, however, that those with very small savings generate new savings when they start contributing. This result may also stem from the small sample size we deal with in our analysis and a low number of contributing households with non-tax-favoured savings at the very bottom of the distribution.
4.3. Robustness exercise
Finally, we test the robustness of our baseline estimates.
The estimates presented above may suffer from heterogeneity, as monetary variables included in Equations (1) and (2) are represented in levels (EUR), thus assigning larger weight to households with higher income. To test the robustness of the baseline estimates, we perform the above analysis by relating non-tax-favoured savings to contributions to tax-favoured savings plans in terms of ratios to net income. The results reported in the first column of imply that contributions to tax-favoured savings plans indeed crowd out non-tax-favoured savings.
Table 4. Robustness exercise estimates (for the dependent variable – change in non-tax-favoured savings)Table Footnotea.
Contributions to tax-favoured savings plans generate new private savings only if households concomitantly reduce their consumption. While this is a possibility for those whose consumption is relatively high, there is a group of households that barely makes ends meet. Reducing the already very low level of consumption spending is not feasible. Their inclusion in the sample may bias the results towards obtaining the full reshuffling. Therefore, we re-estimate our model for a smaller group of households, whose consumption is above the median level of the generalized disposable income.Footnote19 Although the number of observations falls by one third, there are no qualitative changes to the estimation results (see the second column of ).
Finally, we narrow down our sample further by dropping households with the reference person aged below 35 or above 64 years of age as well as the reference person whose level of education is basic. As mentioned above, saving motives of young individuals can markedly differ from those applied by people who are close to retirement. Similarly, persons with a low level of obtained education may be unaware of income replacement risks after retirement. Thus, these groups of individuals are potentially more likely to be subject to displacement. However, the estimation results presented in the third column of provide unambiguous evidence in favour of reshuffling in this much smaller sample of households, thus confirming our baseline results.
5. Conclusions
As the dependency ratio grows and income replacement guaranteed by the old-age pension system is projected to decline, the importance of personal wealth is rising. The government provides several tax incentive schemes to encourage individuals to save more. To assess the effectiveness of such schemes, it is important to know whether households’ tax-favoured savings contribute to total private savings or they are mainly realized through reallocation of funds between different savings schemes.
This paper extends the relatively sparse literature on the displacement effect of tax-favoured savings in Europe by examining the case of Latvia, the country that has been at the forefront of implementing the three-pillar old-age pension system with a voluntary private pension scheme as one of these pillars. The study uses data from HFCS carried out in 2014 and 2017 and employs a longitudinal (first-difference) regression method. It shows that contributions to tax-favoured savings plans are not associated with a statistically significant decrease in consumer spending (or an increase in total private savings), but are mostly related to savings rearrangement, which is consistent with earlier findings by Anton et al. (Citation2014) for Spain, Paiella and Tiseno (Citation2014) for Italy and Attanasio et al. (Citation2004) for the UK. The results of quantileregressions indicate some evidence that the displacement effect is more pronounced for households with abundant resources for substitution. The results of this paper should, however, be treated with caution, due to the possible presence of time-varying unobservables and related identification concerns.
Despite the uncovered displacement effect, the tax relief provided by the government cannot be considered worthless. First, it induces a longer saving horizon by locking individual contributions. Second, it contributes to higher net wealth by increasing net return to savings (which otherwise would be made in the form of non-interest-bearing deposit accounts).
In Latvia, participation in tax-favoured savings plans is relatively new and, therefore, still quite low. Moreover, it is almost non-existing in the two lower income quantile households. Participation is mainly associated with the households in the top income quantile and the ones whose reference person has higher education or is young. This raises concerns that without some form of automatic enrolment in private pension funds (with the option of opt-out), targeted financial literacy studies or a safety cushion in the form of minimum retirement income, inequality between households with different income groups could grow in the future.
Acknowledgements
The authors are grateful for valuable comments by Konstantīns Beņkovskis and Kārlis Vilerts (both – the Bank of Latvia) and participants of the Household Finance and Consumption Network research seminar and participants at the Baltic Economic Association 3rd conference.
Disclosure statement
No potential conflict of interest was reported by the author(s).
Additional information
Notes on contributors
Ludmila Fadejeva
Ludmila Fadejeva is a principal economist at the Bank of Latvia (Latvijas Banka). Her main research field is analysis of monetary policy effects on income and wealth inequality, prices and labour with the focus on microdata. She represents Latvijas Banka at the Price Setting Microdata Analysis (PRISMA) and Household Finance and Consumption (HFCS) ESCB Working Groups. During the last several years she closely cooperated with colleagues of ECB and NCBs on research projects including such topics as monetary policy transmission, wealth inequality, price and wage setting mechanisms. In 2013 she was visiting researcher in the Oesterreichische Nationalbank and since autumn of 2022 will participate in ECB price microdata team via Schuman and System-wide Virtual Teams programme. She holds Master degree in Specialized Economic Analysis awarded jointly with Universitat Pompeu Fabra and Universitat Autònoma de Barcelon. She is also a PhD candidate in Economics and Management from the University of Latvia.
Olegs Tkacevs
Olegs Tkacevs is a principal economist at the Bank of Latvia. His main research activities include fiscal and structural policies, competitiveness and trade. In the past he represented the Bank of Latvia in the ESCB Working Group of Public Finance. During the great recession period he closely cooperated with counterparts from the IMF and EC on fiscal consolidation strategy and recommendations for structural reforms. In 2012 and 2013, he was an NCB expert at the Directorate General Economics of the European Central Bank. He holds a PhD in Economics from the University of Latvia.
Notes
1 In some countries (such as Estonia and the UK), there is some flexibility with respect to the withdrawal of private pension funds.
2 97% of financial assets apart from private pension and life insurance plans.
3 Notional accounts exist only in five OECD countries: Latvia, Italy, Norway, Poland and Sweden (OECD Citation2019).
4 Dependency ratio is the ratio of people older than 64 to the working-age population.
5 https://www.makroekonomika.lv/ekspertu-saruna-pensiju-sistema-latvija-vai-bumba-ar-laika-degli#tab=3.
7 Bicevska et al. (Citation2009) provides a comprehensive econometric analysis of economic, social and demographic factors that hold back household savings in Latvia.
8 In 2014, less than 40% of savers mentioned old-age provision as one of the most important reasons to save.
9 Total budgetary costs of these two schemes in terms of foregone personal income tax revenue amounted to approximately 28.2 million EUR (0.1% of GDP) in 2017.
10 Before 2018, the contribution limit of 10% for tax-favoured contributions was applied separately for these two savings tools, i.e. an individual could claim a tax refund from contributions to both schemes, each up to 10% of annual earnings (i.e. 20% joint contribution limit). In 2018, tax treatment was made less beneficial, particularly for high-income earners, such that currently a 10% limit is imposed on the total amount of contributions with an annual cap of 4000 EUR.
11 For details on HFCS results in Latvia see Fadejeva et al. (Citation2018) and Fadejeva et al. (Citation2020).
12 For details on HFCS network see https://www.ecb.europa.eu/pub/economic-research/research-networks/html/researcher_hfcn.en.html.
13 This is broadly in line with the OECD (Citation2018) observation that only about half of Latvian private pension plan participants in Latvia are active contributors.
14 However, there is some evidence that tax underreporting could be substantially underestimated at the top of income distribution (Guyton et al., Citation2021).
15 We refer to them as panel households in the text.
16 In HFCS 2020, administrative data on financial assets will be available for Latvia.
17 Bernheim (Citation2002) pointed out that it is a well-known fact that asset values are measured with an error.
18 Detailed results of these regressions (i.e. those documented in ) for the sake of brevity are not documented in the paper and are available upon request.
19 It divides households into two equal parts: those earning less than the median household income and those earning more.
References
- Anton, J. I., Muñoz de Bustillo, R., & Fernández-Macías, E. (2014). Supplementary private pensions and saving: Evidence from Spain. Journal of Pension Economics and Finance, 13(4), 367–388. https://doi.org/10.1017/S1474747214000158
- Attanasio, O. P., Banks, J., & Wakefield, M. (2004). Effectiveness of tax incentives to boost (retirement) saving: Theoretical motivation and empirical evidence (IFS Working Papers No. 04/33).
- Attanasio, O. P., & De Leire, T. C. (1994). IRAs and household saving revisited: Some new evidence (National Bureau of Economic Research Working Paper No. 4900).
- Ayuso, J., Jimeno, J. F., & Villanueva, E. (2019). The effects of the introduction of tax incentives on retirement saving. SERIEs, 10(3–4), 211–249. https://doi.org/10.1007/s13209-019-0195-7
- Benkovskis, K., & Fadejeva, L. (2022). Chasing the shadow: The evaluation of unreported wage payments in Latvia (Bank of Latvia Working Paper Series No. 1/2022).
- Bernheim, B. D. (2002). Taxation and saving. In A. J. Auerbach & M. Feldstein (Eds.), Handbook of public economics (1st ed., Vol. 3, chapter 18, pp. 1173–1249). Elsevier.
- Beshears, J., Choi, J. J., Laibson, D., & Madrian, B. C. (2008). The importance of default options for retirement savings outcomes: Evidence from the United States. In S. J. Kay & T. Sinha (Eds.), Lessons from pension reform in the Americas (pp. 59–87). Oxford University Press.
- Beshears, J., Choi, J. J., Laibson, D., Madrian, B. C., & Wang, S. (2016). Who is easier to nudge? (Harvard University Working Paper).
- Bicevska, A., Kalnberzina, K., & Melihovs, A. (2009). Savings in Latvia (Bank of Latvia Discussion Paper Series No. 1/2009).
- Choi, J. J., Laibson, D., Madrian, B. C., & Metrick, A. (2004). For better or for worse: Default effects and 401(k) savings behaviour. In D. A. Wise (Ed.), Perspectives on the economics of aging (pp. 81–121). University of Chicago Press.
- Clark, R. L., & Pelletier, D. (2022). Impact of defaults on participation in state supplemental retirement savings plans. Journal of Pension Economics and Finance, 21(1), 22–37. https://doi.org/10.1017/S1474747220000347
- Corneo, G., Keese, M., & Schröder, C. (2009). The Riester scheme and private savings: An empirical analysis based on the German SOEP. Schmollers Jahrbuch, 129(2), 321–332. https://doi.org/10.3790/schm.129.2.321
- Corneo, G., Keese, M., & Schröder, C. (2010). The effect of saving subsidies on household saving: Evidence from Germany (Ruhr Economic Papers No. 170).
- Engen, E. M., Gale, W. G., & Scholz, J. K. (1994). Do saving incentives work? Brookings Papers on Economic Activity, 1994(1), 85–180. https://doi.org/10.2307/2534631
- European Commission. (2021). The 2021 ageing report: Economic and budgetary projections for the EU member states (2016–2070) (Institutional Paper No. 148).
- Fadejeva, L., Lapins, J., & Zorgenfreija, L. (2018). Results of the household finance and consumption survey in Latvia (Bank of Latvia Discussion Paper Series No. 1/2018).
- Fadejeva, L., Migale, A., & Zondaks, M. (2020). Household finance and consumption survey 2017 in Latvia (Bank of Latvia Discussion Paper Series No. 1/2020).
- Gale, W. G., & Scholz, J. K. (1994). IRAs and household saving. American Economic Review, 84(5), 1233–1260.
- Gelber, A. (2011). How do 401(k)s affect saving? Evidence from changes in 401(k) eligibility. American Economic Journal: Economic Policy, 3(4), 103–122. https://doi.org/10.1257/pol.3.4.103
- Guariglia, A., & Markose, S. (2000). Voluntary contributions to personal pension plans: Evidence from the British household panel survey. Fiscal Studies, 21(4), 469–488. https://doi.org/10.1111/j.1475-5890.2000.tb00032.x
- Guyton, J., Langetieg, P., Reck, D., Risch, M., & Zucman, G. (2021). Tax evasion at the top of the income distribution: Theory and evidence (NBER Working Paper No. 28542).
- Madrian, B. C., & Shea, D. F. (2001). The power of suggestion: Inertia in 401(k) participation and savings behavior. The Quarterly Journal of Economics, 116(4), 1149–1187. https://doi.org/10.1162/003355301753265543
- OECD. (2018). OECD reviews of pension systems: Latvia.
- OECD. (2019). Pensions at a glance: OECD and G20 indicators.
- Paiella, M., & Tiseno, A. (2014). Evaluating the impact on saving of tax-favored retirement plans. Journal of Pension Economics and Finance, 13(1), 62–87. https://doi.org/10.1017/S147474721300019X
- Poterba, J. M., Venti, S. F., & Wise, D. A. (1995). Do 401(k) contributions crowd out other personal saving? Journal of Public Economics, 58(1), 1–32. https://doi.org/10.1016/0047-2727(94)01462-W
- Poterba, J. M., Venti, S. F., & Wise, D. A. (1996a). How retirement saving programs increase saving. Journal of Economic Perspectives, 10(4), 91–112. https://doi.org/10.1257/jep.10.4.91
- Poterba, J. M., Venti, S. F., & Wise, D. A. (1996b). Personal retirement saving programs and asset accumulation: Reconciling the evidence (NBER Working Paper No. 5599).
- Rossi, M. (2009). Examining the interaction between saving and contributions to personal pension plans: Evidence from the BHPS. Oxford Bulletin of Economics and Statistics, 71(2), 253–271. https://doi.org/10.1111/j.1468-0084.2008.00525.x
- Venti, S. F., & Wise, D. A. (1986). Tax-deferred accounts, constrained choice and estimation of individual saving. The Review of Economic Studies, 53(4), 579–601. https://doi.org/10.2307/2297607
- Venti, S. F., & Wise, D. A. (1990). Have IRAs increased U.S. savings? Evidence from consumer expenditure surveys. The Quarterly Journal of Economics, 105(3), 661–698. https://doi.org/10.2307/2937894
Appendix
Table A1. Variables used in the study.