
ABSTRACT
Understanding how the gambling industry generates revenue is of paramount importance. Questions about whether higher volumes of expenditure are concentrated among a small proportion of gamblers, and how this varies by problematic gambling status, underpin policy debate about consumer protection. Analyzing data from two timepoints (T0; T2) from a British longitudinal study of regular sports bettors, we explored both for total (gross) spend and gross spend on individual activities: (a) the concentration of self-reported spend on gambling among individuals; and (b) the extent to which spending was disproportionately generated by those with elevated Problem Gambling Severity Index (PGSI) scores. Results showed that gross gambling expenditure was unequal (GINI-coefficient >0.70 for most activities). At both timepoints, those with a PGSI score of 3+ had an elevated share of spending: at T2, 14.1% of PGSI 3+ gamblers accounted for 43.5% of gross gambling spend. There were differences by activity: lotteries displayed less reliance on those with a PGSI score of 3+ whereas this group contributed over 80% of gross spend on online casinos. Policy attention should focus on reframing the underlying economic model on which some gambling activities are predicated, creating more equal patterns of consumption and less reliance on those harmed.
Introduction
Sulkenen et al argued that it was a fundamental truth that ‘a very small part of the population, and of those who gamble, account for a very large share of the total spending’ (Sulkunen et al., Citation2019). The UK Government agrees, highlighting this as a priority area for which evidence is needed to inform their review of the Gambling Act 2005 (Department of Digital Culture Media and Sport, Citation2020). Prior to this, the British regulator, the Gambling Commission, attempted to obtain information directly from gambling companies in their Annual Assurance Statements, asking companies to provide estimates of the proportion of their revenues generated from those experiencing gambling problems. These data are treated as business confidential and thus industry responses on this matter are not in the public domain.
These questions are critical to understand the gambling industry’s underlying business model and policies to reduce gambling harms. They are associated with two inter-related considerations: (a) the extent to which the gambling industry generates substantial profits from a minority of individuals; and (b) the extent to which substantial monies are generated from those most harmed by gambling. Many sectors of the gambling industry (except lotteries) have comparatively high proportions of their player base experiencing gambling harms (Conolly et al., Citation2018). There also exists a large body of evidence that these people also tend to spend more on gambling (Productivity Commission, Citation1999; Smith & Wynne, Citation2002; Volberg & Bernhard, Citation2006; Volberg & Stuefen, Citation1994). This translates into this player group contributing disproportionately larger amounts of money to specific gambling sectors and thus being central to the business model of some gambling operators. In a British context, a few studies have attempted to quantify this. In a submission to the House of Lord’s Select Committee on the Social and Economic Impact of the Gambling Industry, Landman Economics estimated that 20% of online gambling profits were generated by those experiencing gambling problems, with a further 17% of profits generated by those experiencing moderate risk gambling according to the Problem Gambling Severity Index (PGSI; Landman Economics, Citation2020). This built on research by Orford et al. (Citation2012), which estimated that those experiencing gambling problems accounted for 20–30% of expenditure for activities like Fixed Odd Betting Terminals and betting on dog races, but only 1–2% of expenditure for activities like the National Lottery. Fiedler et al. (Citation2019) cautioned that these estimates may be conservative as the expenditure data capped the maximum amount spent in a typical month at £501 for most activities. This effectively removed excessive spending from the analysis, a main driver of these patterns.
Internationally, several studies have provided evidence that gambling revenues are disproportionately generated by a minority of individuals and by those experiencing gambling harms. Looking at the proportion of revenue from those harmed, estimates vary across jurisdictions ranging from 15% in the U.S. (Gerstein et al., Citation1999) to 65% in Puerto Rico (Volberg & Vales, Citation1998). More recent studies found results between 32% and 35% for Canada (Williams & Wood, Citation2004, Citation2007) and 40% for Australia (Productivity Commission, Citation1999). Fiedler et al. (Citation2019), demonstrated that, among survey participants from France, Germany, and Quebec, gambling spend in each jurisdiction was highly unequal among consumers, with high expenditure concentrated in a minority of people. They also showed that gambling spend was 7–11 times higher among those experiencing problem gambling than those not experiencing this. These figures relate to total spending across all forms of gambling, yet the same patterns were evident when looking at individual gambling formats. This was especially noted for activities like casino table games or electronic gaming machines, where expenditure tended to be highly concentrated among a minority of players, with those experiencing moderate risk or problem gambling contributing a greater proportion of revenue. Fiedler et al. (Citation2019) also introduced the idea of measuring the GINI-coefficient as a means of measuring the unequal concentration of gambling expenditure among consumers and showed that this was highly correlated with the revenue share from problem gamblers. As Fiedler et al argued, addictive products tend to have many users with comparatively low levels of consumption and a few substantial consumers, resulting in a relatively high GINI-coefficient (Fiedler et al., Citation2019). They further illustrated this point arguing that, depending on the specific distribution, the Pareto Principle (where 20% of consumers account for 80% of activity) generally yields a GINI-coefficient of 0.6 (Fiedler et al., Citation2019).
Gambling is increasingly viewed by some as being part of the ‘unhealthy commodities industry’ (Knai et al., Citation2021). Yet the term ‘gambling industry’ belies a wide range of gambling products and practices, which are increasingly recognized to have different levels of risk associated with them for those who gamble (Mazar et al., Citation2020). It is important, therefore, to assess the underlying assumptions about how each sector generates profits specifically. Building on the work of Fiedler et al. (Citation2019), this exploratory study aims to replicate their methodological approach using data collected in 2020 from a cohort of regular (at least monthly) sports bettors in Great Britain. This population also gambled on a range of other activities beyond sports betting (Wardle et al., Citation2021), providing a large sample of regular gamblers through which to assess:
the concentration of gambling spend on different forms of activity among regular gamblers; and
the extent to which those experiencing moderate risk or problem gambling account for a greater proportion of spend on each form of gambling.
Methods
Design
Data come from two waves of a longitudinal study established to assess the impact of the COVID-19 pandemic upon gambling behaviors (Hunt et al., Citation2020). Participants were initially sampled in 2020 from YouGov’s non-probability panel of over one million people living in the UK. They were eligible to be included if: they had gambled at least monthly on sports (including horse and dog races) in the year prior to the pandemic (identified by data held by YouGov as part of their sample management); were aged 18 or over; and had not taken part in any other YouGov study on gambling in the past year. At both waves, participants were contacted by YouGov via direct e-mail invitations. Participants received YouGov points (equivalent of £0.50, redeemable for vouchers) as remuneration for their time. Up to three reminders were sent. Data were collected from participants in June/July 2020, November/December 2020 and April 2021 (further details are available elsewhere; the CHERRIES checklist, which aims to improve the reporting standards for internet-based surveys, is available here https://osf.io/9cy37/).
Data collection and sample size
The wave 1 questionnaire asked people to report their gambling behaviors in the three months (December 2019-February 2020) prior to the pandemic (hereafter referred to as T0) and to report the same behaviors during the initial COVID-19 lockdown (mid-March to mid-June 2020, T1, when sporting events and in-person gambling outlets were closed down). T2 data were collected in November 2020 which asked about gambling behaviors between August and October 2020. Because this study is concerned with gambling expenditure across a range of products, the analysis uses information collected for the three months prior to the onset of the pandemic (T0, when there were no restrictions in place on gambling) and T2, when all forms of land-based gambling had re-opened and live sports had returned (House of Commons, Citation2021). In short, we use data from two time periods, T0 and T2, when there were limited restrictions on gambling availability. We have included analysis of both T0 and T2 to: (a) assess the consistency of patterns; and (b) increase the validity of analysis by using data before and after the pandemic.
Time taken to complete the questionnaire was assessed and those who completed the survey in less than one standard deviation of the mean were removed from the sample, being judged to have completed the survey too quickly to have given due consideration to their answers. At T0, 89 participants and at T2, 68 participants were removed for this reason. At T0, the final sample size for analysis was 3865 participants; at T2 it was 3195 (representing a retention rate between surveys of 83%). At T0, all participants had gambled on at least one of the activities listed. At T2, 215 participants had not gambled at all in the prior three months and were removed from the current analysis. Thus, the total base size for analysis for T2 was 2980 participants.
Validity of non-probability sample
The YouGov panel uses non-probability methods with attendant issues for generalizability (Pickering & Blaszczynski, Citation2021). As Pickering and Blaszczynski (Citation2021) note, there is concern that estimates of problem gambling generated from Internet surveys are considerably inflated when compared with estimates from probability methods. To test this, we compared key estimates from this study with estimates generated by pooled data from Health Survey for England (HSE) 2015, 2016 and 2018. HSE is a random-probability survey of adults aged 16 and over living in private households in England. Key estimates, such as the proportion of people experiencing moderate risk or problem gambling among all regular (monthly) gamblers, among online sports bettors and among online casino gamblers, were similar to those generated by the HSE (13.1% sports bettors vs 10.8% HSE, p = 0.50; online sports betting; 14.6% vs 13.7%, p = 0.48; online casino; 34.7% vs 28.5% p = 0.07). For other activities, moderate risk and problem gambling estimates among those gambling on other activities were higher in this sample than the HSE series. The greatest difference was for tables games in a casino (38.7% vs 24.4%, p < 0.001) and thus we do not focus on results for these activities. That said, the patterns were broadly the same, with rates of a PGSI score of 3+ being lowest among those playing the lottery (12.5% vs 9.7%, p < 0.05) and highest among those playing online casino products or table games in a casino (38.7% vs 24.2%, p = 0.07). (See Supplementary Tables 1a & 1b). This gives confidence that our study presents similar estimates of moderate risk and problem gambling among regular (monthly) gamblers overall and among regular online sports bettors and online casino gamblers to probability methods.
In addition, comparative analysis shows that non-probability closed online panels (like the YouGov panel) tend to produce similar conclusions to probability methods when focusing on multivariate analyses and when exploring the relationship between variables, which is the primary aim of this study (Callegaro et al., Citation2014). This gives increased reassurance around our approach, which we detail below.
Measures
Gambling behaviors before, and during, the initial COVID-19 pandemic
Participants were asked to report engagement in 23 gambling activities, covering all main subsectors (e.g. sports betting, casino and poker, gaming, lotteries etc) and formats (e.g. land-based, online etc). The full measures are available elsewhere: https://osf.io/f4zgw/.
For each gambling activity reported, we captured spend in the last three months (open coded and estimated to nearest £GBP). This question used the wording developed for the British Gambling Prevalence Survey 2010, drawing on recommendations by Wood and Williams (Citation2007) and asked: ‘In the three months (prior to the initial COVID-19 lockdown, that is December 2019 to February 2020/since August 2020 and October 2020), how much money did you spend on X. Please think about all the money you spent on X between (December 2019 and February 2020/August 2020 and October 2020)’. This question was developed by Wardle et al for the British Gambling Prevalence Survey 2010 (Wardle et al., Citation2011) and subsequently analyzed by Orford et al. (Citation2012). Both Wardle et al. (Citation2011) and Orford et al. (Citation2012) acknowledged difficulties with capturing data on gambling spend within surveys, particularly the assumption that ‘spend’ measures stakes minus winnings. Cognitive testing carried out for the BGPS 2010 revealed this question to be a good reflection of monetary outlay on gambling (participants were probed on this and asked to explain how they arrived at their estimate of spend, and what they did and did not include to assess how they categorized ‘spend’; Wardle et al., Citation2011). Therefore, these data are more likely to capture the gross amount of money wagered on gambling, not necessarily a consumer’s net position (though for some the two will be coterminous). In the analysis that follows, therefore, the term ‘spend’ should be interpreted to mean the participant’s gross rather than net expenditure.
For each participant, these data were summed across all activities reported to calculate the total amount each person reported spending on all forms of gambling. These totals were then summed across all participants to generate the total gambling spend reported from everyone in the sample. This process was repeated for all individual activities to generate: (a) the total amount spent on each activity by an individual participant; and (b) the total amount spent on each activity across all participants in total.
Because participants were asked to report expenditure to the nearest GBP, some entered £0, indicating expenditure of less than £0.50 pence (p). This was recoded to £0.25p, as the category mid-point. For most activities, less than 20 participants reported this. The highest number of participants reporting expenditure of GBP £0 was for betting in a bookmakers on sports at T0 (n = 87/932). For each activity, the reported range of expenditure was examined. For most activities, the maximum expenditure reported in the prior three months was less than GBP £5,000 (see Supplementary Table 2 for maximum values and inter-quartile ranges). Exceptions to this were betting online on horses/dogs, betting on online casinos, betting online on sports and betting on tables games in a casino. Online horses, online sports and online casino each had someone who reported spending more than GBP £50,000 on this activity in the past three months. These were not the same participant (which might indicate one person entering erroneous answers). The gambling industry is known to generate high levels of expenditure from certain individuals. For example, analysis of industry records by Wardle et al. (Citation2014) showed that one individual spent over GBP £13,000 on a single-session of play on a single day on Fixed Odd Betting Terminals. For this reason, these ‘outliers’ are likely to be a valid part of the spend distribution and thus the decision was made not to exclude them. However, to check the impact on results for online horses and online casino (where the maximum value reported was GBP £100,000 or more) results were replicated removing these cases, see Supplementary Table 3. In both cases, this moderates the GINI-coefficient and proportion of excess expenditure attributable to those with a PGSI category of three or more. While the substantive patterns for those with a PGSI score of 3+ remained broadly similar, online horse/dog betting at T2 was the exception, illustrating the impact of inclusion of a few ‘high rollers’ within the sample.
Problem gambling
In each wave of data collection, participants completed the 9-item Problem Gambling Severity Index (PGSI; Ferris & Wynne, Citation2001) scored on a four-point scale (0 = Never to 3 = Almost always). PGSI scores range from 0 to 27, where 0 indicates non-problem gambling or non-gambling; 1–2 low-risk gambling; 3–7 moderate risk gambling; a score of 8 or more is indicative of problem gambling. In both waves, the composite score had strong internal consistency (Wave 1: Cronbach’s α = 0.91; Wave 2: Cronbach’s α = 0.95). Although PGSI usually uses a 12-month reference period, we purposively used a three-month reference period to match the initial COVID-19 pandemic timeframe and reported involvement in gambling activities during this three-month lockdown period. Previous research has shown the utility of using a shorter PGSI timeframe when assessing the impact of interventions (Abbott et al., Citation2012; Kushnir et al., Citation2018). Following Fiedler et al. (Citation2019), and to account for small base sizes, moderate risk and problem gambling status were combined in this analysis. According to Ferris and Wynne, moderate risk gambling represents those who may ‘be at risk if they are heavily involved in gambling’ though they may or may not have experienced adverse consequences from gambling (Ferris & Wynne, Citation2001). By combining moderate risk and problem gambling categories, we generate a group who are either likely to be at risk (given their PGSI scores and known status as very regular gamblers) and those known to be experiencing adverse consequence from their gambling.
Analysis
For each wave, the following procedure was followed: First, descriptive statistics were generated for the total sample () and those who participated in each individual activity (), showing frequencies by PGSI category and mean and median expenditure by PGSI category.
Table 1. Gross spend on gambling, by PGSI status.
Table 2. Gross spend on gambling activities, by PGSI category and wave
GINI-coefficients were then produced to examine: (a) the concentration of total gambling spend on all activities; (b) the concentration of total gambling spend on all activities by PGSI category; and (c) the concentration of gambling spend among those taking part in specific gambling activities, by PGSI category. The GINI-coefficient is a measure of statistical dispersion first developed to look at income inequality. It has been applied to a variety of contexts, including gambling expenditure (Fiedler et al., Citation2019). The equation is normalized between 0 (perfect equality) and 1 (perfect inequality). In the current context, the closer the GINI-coefficient is to 1, the greater the concentration of gambling spend among fewer individuals.
Finally, the share of gambling spend by participants within each PGSI category was calculated for the sample overall and for those taking part in individual activities. Following Fiedler et al. (Citation2019), excess gross expenditure was calculated by subtracting each group’s population prevalence from their share of gross expenditure. A negative figure indicates that participants in this category account for less gross expenditure than their population distribution; a positive figure indicates that people in this category account for greater gross expenditure than their population distribution.
Activities were only included in the analysis where cell sizes for PGSI categories were greater than 20. For this reason, the following activities were excluded from analysis: online betting on esports; online betting on virtual races/sports; betting in a bookmakers on esports; betting in a bookmakers on virtual races/sports; playing bingo in a bingo club; playing fixed odd betting terminals in a bookmakers; and, betting on ‘other’ things at a bookmakers.
For both surveys, a cross-sectional survey weight was provided to match the profile of participants to the profile of all known regular sports bettors within the YouGov panel with respect to age, sex, region and the betting profile (whether bet online, in-person or both). As this analysis focuses on comparisons within the dataset (for example, comparison of reported expenditure on gambling by PGSI category), rather than providing prevalence/population estimates, the weights have not been applied. We have, however, recreated applying the weights (see Supplementary Table 4) and note this does not alter our interpretation of any of the results. Linear regression was used to examine associations between PGSI category and mean expenditure with problem gambling status as the independent variable and gambling expenditure as the dependent variable. All analysis was conducted in Stata v15.
Approval for the study was granted by the University of Stirling General University Ethics Panel (ref: GUEP (19 20) 930).
Results
Overall gross gambling expenditure
At T0, 13.1% of the sample were categorized as experiencing moderate risk or problem gambling. Mean gross spend was higher among those with a PGSI score of 3 or more (£1050.10; SD: £9096) than those with a PGSI score less than this (e.g. PGSI score 0: £271.50; SD: £2380). Median gross spend was 2.5 times higher among those with a PGSI score of 3 or more (£180) than those with a PGSI score of 0 (£70). GINI-coefficients indicated substantial inequality in the total volume of gross gambling spend across all participants (0.84) and among individuals with different PGSI scores (>0.70 for all groups). Similar patterns were observed at T2, with similar frequencies of PGSI category to T0 (14.1%), mean expenditure being highest among those with a PGSI score of 3 or more (£1198.18; SD: £8381.44) and median spend being nearly four times higher among those with a PGSI score of 3 or more than a PGSI score of 0 (median spend PGSI score 3 or more: £227.50; median spend PGSI score 0: £60). GINI-coefficients also indicated substantial inequality in the total volume of gross expenditure (0.82) (see, ).
At T0 share of gross spending among those with a PGSI score of 3 or more was 15.4 percentage points (pp) higher than their population frequency of 13.1%. At T2, a similar pattern was apparent, with the 14.1% of participants with a PGSI score 3 or more accounting for 43.5% of the gross expenditure across all gambling activities, representing excess gross expenditure of +29.4 pp.
Gross gambling expenditure by activity type
In both waves, inequality in gross gambling spend was evident across all activities undertaken by regular sports bettors. At T0, GINI-coefficients ranged from 0.60 for lotteries to 0.96 for online casinos. Only four (lotteries, scratchcards, football pools and online bingo) of the 15 activities analyzed had a GINI-coefficient of less than 0.70. The same pattern was observed at T2, with coefficients ranging from 0.55 for lotteries to 0.96 for playing tables games at a casino and with only five activities (lotteries, scratchcards, football pools, online poker, and private betting) having a GINI-coefficient of less than 0.70.
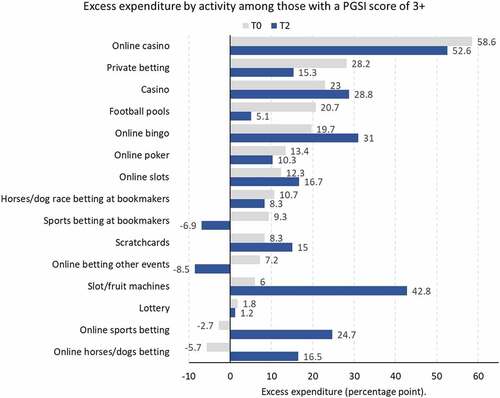
At both timepoints, lotteries were the least dependent on revenues from moderate risk or problem gamblers, with excess gross expenditure from this group of +1.8 percentage points (pp) at T0 and +1.2 pp at T2. Gross expenditure on online casino games, by contrast, was dominated by spend generated from those with a PGSI score of 3 or more: at T0 excess gross spend attributable to this group was +58.6 pp and +52.6 pp at T2. For most other activities, a predominance of expenditure by those with elevated PGSI scores was evident, but to a lesser degree ().
There were some notable variations in excess gross expenditure on individual forms of gambling between T0 and T2 (see ). This was evident for online betting on horse/dog races and online sports betting. At T0, excess gross expenditure on these activities was concentrated among those with a PGSI score of 1 or 2. At T2, excess gross expenditure was concentrated among those with a PGSI score of 3 or more. For example, at T2, among online sports bettors, excess gross expenditure among those with a PGSI score of 3 or more was + 27.4 pp. Playing slot/fruit machines also showed differences between T0 and T2. At T0, 39.8% of gross expenditure was attributable to 33.7% of those with a PGSI score of 3 or more (excess gross expenditure of +6.1 pp). By T2, 83.9% of gross expenditure was attributable to 41.4% of those with PGSI score of 3 or more (excess gross expenditure of +42.5 pp).
Figure 1. Excess expenditure by activity among those with a PGSI score of 3+: T0 and T2.
Discussion
Our analyses show that, among a sample of regular sports bettors, gross gambling expenditure was highly unequal between participants and highly concentrated among a few gamblers. At both timepoints, the GINI-coefficient for total gross spend on all forms of gambling was in excess of 0.80 suggesting that a small number of participants account for a large volumes of gambling spend in the UK market. This is similar to patterns found by Fiedler et al. (Citation2019) when looking at data from France, Germany and Canada. This pattern was reflected across almost all forms of gambling activity – with most activities at both timepoints having a GINI-coefficient of 0.70 or more. Among regular sports bettors, the activity with the most highly concentrated gross gambling expenditure was online casino, with coefficients in excess of 0.90, whilst lotteries had the lowest (0.60 at T0, 0.55 at T2). These results are supported by those of Muggleton et al. (Citation2021), who found high levels of spend on gambling (expressed as a proportion of household income) was highly concentrated, with 1% of gamblers spending 79.1% of household income on gambling. Furthermore, Forrest et al. (Citation2020), when looking at net expenditure of online gambling account data, found that 82% of gross gambling yield on online casinos was generated from 5% of players.
Our analyses also demonstrated that there was significant inequality in spending among participants with different PGSI scores. For example, the GINI-coefficient for total gambling spend among those with a PGSI score of 3+ was 0.83 at both timepoints. This shows that even within those experiencing moderate risk and problem gambling, there are substantial differences in spending, with excess gross spending being concentrated among a few individuals. That GINI-coefficients demonstrated substantial inequality across all PGSI groups shows that high levels of gross expenditure among a minority people are evident among those with a PGSI score of 0, 1–2 and 3+ alike. Thus, not all participants with the highest level of gross expenditure will have PGSI score of 3+, but contrary to common industry framing, not all will have a PGSI score of 0 either: the distribution of gross gambling spend by those in different PGSI categories is likely to overlap.
That said, the analyses also demonstrate that those with a PGSI score of 3 or more (and thus more likely to be at risk of gambling-related harms) place a disproportionately higher volume of wagers on gambling. This pattern is evident both for total gross gambling expenditure and for specific forms of gambling activity. At both timepoints, regular sports bettors with a PGSI score of 3 or more contributed greater volumes of expenditure than their population prevalence, though the pattern was most stark at T2, where the 14.1% of sports bettors with a PGSI score of 3 or more accounted for 43.5% of the reported gross expenditure on all forms of gambling (representing excess gross expenditure of +29.4 pp). Overall, both mean and median expenditure were highest among those with PGSI score of 3 or more, with median expenditure in T2 being nearly four times higher for those with a PGSI score of 3 or more than those with a PGSI score of 0. If these results are reflected in similar groups of people engaged in gambling nationally, and gross gambling expenditure is closely correlated to yield, it suggests that the gambling industry may rely on those most at risk or likely to be harmed for a greater proportion of their revenues.
However, among regular sports bettors, the underlying reliance on those with a PGSI score of 3 or more for greater gross expenditure varies by activity. Our data for lotteries, for instance, suggest lower reliance on those experiencing moderate risk/problem gambling for their share of spending, while our data on reported expenditure on activities like online casino suggest a high degree of reliance by the industry upon these people’s engagement, with around 90% of gross expenditure being attributable to around a third of players with a PGSI score of 3 or more. This pattern is explained, in part, due to online casinos having a high prevalence of people experiencing moderate risk/problem gambling within their player base (over 35% in this sample) but also these people spending more. As noted earlier, our estimates of the proportion of online casino players with a PGSI score of 3 or more is broadly commensurate with estimates from the HSE series demonstrating that among regular gamblers who bet on online casinos, there is a high proportion of people with a PGSI score of 3+ among this player base. To our knowledge, no current British estimates of how spend on online casino games varies by PGSI status is available. This should be a topic for further inquiry, especially to assess if those who are not regular sports bettors but do bet on online casino games have different spending patterns to those observed here. While our study focuses on regular sports bettors who also gambled on other things, these patterns replicate those observed among studies with more generalized samples of gamblers (Fiedler et al., Citation2019; Orford et al., Citation2012).
Yet not all activities with a high proportion of moderate risk/problem gamblers also saw high levels of excess gross expenditure being attributable to them. Online poker, for example, saw over 30% of its player base being drawn from those with a PGSI score of 3 or more but displayed comparatively lower levels of excess expenditure than online casinos. This suggests further attention be given to the interaction between expenditure, the structural and contextual features of games and industry practices used to encourage engagement.
For some activities, there were notable differences between timepoints. This was most apparent for online sports bettors: at T2, when many sports fixtures had resumed, 15% of people with a PGSI score of 3 or more accounted for 40% of all expenditure on this activity, which was not observed at T0. This degree of change requires further investigation in order to examine the stability of these patterns and to explore reasons for such changes. This could, for example, be attributable to seasonal differences (including differences in the availability of the domestic football season, with the English Premier League season beginning part way through T2), the impact of COVID-19 (including increased provision of live sports due to sporting calendar’s catching up after the earlier cessation of live sport in response to the ‘lockdown’ imposed earlier in 2020) and transitions in problem gambling status among participants (for example, some high spending individuals experiencing increasing problems some three months later).
Our results suggest that among regular sports bettors gross gambling spend is highly concentrated, and that those most at risk or likely to experience harms contribute a disproportionate amount of money toward gambling turnover. Our study provides preliminary evidence that, among a sample of regular sports bettors at least, these patterns may be elevated for certain activities such as online casino games which should be explored further. This has potential implications for the industry, for the Government and for regulators alike. The current UK government has stated a dual aim of wishing to protect people from harm while allowing the gambling industry to grow, innovate, and contribute to the economy (Department of Digital Culture Media and Sport, Citation2020). These results, however, suggest that for some sectors the source of such growth and contribution may disproportionately rely on those who experience harms from gambling. This recognition highlights a potential need to reform the fundamental economic model that underlies certain sections of the industry. This reformation should include changing the basis of who contributes the most money to the gambling industry by efforts to reduce the concentration of gambling expenditure among a few individuals and to reduce excess spending among those experiencing harms. This could be achieved through greater knowledge of the circumstances of high spenders, via a variety of proposed affordability insights, and/or prohibiting actions which encourage excess spending among certain players (for example, VIP schemes, certain direct marketing practices). In the absence of other data, we second the recommendation by Fiedler et al. (Citation2019) that the regulator should require operators, especially online operators where information is readily available, to report GINI-coefficients for different gambling formats to help assess and monitor changes in the concentration of gambling spend going forward. This should be provided alongside further detail of the distribution of expenditure to assess the nature of any observed changes in the co-efficient. For example, if the co-efficient becomes more equal, is this because the high spending few are spending less or because the majority are spending more? This would give greater insight into the broader patterns of consumption both for gambling overall and for individual formats.
These data have some limitations. They are based on sub-sample of gamblers, that is regular sports bettors many of whom also engaged in other gambling activities. For this reason, our findings may not be generalizable to all gambling sub-sectors. With regard to findings for online casino gambling, it would be useful to compare these results against a sample of online casino gamblers to see if similar results are reflected among those gambling on online casino games nationally. Nevertheless, the results presented here are consistent with other research in showing highly concentrated gambling spend and excess expenditure among those either at risk of or experiencing harms (Fiedler et al., Citation2019; Forrest et al., Citation2020). All data are self-reported and capturing expenditure accurately within surveys is difficult, although we used the method developed for the British Gambling Prevalence Survey, which was based on methods recommended by Wood and Williams (Citation2007). As noted earlier, this does not necessarily capture a consumer’s net position, but rather how much they wagered and some caution should be applied in extrapolating these findings to industry yield and revenues. While we would expect there to be a strong degree of correlation for most activities between patterns of outlay and yield by PGSI status, especially those activities where the outcome is underpinned by chance, this needs further assessment. This would ideally be generated by obtaining net expenditure data from player accounts which is then matched with assessment of PGSI status. In Britain, this level of insight does not yet exist. Estimates of concentration should and could be reproduced by the online gambling industry, which has access to actual playing data to assess if and how the GINI-coefficients reported here may vary, especially when based on net expenditure. This could then be compared with our self-reported data to assess accuracy. Although these data exist in Britain for online sports betting, online casino and online bingo, they have not been made publicly available as yet (Forrest et al., Citation2020). In our analysis, we did not exclude cases of extreme reported expenditure, arguing that such cases exist within the market and given that our population is a sample of known regular sports bettors these data are more likely to reflect real values than errors in data collection. Our supplementary analysis shows the impact of this decision – where removing outliers reduced excess gross expenditure for online casino games. Yet with outliers removed, those with a PGSI score of 3+ still maintained excess gross expenditure of +21.5pp. Patterns were more variable for online horse/dog racing suggesting that these estimates are more susceptible to the influence of a few ‘high rollers’.
Our data were collected during the COVID-19 pandemic which may have affected behaviors, especially at T2 which represented a period in Great Britain when some people were beginning to return to some previously suspended aspects of their lives; it is possible that the increase in excess gross expenditure by those with a PGSI score of 3 or more for online sports betting may be related to pent up demand due to the prior gap in opportunities to gamble when almost all sporting events were canceled nationally and internationally. However, this should not have affected online casino games or lotteries, for instance, both of which were available throughout the pandemic. Equally, the direction of travel for online sports bettors should be monitored – whatever the reason, an increase in excess gross expenditure among those who are harmed by gambling should be cause for concern.
Conclusion
Data from regular sports bettors in Great Britain shows that patterns of gross spend on gambling are highly unequal and concentrated among a few high spending individuals. Sports bettors either at risk of or experiencing harms spend a disproportionately higher amount of money on gambling, calling into question the British government’s dual ambition to both protect people from harms and allow the gambling industry to contribute to the economy and to grow. We suggest that policy attention be given to actions which reframe the underlying economic model on which the certain sections of the gambling industry are predicated, to create more equal patterns of consumption and less reliance on those harmed.
Funding sources
This project was funded by the Economic and Social Research Council, ref no: ES/V004549/1
Constraints on publishing
The funders have no role in the design of the study; in the collection, analyses or interpretation of data; in the writing of the manuscript; or in the decision to publish the results.
Competing interests
HW was Deputy Chair of the Advisory Board for Safer Gambling between May 2015 and March 2020. She was remunerated by the Gambling Commission (the industry regulator) for this. She is a member of the WHO panel on gambling and in 2019 worked on a study looking at gambling and suicide funded by GambleAware. NC has worked on one study funded by GambleAware, which examined the impact of gambling marketing/advertising on young people and vulnerable groups. AK, KH and IF have no competing interests to declare.
Preregistration statement
No preregistration was declared by the authors in relation to this manuscript.
Supplemental Material
Download MS Word (22.3 KB)Data availability statement
The data that support the findings of this study are available on request from the corresponding author, [HW]. The data will be deposited in the UK Data Archive during 2022.
Supplementary material
Supplemental data for this article can be accessed online at https://doi.org/10.1080/14459795.2022.2088823
Additional information
Notes on contributors
Heather Wardle
Heather Wardle is Lord Kelvin Adam Smith Reader in Social Sciences at the University of Glasgow. Her first book ‘Games without Frontier? Socio-historical perspectives at the gaming/gambling intersection’ was published in by Palgrave MacMillan in 2020.
Alexey Kolesnikov
Alexey Kolesnikov is a Masters Student in Business Studies at the University of Glasgow and Analysis Intern for the ESRC-funded Covid and Betting Impact study.
Ingo Fiedler
Ingo Fiedler is co-founder of the nonprofit Blockchain Research Lab in Hamburg, and Affiliate Assistant Professor at Concordia University, Montreal. He holds diplomas both in business administration and economics and obtained his award-winning Ph.D. from the University of Hamburg. Dr. Fiedler authored nine books and over 50 articles in academic journals.
Nathan Critchlow
Nathan Critchlow is currently a Griffith Edward’s Academic Fellow for the Society for the Study of Addiction, and is based in Institute for Social Marketing and Health, Faculty of Health Sciences and Sport. He specializes in quantitative methods to analyze marketing activity and the association with health-related knowledge, attitudes, and behaviors in consumers
Kate Hunt
Kate Hunt is Professor in Behavioural Sciences and Health, in the Institute for Social Marketing. Before moving to Stirling, she worked for many years in the MRC Social and Public Health Sciences Unit at the University of Glasgow.
References
- Abbott, M., Bellringer, M., Vandal, A., Hodgins, D., Palmer Du Perez, K., Landon, J., Sullivan, S., Feigin, V. 2012. Effectiveness of problem gambling brief intervention telephone calls: A randomised control trial. Gambling and Addictions Research Centre, Auckland University of Technology. Retrieved February.01, 2020, from https://www.researchgate.net/publication/269875396_EFFECTIVENESS_OF_PROBLEM_GAMBLING_BRIEF_TELEPHONE_INTERVENTIONS_A_RANDOMISED_CONTROLLED_TRIAL
- Callegaro, M., Villar, A., Krosnick, J., & Yeager, D. (2014). A critical review of studies investigating the quality of data obtained with online panels. In M. Callegaro, R. Baker, J. Bethlehem, A. Goritz, J. Krosnick, & P. Lavrakas (Eds.), Online panel research: A data quality perspective, 23-53. John Wiley & Sons.
- Conolly, A., Davies, B., Fuller, L., Heinze, N., & Wardle, H. (2018). Gambling behavior in Great Britain in 2016. Gambling Commission.
- Department of Digital Culture Media and Sport. (2020) Review of the gambling act 2005: Terms of reference and call for evidence. Retrieved November 18, 2021, from https://www.gov.uk/government/publications/review-of-the-gambling-act-2005-terms-of-reference-and-call-for-evidence/review-of-the-gambling-act-2005-terms-of-reference-and-call-for-evidence
- Ferris, J., & Wynne, H. (2001). The Canadian problem gambling index: Final report. Canadian Centre on Substance Abuse.
- Fiedler, I., Kairouz, S., Costes, J. M., & Weißmüller, K. (2019). Gambling spending and its concentration on problem gamblers. Journal of Business Research, 98(5) , 82–91. https://doi.org/10.1016/j.jbusres.2019.01.040
- Forrest, D., McHale, I. (2020) Exploring online patterns of play: Interim report. GambleAware. Retrieved October 11.2021, from https://www.begambleaware.org/sites/default/files/2021-03/PoP_Interim%20Report_Short_Final.pdf
- Gerstein, D., Volberg, R., Toce, M., et al. (1999) Gambling impact and behavior study: Report to the national gambling impact study commission. National Opinion Research Center.
- House of Commons. (2021) Coronavirus: A history of lockdown laws in England. Retrived January 12, 2021, from https://researchbriefings.files.parliament.uk/documents/CBP-9068/CBP-9068.pdf
- Hunt, K., Critchlow, N., Brown, A., Bunn, C., Dobbie, F., Donnachie, C., Gray, C. M., Purves, R., Reith, G., Stead, M., Mitchell, D., & Wardle, H. (2020). Protocol for a mixed-method investigation of the impact of the COVID-19 pandemic and gambling practices, experiences and marketing in the UK: The “betting and gaming COVID-19 impact study”. International Journal of Environmental Research and Public Health, 17(22), 8449. https://doi.org/10.3390/ijerph17228449
- Knai, C., Petticrew, M., Capewell, S., Cassidy, R., Collin, J., Cummins, S., Eastmure, E., Fafard, P., Fitzgerald, N., Gilmore, A. B., Hawkins, B., Jensen, J. D., Katikireddi, S. V., Maani, N., Mays, N., Mwatsama, M., Nakkash, R., Orford, J. F., Rutter, H., … Weishaar, H. (2021). The case for developing a cohesive systems approach to research across unhealthy commodity industries. BMJ Global Health, 6(2), e003543. https://doi.org/10.1136/bmjgh-2020-003543
- Kushnir, V., Godinho, A., Hodgins, D. C., Hendershot, C. S., & Cunningham, J. A. (2018). Self-directed gambling changes: Trajectory of problem gambling severity in absence of treatment. Journal of Gambling Studies, 34(4), 1407–1421. https://doi.org/10.1007/s10899-018-9769-8
- Landman Economics. (2020). Landman economics – written evidence (GAM0039) [submission to the house of lords select committee inquiry into the social and economic impact of the gambling industry]. Retrived August 04, 2022, from https://committees.parliament.uk/writtenevidence/117/html/
- Mazar, A., Zorn, M., Becker, N., & Volberg, R. A. (2020). Gambling formats, involvement, and problem gambling: Which types of gambling are more risky? BMC Public Health, 20(1), 711. https://doi.org/10.1186/s12889-020-08822-2
- Muggleton, N., Parpart, P., Newall, P., Leake, D., Gathergood, J., & Stewart, N. (2021). The association between gambling and financial, social and health outcomes in big financial data. Nature Human Behaviour, 5(3), 319–326. https://doi.org/10.1038/s41562-020-01045-w
- Orford, J., Wardle, H., & Griffiths, M. (2012). What proportion of gambling is problem gambling? Estimates from the 2010 British gambling prevalence survey. International Gambling Studies, 13(1), 4–18. https://doi.org/10.1080/14459795.2012.689001
- Pickering, D., & Blaszczynski, A. (2021). Paid online convenience samples in gambling studies: Questionable data quality. International Gambling Studies, 21(3), 516–536. https://doi.org/10.1080/14459795.2021.1884735
- Productivity Commission. (1999) Australia’s Gambling Industries, Report No. 10.
- Smith, G. J., & Wynne, H. J. (2002). Measuring gambling and problem gambling in Alberta using the Canadian Problem Gambling Index (CPGI): Final report. Alberta Gabling Research Institute.
- Sulkunen, P., Babor, T., Cisneros Örnberg, J., Egerer, M., Hellman, M., Livingstone, C., Marrioneau, V., Nikkenen, J., Orford, J., Room, R. (2019). Setting limits: Gambling, science and public policy. Oxford University Press.
- Volberg, R. A., & Stuefen, R. M. (1994). Gambling and problem gambling in South Dakota: A follow-up survey. Gemini Research.
- Volberg, R. A., & Vales, P. A. (1998). Gambling and problem gambling in Puerto Rico. Report to the Puerto Rico Treasury Department. Gemini Research.
- Volberg, R. A., & Bernhard, B. (2006). The 2006 study of gambling and problem gambling in New Mexico: Report to the responsible gaming association of New Mexico. Gemini Research.
- Wardle, H., Moody, A., Spence, S., Orford, J., Volberg, R., Jotangia, D., Griffiths, M., Hussey, D., Dobbie, F. (2011). British gambling prevalence survey 2010. Gambling Commission: Birmingham.Wiebe J, Mun P, Kauffman N (2006) Gambling and problem gambling in Ontario 2005 Responsible Gaming Council.
- Wardle, H., Ireland, E., Sharman, S., Excell, D., Ordonez, D. (2014). Patterns of Play: Analysis of data from machines in bookmakers. GambleAware.
- Wardle, H., Donnachie, C., Critchlow, N., Brown, A., Bunn, C., Dobbie, F., Gray, C., Mitchell, D., Purves, R., Reith, G., Stead, M., & Hunt, K. (2021). The impact of the initial Covid-19 lockdown upon regular sports bettors in Britain: Findings from a cross-sectional online study. Addictive Behaviors, 118, 106876. https://doi.org/10.1016/j.addbeh.2021.106876
- Williams, R. J., & Wood, R. T. (2004). The proportion of gaming revenue derived from problem gamblers: Examining the issues in a Canadian context. Analyses of Social Issues and Public Policy, 4(1), 33–45. https://doi.org/10.1111/j.1530-2415.2004.00033.x
- Williams, R. J., & Wood, R. T. (2007). The proportion of Ontario gambling revenue derived from problem gamblers. Canadian Public Policy, 33(3), 367–387. https://doi.org/10.3138/cpp.33.3.367
- Wood, R. T., & Williams, R. J. (2007). ‘How much money do you spend on gambling?’ The comparative validity of question wordings used to assess gambling expenditure. International Journal of Social Research Methodology, 10(1), 63–77. https://doi.org/10.1080/13645570701211209