
ABSTRACT
Participation in various types of gambling is associated with age and gender. Younger men tend to be drawn toward online gambling whereas women and older individuals tend to engage more in land-based gambling such as electronic gaming machines (EGMs). The present study examined how annual trends in theoretical loss, a robust measure of risk propensity/gambling intensity, varied according to age groups and gender among an EGM-population in Norway (N = 195,318, 26.5% women, age range 18 to 103 years [M = 40.13, SD = 16.29]). Quantile regression on the 25th percentile, median, and 90th percentile theoretical loss showed that higher theoretical loss at these quantiles were associated with older age. At the 90th percentile: Individuals aged 60–69 years had highest theoretical loss at 15,343 NOK (1,784 USD). Compared to men, women had higher 90th percentile theoretical loss (1,658 NOK≈193 USD). Interaction analyses showed that the positive association between age and theoretical loss was stronger for men compared to women. Gambling expenditure is positively associated with disordered gambling and the findings suggests that older individuals and women represent more vulnerable groups among the EGM population.
People of nearly all ages gamble, some even across the whole lifespan (Welte et al., Citation2017). Development of disordered or high-risk gambling may occur at any point during the life course and involves varying levels of accompanying harm (Shaffer & Korn, Citation2002). For the individual and affected others, severe forms of disordered gambling are associated with the most harm, even rivaling the harm related to alcohol use disorder (Browne et al., Citation2017; Currie et al., Citation2006; Langham et al., Citation2016; Li et al., Citation2017). However, when viewed from a societal perspective, milder levels of risky gambling appear to confer the most harm due to their higher prevalence in the population (Browne & Rockloff, Citation2018; Canale et al., Citation2016). Milder levels of risky gambling can be understood as involving gambling harms occurring in absence or with milder amounts of behavioral symptoms of problem gambling (e.g. preoccupation, increased tolerance, loss chasing). Consequently, from a public health perspective it is important to monitor and examine the trends of varying levels of gambling to identify changes in gambling involvement and risky gambling behavior over time. Such patterns may be related to well-established demographic correlates of disordered gambling such as age and gender, leading to the implementation of appropriate prevention efforts.
The role of age and gender in disordered gambling and gambling preference
Age and gender are robust correlates of disordered gambling (Allami et al., Citation2021). Disordered gambling is more prevalent among younger compared to older individuals, and among men compared to women. Problem gambling has been estimated to affect between 0.12–5.8% worldwide and while demographic categorization differs between studies there is a trend indicating more problem gambling among men compared to women and for those aged below 30 years compared to those aged above (Calado & Griffiths, Citation2016; Calado et al., Citation2017). Within Norway (where the present study was carried out), 1.4% of the population has been categorized as problem gamblers (Pallesen et al., Citation2020). In relation to age and gender, this comprises 1.9% for men compared to 0.8% for women, and 1.6% for those aged below 30 years compared to 1.3% for those aged 30 and above. Young people might be more likely to develop disordered gambling because of a general tendency for risk-seeking behavior which itself could be affected by peer norms and influence, identity exploration, and ongoing brain maturation (Sussman & Arnett, Citation2014; Volberg et al., Citation2010). Men also display increased impulsivity and risk-seeking compared to women, which could partly explain men’s increased susceptibility for disordered gambling (González-Ortega et al., Citation2013).
Still, disordered gambling is also prevalent among women and older adults, which makes it important to understand disordered gambling among these groups (Ariyabuddhiphongs, Citation2012; Merkouris et al., Citation2016). One systematic review found that disordered gambling among women was more strongly associated with psychological distress, unemployment, and childhood abuse compared to disordered gambling among men (Merkouris et al., Citation2016). For older adults (55+ years), unique gambling motivations could partly explain disordered gambling within this group (Ariyabuddhiphongs, Citation2012; Tse et al., Citation2012). Older adults are more likely to gamble to socialize and to escape loneliness, anxiety, or depression compared to younger adults (Botterill et al., Citation2016; Elton-Marshall et al., Citation2018; Parke et al., Citation2018). Gambling to escape loneliness might be an especially important motive among older men (Botterill et al., Citation2016). Gambling to escape shows a stronger association with disordered gambling compared to other gambling motivations (Marchica et al., Citation2020).
Disordered gambling within genders and different age groups might be better understood by considering that individuals of different ages and gender show preference for different gambling types. For instance, young men show stronger preference for online gambling compared to older individuals and women (Gainsbury et al., Citation2015; Pallesen et al., Citation2021). Moreover, there is a stronger association between online gambling and disordered gambling compared to land-based gambling, which in turn might partly explain the higher prevalence of disordered gambling among young men (Allami et al., Citation2021). Women have been found to have a stronger preference for non-strategic gambling such as electronic gaming machines (EGMs) and bingo compared to men and disordered gambling among women is typically associated with their engagement with EGMs in some countries (Baggio et al., Citation2018; Husky et al., Citation2015; McCarthy et al., Citation2018).
Behavioral tracking data and markers of risky gambling
Specific forms of gambling behaviors are associated with disordered gambling, which reflect more risky patterns of gambling (Delfabbro et al., Citation2012). The identification of these patterns has been facilitated by a growing number of studies using data on actual gambling behavior, often termed ‘behavioral tracking’ or ‘player-account data’ (Chagas & Gomes, Citation2017; Deng et al., Citation2019). Behavioral tracking data are not subject to recall and social desirability bias like self-report data (Griffiths, Citation2014; Shaffer et al., Citation2010). Compared to these objective data, gamblers have subjectively been shown to overestimate their wins and underestimate their losses, a tendency which is stronger among those with higher losses and self-reported gambling problems (Braverman et al., Citation2014; M. Auer & Griffiths, Citation2017).
Studies using behavioral tracking data and survey data have found that gambling behavior can be used to predict disordered gambling or self-exclusion (which can act as an indicator of disordered gambling) (Chagas & Gomes, Citation2017; Delfabbro et al., Citation2012; Ukhov et al., Citation2021). For example, the amount of money spent/lost to gambling is one type of behavioral indicator that has been suggested to reflect gambling intensity and propensity for risk-taking while gambling (Braverman & Shaffer, Citation2012; Deng et al., Citation2021; Dragicevic et al., Citation2011; Fiedler et al., Citation2019; Grönroos et al., Citation2021). However, one limitation with relying on money spent/lost to gambling in isolation is that individual win/loss events (e.g. winning a large sum of money from a low stake, or losing a bet with an unusually high stake) and differences in house advantage across games may bias the measure. M. Auer and Griffiths (Citation2014) argue that ‘theoretical loss’ represents one type of measure that can account for these limitations. Theoretical loss is calculated by multiplying the total bet size by the house advantage specific to each game type and is a robust and stable measure of gambling intensity. Consequently, expenditure on games with a lower house advantage will result in lower theoretical loss and therefore lower risk taking compared to expenditure on games with higher house advantage.
Another behavioral indicator of disordered gambling not directly contingent on money spent is gambling frequency (e.g. number of different days played) (Braverman & Shaffer, Citation2012; LaPlante et al., Citation2014), which cross-sectional data suggests being an especially important predictor of disordered gambling among EGM gamblers (Brosowski et al., Citation2021).
The distribution of gambling behavior and utility of quantile regression
Gambling activity appears to be heavily skewed in that a minority of gamblers account for most of the gambling activity (Deng et al., Citation2021; Fiedler et al., Citation2019; Orford et al., Citation2013; Whiteford et al., Citation2022). For instance, it was suggested in one study that the top 20% most engaged gamblers account for 90% of the net losses (Deng et al., Citation2021). The concentration of losses among a minority of gamblers could also suggest that highly involved gamblers differ in other aspects such as their background variables. Quantile regression represents an approach to studying such potential differences between gambling involvement groups by analyzing specific parts of the distribution, dividing it into (for example) quantiles such as the 25th, 50th [median], and 90th percentile (Koenker & Hallock, Citation2001). There is currently a dearth of studies employing quantile regression to study gambling behavior (for exceptions, see Roukka & Salonen, Citation2020; Whiteford et al., Citation2022). Studies using regression analyses typically rely on ordinary least squares (OLS) regression which estimates the effect of independent variables on the mean of the dependent variable, therefore focusing on the middle of the distribution. Such estimations may fail to generalize to other parts of the distribution in case of non-linear effects. For instance, one study found a stronger positive association between age and gambling expenditure at the 10th percentile and 90th percentile compared to the 50th percentile (Roukka & Salonen, Citation2020). Quantile regression enables investigations of such non-linear effects. Additionally, when representing the average (and other parts of the distribution) it is robust in relation to outliers and can handle heteroscedasticity (Koenker & Hallock, Citation2001).
There are benefits to investigating gambling behavior at lower and higher ends of the distribution. Studies have found that, in total, lower levels of risky gambling and lower levels of expenditure are associated with the most gambling harm in the population overall (Browne & Rockloff, Citation2018; Canale et al., Citation2016). This suggests that prevention efforts achieve most harm reduction by prioritizing low intensity gamblers over high intensity/disordered gamblers, what is termed the ‘prevention paradox’. However, individuals with problem gambling and high gambling expenditure are still important targets for intervention because these groups experience the highest number of gambling harms at the individual level, including the most severe harms. If the direction or strength of associations between background variables (such as age and gender) differ between low, average, and high intensity gamblers then this is important information for focused targeting in prevention efforts.
The Norwegian context and the present study
The present study was conducted based on data from gamblers in Norway. Since the beginning of the 2000s, Norway has employed strong restrictions on the availability and access to gambling products (Rossow & Hansen, Citation2016). The state-owned gambling operator Norsk Tipping has a monopoly on providing scratch-cards, sports betting, number games, electronic gaming machines, and internet-based casino games. The other monopoly gambling operator Norsk Rikstoto has exclusive rights on horserace betting. However, due to online gambling opportunities, Norwegians may also to some degree engage in gambling via unregulated foreign operators.
Norsk Tipping introduced a new interactive electronic gaming machine Multix in 2008. Multix is a multigame terminal and offer games such as slots, roulette, and poker. To play Multix, individuals must be 18 years and older. Multix terminals have several responsible gambling measures, such as mandatory and voluntary loss-limits, as well as opportunities for players to self-exclude temporarily or semi-permanently (i.e. one-year minimum and ongoing until canceled). In 2009, Norsk Tipping made registered play mandatory for all their gambling products, except paper-based scratch-cards. Individuals are required to use a personalized player card which is linked to their social security number. Importantly, this enables complete records of gambling behavior such as gambling expenditure, frequency, and self-exclusion, as well as geographical data (i.e. where the gambling is taking place) (Leino et al., Citation2017). The terminals are widespread throughout Norway, typically located in convenience stores and gas stations.
The present study investigated the association between age and gender and gambling intensity (as measured using theoretical loss) for the full population of Multix customers between 2013 and 2018. As noted above, age and gender have been shown to be robust predictors of risky and disordered gambling. However, it is unclear how these demographic variables relate to gambling intensity at varying levels of engagement over time. The skewed distribution typically observed for gambling behavior suggests that explanatory variables such as age and gender can have different associations with gambling intensity for those with low, average, and high engagement, for example. There are currently few studies examining gambling behavior with quantile analysis and there is to date no consensus regarding what quantiles constitutes ‘low’, ‘average’, and ‘high’ in this context. The present study focused on a limited number of quantiles for parsimony and opted for the 25th percentile as representing ‘low’, the 50th percentile (median) representing ‘average’, and the 90th percentile representing ‘high’. The 25th percentile was chosen because it represents the middle of the lower half distribution, while the 90th percentile was chosen because it represents higher values without being confined to participants with extreme scores. Therefore, the present study was guided by the following research question: How do annual trends in low-intensity gambling (defined as 25th percentile theoretical loss), average gambling participation (defined as median theoretical loss [50th percentile]) and high-intensity gambling (defined as 90th percentile theoretical loss) vary by age groups and gender among a population of EGM customers in Norway?
Methods
Participants
Norsk Tipping provided gambling behavior data from the full population of Multix EGM customers between March 2013 and December 2018, comprising 195,318 individuals (26.5% women). Participant age at first active month of Multix play during the study period ranged from 18 to 103 years (M = 40.1 years, SD = 16.3).
Procedure and materials
Behavioral tracking data were requested from Norsk Tipping including information on age, gender, and gambling behavior on individual and total Multix games, and total sum of bets on all Norsk Tipping games, as well as loss-limit and self-exclusion behavior. All customers were linked to a unique identifying number (see appendix part A for full list of variables). The data were aggregated at a monthly level resulting in a total of 70 time points between March 2013 and December 2018.
Measures
Demographic information included age and gender, which was extracted by Norsk Tipping through customers’ personal identification numbers. Age was handled in categorical age bands in the present study (i.e. 18–29, 30–39, 40–49, 50–59, 60–69, and 70+). There was no access to information regarding participants’ ethnicity.
The present study focused on annual theoretical loss, a measure of risk propensity, calculated by multiplying game-specific gambling expenditure by game-specific house advantage. Norsk Tipping provided estimates on house advantage percentages for each game on Multix between 2013 and 2018, including updated values when game changes affected associated house advantage percentage. Of the 44 different games offered on the Multix terminals in 2018, five had a skill element. For these games the house advantage was calculated based on optimal play or average house advantage when optimal play was unknown. The median house advantage across games was 8% (IQR = 7.4%, 8.8%) with minimum 0.5% (blackjack, based on optimal play) and maximum 50% (‘Monkey Business’, a skill-element matching game, based on average house advantage).
First, gambling expenditure was adjusted for annual inflation to provide the average value of NOK in 2021 as provided by the Central Bank of Norway (https://www.norges-bank.no/en/topics/Statistics/Price-calculator-/). Then, each customer’s monthly theoretical loss was calculated for each game and summarized across games. Finally, this monthly aggregate measure was summed annually. Gambling behavior data were only available from March onwards in 2013, so annual theoretical loss for 2013 was multiplied by 1.2 to better compare these data to subsequent years in the study.
Statistical approach
All statistical analyses were conducted with R version 4.1.3 (R Core Team, Citation2022), see appendix part A for list of R packages used. Descriptive statistics included proportion of Multix EGM players (defined as having played at Multix at least once) by age group, gender, and year. Annual theoretical loss ranged from 0 to 109,618 NOK, M = 6,782 (SD = 10,198), Md = 1,265 (IQR = 86, 10179), and exhibited positive skewness (1.83) and kurtosis (3.25). Descriptive statistics also included observed 25th percentile, median and 90th percentile theoretical loss by year, gender, and age groups, presented visually. Quantile regression was used to examine the study’s research question. Quantile regression is robust to outliers and allows for examination of covariates effects on separate parts of the conditional distribution (Koenker & Hallock, Citation2001). Estimates were calculated at the conditional 25th percentile, median, and 90th percentile of theoretical loss. Two types of models were examined with annual theoretical loss as the outcome variable: The first model examined main effects of age categories, gender, and year, whereas the second model examined all two-way interactions between age categories, gender, and year. Age was handled categorically to account for potential non-linear effects, either in general or within different parts of the distribution (i.e. different quantiles) and to be able to relate findings to different parts of adult life. The analysis followed recommendations to report simple effect sizes (original units) rather than standardized effect sizes when they are meaningful (Baguley, Citation2009). Theoretical loss was measured in Norwegian kroner (NOK) which can be interpreted directly, is easily converted to other currencies, and is of practical interest. Confidence intervals were calculated and conversions to United States dollars (USD) are presented to facilitate international interpretability and comparisons. Average exchange rates for 2021 were obtained from the Central Bank in Norway in which 1 USD = 8.6 NOK (https://www.norges-bank.no/en/topics/Statistics/exchange_rates/?tab=currency&id=USD).
Two sensitivity analyses were conducted to account for potential study limitations. First, in order to assess the degree of which theoretical loss might give an indication of disordered gambling, the analysis examined the proportion of self-exclusion among categories of theoretical loss. Behavioral indicators have previously been assessed against self-exclusion as a form of proxy measure for disordered gambling (Finkenwirth et al., Citation2021; Haefeli et al., Citation2011; Haeusler, Citation2016). The 25th percentile theoretical loss (86 NOK), 50th percentile (median) theoretical loss (1,265 NOK), and 90th percentile annual theoretical loss (22,770 NOK) was calculated based on the whole study period. Individuals’ annual theoretical loss was then categorized into below 25th percentile, 25th to below 50th percentile (median), 50th to below 90th percentile, and 90th percentile and above. Self-exclusion was defined as Norsk Tipping customer’s having at least one of any type of self-exclusion that year (temporary or semi-permanent on Multix, or semi-permanent on all Norsk Tipping’s gambling products). Second, to account for differences in affordability among analyzed groups (e.g. older individuals typically having more money to gamble compared to younger individuals which could explain potential differences in theoretical loss), main analyses were repeated on active days played (gambling frequency) which has also been associated with disordered gambling but is less contingent on money spent (Braverman & Shaffer, Citation2012; LaPlante et al., Citation2014). Quantile regression was not possible on 25th percentile days played due to low variation in the included predictors at that quantile. Only summary results are presented from sensitivity analyses for brevity whereas the full results are reported in Appendix part B.
Ethics
The present study used secondary data that was de-identified by Norsk Tipping before access. Therefore, the study was exempted from ethical approval in accordance with guidelines of the Norwegian Centre for Research Data. Norsk Tipping ensured participant anonymity by providing each participant a constructed and unique identification number and aggregated the customer tracking data to a monthly level.
Results
shows number of individuals who played Multix at least once during each year broken down by gender. The number of individuals playing Multix has decreased from 101,695 in 2013 (data available from March to December only) to 80,607 in 2018. The group with the highest number playing Multix were men aged 18–29 years irrespective of year. Women had relatively larger proportion of participating gamblers among their older age groups compared to men across the years examined. However, within each gender, the relative number of players shifted from younger to older age categories across the years examined for both genders.
Table 1. Participants on multix between 2013 and 2018 by gender.
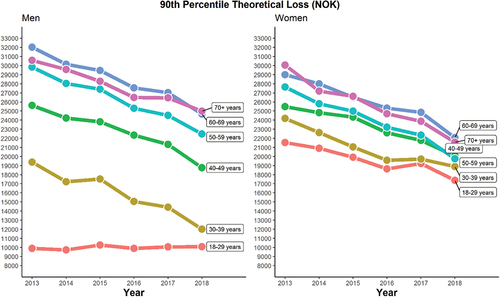
Observed trends in terms of 25th percentile, median and 90th percentile theoretical loss are visualized by age category, gender, and year, in , respectively. The results show that theoretical loss was positively associated with age for both men and women at all quantiles (25th, 50th [median], and 90th). The results in show that among those in the 25th percentile theoretical loss group, theoretical loss was relatively stable between 2013 and 2018 for women at all age groups and men at age groups 18–29 years, 30–39 years, 40–49 years, and 50–59 years. Men aged 60–69 years and 70+ years showed more yearly variation, notably an increase in theoretical loss at 2015 (and 2016 for those aged 70+) followed by a reduction in 2017. The results in show that among those in the median theoretical loss group, theoretical loss was relatively stable between 2013 and 2018 among men aged 18–29 years and 30–39 years, and women aged 18–29 years. Median theoretical loss decreased between 2013 and 2018 for the other age groups and the reduction was stronger among older age groups. At all quantiles, the range in theoretical loss between the youngest and oldest age group was greater for men compared to women (i.e. men were more heterogeneous across age categories compared to women). The results in indicate that this pattern was more pronounced when considering the 90th percentile. also suggests that there is more overlap in levels of theoretical loss among the oldest age categories when considering the 90th percentile values of theoretical loss compared to median values and the 25th percentile values.
Figure 1. Observed trends in 25th percentile theoretical loss in Norwegian Krone (NOK) between 2013 and 2018
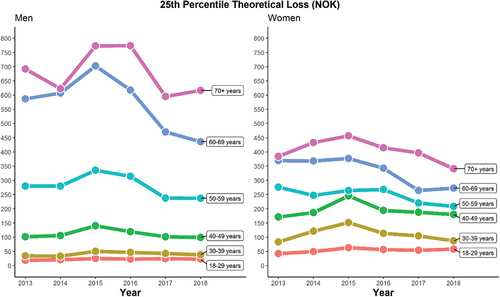
Figure 2. Observed trends in median theoretical loss in Norwegian Krone (NOK) between 2013 and 2018
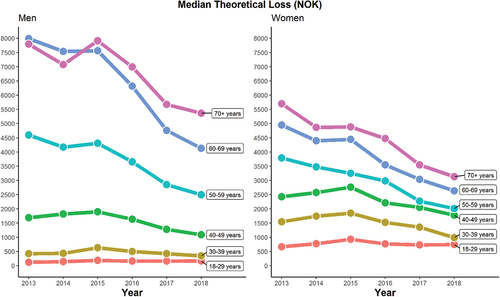
Figure 3. Observed trends in 90th percentile theoretical loss in Norwegian Krone (NOK) between 2013 and 2018
Results from quantile regressions are presented in and provide more precise estimates of the strength of associations between unique predictors and annual theoretical loss. Model 1 ( with main effects) indicated no annual changes in theoretical loss at the 25th percentile, and only small annual reductions at the median (35 NOK≈4 USD) and 90th percentile (1,061 NOK≈123 USD). Theoretical loss increased with age. The oldest age group (70+ years) had the highest estimated 25th percentile theoretical loss at 500 NOK (≈58 USD) and median theoretical loss at 5,280 NOK (≈614 USD), while the second oldest age group (60–69 years) had the highest estimated 90th percentile theoretical loss at 15,343 NOK (≈1,784 USD). Women had a higher theoretical loss than men when considering main effects at the 25th percentile, median, and 90th percentile. Model 2 ( with interaction effects) indicated stronger age-related differences in theoretical loss among men compared to among women. For instance, considering the 90th percentile at 2013, men aged 18–29 years had a theoretical loss of 10,196 NOK (≈1,186 USD) while women aged 18–29 years had a theoretical loss of 20,217 NOK (≈2,351 USD). However, in the 70+ years bracket, men had the highest theoretical loss of 30,753 NOK (≈3,576 USD) compared to women 28,957 NOK (≈3,367 USD). Interactions between years and gender were small and statistically non-significant, where women as compared to men, showed a small increase of 1 NOK (≈0.12 USD) in 25th percentile theoretical loss and 12 NOK (≈1 USD) in median theoretical loss over the years, and a small decrease of 95 NOK (≈11 USD) in 90th percentile theoretical loss over the years. Interaction between years and age groups indicated that those aged 60–69 reduced their 25th percentile theoretical loss and median theoretical loss the most over the years with 33 NOK (≈4 USD) and 729 NOK (≈85 USD) decrease, respectively. Those aged 50–59 reduced their 90th percentile theoretical loss most over the years with 1 318 NOK (≈153 USD) decrease.
Table 2. Quantile regressions on 25th percentile, median, and 90th percentile yearly theoretical loss in NOK.
Table 3. Quantile regressions with interaction effects on 25th percentile, median, and 90th percentile yearly theoretical loss in NOK.
Results from sensitivity analyses (full results are presented in Appendix part B) showed that those with 50th to below 90th percentile theoretical loss had the highest proportion of self-exclusion (5.6%) compared to the 90th percentile and above (3.4%), the 25th percentile to below median (2.3%), and those below the 25th percentile (0.6%). Quantile regressions on median and 90th percentile days played (Table B2) showed that days played increased with age, Model 1: Age 70+ years had the highest median of 44 days and 90th percentile of 101 days. Model 2 indicated stronger age-related differences in days played for men compared to among women. For instance, considering the 90th percentile at 2013, men aged 18–29 years had 54 days played while women aged 18–29 years had 79 days played. However, in the 70+ years bracket, men had the highest days played at 180 days compared to women at 139 days.
Discussion
The present study investigated how gambling intensity in a population of EGM gamblers was related to age and gender differences. The results indicated that gambling on Multix EGMs decreased between 2013 and 2018 and that the player base had become older across the period. Reductions in EGM participation have also been observed in Finland between 2007 to 2015 (Castrén et al., Citation2018). One explanation for this decrease could be the increasing popularity of online gambling over the same period. Online gambling is more frequent among younger individuals and men in Norway (Pallesen et al., Citation2021). In terms of age, this is in line with the finding that the Multix player-base is becoming older. In terms of gender, the relative proportion of men and women participating each year remained nearly the same from 2013 to 2018 in the present study (74%/73% men versus 26%/27% women). Men aged 18–29 years had the highest rate of participation on Multix (i.e. having played at least once during a year) but the lowest gambling intensity. It is conceivable that young men might concentrate their gambling online or on other types of gambling such as sports betting, resulting in low gambling intensity on EGMs such as Multix (Pallesen et al., Citation2021; Venne et al., Citation2020). Women aged 18–29 years also reduced their Multix participation over the examined years compared to other age categories of women. Younger women have increased online presence compared to older women which could increase their exposure to online gambling marketing leading them to engage in other types of gambling besides EGM gambling (McCarthy et al., Citation2018).
The results supported the notion about age and gender differences in gambling intensity among EGM players. Gambling intensity as measured by theoretical loss was positively associated with age for low (25th percentile), average (median) and highly involved (90th percentile) gamblers. However, it was somewhat surprising that older age was associated with the highest theoretical loss because disordered gambling is typically more prevalent among younger individuals (Allami et al., Citation2021). The results of the present study suggest that older individuals might be at higher risk compared to younger individuals playing EGMs. It has been suggested that a key motivation for gambling among older individuals is to socialize and/or alleviate feelings of isolation which is possible at many venues with Multix (Parke et al., Citation2018). This is important to keep in mind because gambling to escape negative emotions appears to be more strongly associated with disordered gambling compared to other types of gambling motivations (Marchica et al., Citation2020).
Men showed more age-related differences in gambling intensity compared to women, and this pattern was more pronounced when considering the most involved gamblers (90th percentile theoretical loss). Previous studies suggest that women show a relative preference for EGM gambling which could explain why they have higher gambling intensity on Multix compared to men who typically prefer other game types such as sports betting and poker (Holdsworth et al., Citation2012; McCarthy et al., Citation2018; Venne et al., Citation2020). Disordered gambling among women is typically associated with EGMs in particular (Baggio et al., Citation2018). The difference in gambling intensity was especially strong between men and women aged 18–29 years at the 90th percentile, where women were found to have twice as high gambling intensity. Being of young adult age is associated with higher preference for online gambling (Gainsbury et al., Citation2015; Pallesen et al., Citation2021), but the influence of women`s preference for EGMs might exceed this for young adult women which results in especially strong gender differences in EGM gambling intensity at this age group. Among the most involved gamblers (90th percentile), gambling intensity fell markedly across observed years for men in age groups 30–39 years and 40–49 years. Men in older age groups might become increasingly comfortable with online gambling solutions which would be coinciding with the expansion of online gambling opportunities over the years examined (Pallesen et al., Citation2021).
Both older individuals and women have more often than their younger counterparts reported being motivated to gamble to reduce negative emotions, anxiety, depression, and loneliness, which has been termed escapism motivation (Holdsworth et al., Citation2012; Parke et al., Citation2018). Escapism motivation has also been found to drive gambling participation and frequency with EGMs, with stronger associations for those with risky gambling (Abarbanel, Citation2014; Balodis et al., Citation2014; Wood & Griffiths, Citation2007). Taken together, these findings may explain why older individuals and women emerged as the groups with the highest gambling intensity in the present study.
Results from the present study can also be interpreted in relation to income among Norwegians. Statistics Norway (Citation2023) provides information concerning the median income in Norway after tax for select demographic groups in 2021: single individuals aged 18–30 years earned 302,000 NOK (≈30,541 USD), those aged 30–44 years earned 372,000 NOK (≈37,606 USD), those aged 45–66 years earned 366,000 NOK (≈36,992 USD), and those aged 67+ years earned 293,000 NOK (≈29,615 USD). Individuals cohabiting show the same pattern of relative age group differences in median income after tax (Statistics Norway, Citation2023). Based on these median income values and theoretical loss in 2018, the most intense gamblers (90th percentile) among men aged 18–29 years had a theoretical loss reflecting 3.3% of their income, while men aged 70+ years had a theoretical loss reflecting 8.5% of their income. The most intense gamblers among women aged 18–29 years had theoretical loss reflecting 5.8% of their income, while women aged 70+ years had theoretical loss reflecting 7.4% of their income. However, it should be emphasized that theoretical loss does not equate to actual losses and disposable income for gambling and is dependent on multiple factors such as debt, wealth accumulation, and caretaker responsibilities. Notably, gender can influence income, although this appears to be less influential in Norway compared to many other countries such as the US (Reisel et al., Citation2019).
The present study focused on theoretical loss as an outcome measure, a measure that reflects risk-taking (M. Auer & Griffiths, Citation2014). Theoretical loss is sensitive to house advantage and therefore the same money stake can reflect more or less risk of loss depending on the specific game where it is staked. Theoretical loss is also robust against single extreme wins or losses and gives a stable measure of the risk an individual is willing to take while gambling. Still, there appears to be lack of research demonstrating a direct link between theoretical loss and disordered gambling. Despite this, gambling expenditure, which theoretical loss is a modified version of, have consistently been associated with disordered gambling (Braverman & Shaffer, Citation2012; Deng et al., Citation2021; Dragicevic et al., Citation2011; Fiedler et al., Citation2019; Grönroos et al., Citation2021).
Previous behavioral tracking studies have also used self-exclusion from gambling as a proxy indicator of disordered gambling in the absence of a direct measure of disordered gambling (Finkenwirth et al., Citation2021; Haefeli et al., Citation2011; Haeusler, Citation2016). As such, a sensitivity analysis was conducted examining the relationship between categories of theoretical loss and self-exclusion. The results indicated that theoretical loss between both the 50–90th percentile and at the 90th percentile and above were associated with more self-exclusions from gambling (Norsk Tipping globally or Multix specifically) compared to theoretical loss below the 50th percentile. However, the highest proportion of self-exclusions was in the 50–90th percentile, and not the 90th percentile and above. It should, however, be noted that self-exclusion is itself a limited proxy measure for disordered gambling because individuals may choose to self-exclude for reasons other than having a gambling problem (e.g. being annoyed with the gambling operator) (Catania & Griffiths, Citation2021).
Individuals differ in the amount of money they have available for gambling – what is termed gambling affordability. Differences in theoretical loss, and other measures of gambling expenditure, should be discussed in relation to this. In the present study, older individuals had higher theoretical loss compared to younger individuals and older individuals tend to have higher incomes. However, it is notable that the oldest age groups (60–69 years and 70+ years) had the highest theoretical loss as national statistics show these age groups also have lower median income compared to younger adults in Norway (Statistics Norway, Citation2023). Sensitivity analyses on gambling frequency were also carried out which is another indicator that has been found to be positively associated with disordered gambling (Braverman & Shaffer, Citation2012; Brosowski et al., Citation2021; Jonsson et al., Citation2022; LaPlante et al., Citation2014), including among Norsk Tipping customers specifically (Jonsson et al., Citation2022). The results from the sensitivity analyses largely mirrored the analyses on theoretical loss, i.e. older individuals had higher gambling frequency compared to younger individuals, and age differences were more pronounced among men.
Strengths and limitations
The present study was strengthened by examining a complete population of gamblers totaling 195,318 over nearly six years. The study took an age-specific and gender-specific approach to understand gambling intensity, notably including participants across the full adult lifespan (age ranged from 18 to 103 years). The high number of participants ensured strong representation even among the oldest age groups broken down by gender. Use of behavioral tracking data made it possible to avoid limitations of social desirability and recall bias which can limit self-report data (Griffiths, Citation2014; Shaffer et al., Citation2010). This may be especially beneficial when analyzing theoretical loss and other measures of gambling expenditure as previous research suggests that gamblers underestimate their losses when self-reporting (Braverman et al., Citation2014; M. Auer & Griffiths, Citation2017). Motivated by a public health approach, the present study focused on annual trends for different age groups of men and women rather than on individual trajectories. The use of quantile regression enabled the observation that age-related differences were more pronounced among men compared to women. Quantile regression is robust to outliers and allows for examination of different parts of the distribution, which accommodates the typical skewed distribution of gambling behavior (Deng et al., Citation2021; Fiedler et al., Citation2019).
The study also had some limitations that should be mentioned. Notably, the study did not assess disordered gambling directly, although previous studies linking gambling expenditure with disordered gambling, theoretical loss’ association with higher self-exclusion rates, and the sensitivity analysis on gambling frequency can be taken to suggest that older individuals’ and women playing Multix might experience more gambling harm/disordered gambling (as discussed above). Use of behavioral tracking data also poses risks as recorded gambling behavior is tied to individual player-account cards which can be shared with others (despite being prohibited). Norsk Tipping also acknowledges this issue, although it is unclear to what extent it influences data accuracy (Norsk Tipping, Citation2020). Age was treated as a categorical variable in the present study to allow for potential non-linear effects and so the findings could be related to different life periods of adult life. However, this approach can also pose some limitations as the chosen categories constitute rough approximations of different life periods of adult life and since age categorization can be performed in various ways, implying that choosing different cutoffs for age groups could lead to different results. The present study is also limited to a population of Norwegian Multix gamblers which put restrictions on the generalizability to other types of EGMs and in other national settings. Finally, studies on behavioral tracking data often lack information about contextual variables (e.g. income, personality, cognitive factors) which can be redeemed by combining this type of data with other data types (e.g. survey data).
Implications and conclusion
The results of the present study emphasize the importance of accounting for gambling type when discussing risky gambling and preventive efforts. Disordered gambling is typically associated with men and young age, but the present results suggest that this might not be the case among land-based EGM gamblers in Norway. Future studies should investigate if older individuals and women show similar patterns of gambling intensity in other EGM populations and examine if the demographic pattern also translates to direct measures of gambling harm and/or disordered gambling within such EGM populations. Such findings could then be used to inform preventive efforts targeting EGM gamblers. The findings of the present study also showed that women have less age-related differences in gambling at the 90th percentile compared to the median and 25th percentile. If women with high gambling intensity show less age-related differences compared to average and low gambling intensity in other studies, this would suggest that it is more important to take age into account when targeting women in low and average gambling intensity groups compared to women at high intensity.
Pallesen
There are several interventions that have been shown to be effective in reducing theoretical loss among gamblers in a natural setting. Auer et al. (Citation2018) found that Norsk Tipping customers receiving a reminder of exceeding 80% of the personally set loss limit reduced subsequent theoretical loss. Jonsson et al. (Citation2019, Citation2020) employed a randomized-controlled trial design and found that a brief motivational contact based on personalized feedback reduced theoretical loss among those with the 0.5 highest percentile of theoretical loss. A one-year follow-up showed a 30% reduction in theoretical loss for those contacted over telephone and 13% reduction for those contacted over mail. Finally, M. M. Auer and Griffiths (Citation2015, Citation2016) found that receiving personalized feedback on actual gambling behavior can reduce theoretical loss.
Overall, the present study finds support for age and gender differences in annual trends of gambling intensity. If these findings were replicated among other land-based EGM populations and with more direct measures of gambling harm/disordered gambling they would have implications for prevention of risky and disordered gambling. Older individuals and women would then appear to represent a more vulnerable segment of the EGM population which would make it important to prioritize these groups with responsible gambling interventions.
Conflictof Interest
The authors report that there are no constraints on publishing and no additional competing interests to declare.
Supplemental Material
Download MS Word (748.3 KB)Disclosure statement
The study was funded by the Research Council of Norway, grant number 273718. Study data were provided by the Norwegian gambling operator, Norsk Tipping. The funding agency and data provider had no influence on the study design, data analyses, or data interpretation.
MDG’s university has received research funding from Norsk Tipping (the gambling operator owned by the Norwegian Government). MDG has also received funding for a number of research projects in the area of gambling education for young people, social responsibility in gambling and gambling treatment from Gamble Aware (formerly the Responsible Gambling Trust), a charitable body which funds its research program based on donations from the gambling industry. MDG regularly undertakes consultancy for various gaming companies in the area of social responsibility in gambling.
Supplementary material
Supplemental data for this article can be accessed online at https://doi.org/10.1080/14459795.2023.2199051.
Additional information
Funding
Notes on contributors
André Syvertsen
André Syvertsen is a clinical psychologist (Cand. Psychol.) and Ph.D candidate at the Department of Psychosocial Science, University of Bergen. His main research interests include quantitative and qualitative research on gaming and gambling problems.
Tony Leino
Tony Leino has a background in health promotion and health psychology, Faculty of Psychology, University of Bergen. He defended his PhD thesis at the same institution in 2018 and is currently working at the Norwegian Institute of Public Health. His main research interests include health behavior, gambling and statistical modeling.
Ståle Pallesen
Ståle Pallesen graduated from the Professional School of Psychology, Faculty of Psychology, University of Bergen, Norway, in 1997. He defended his PhD thesis at the same institution in 2002, and since 2007 has worked there as a professor. His main research interests include sleep and addictions.
Otto R.F. Smith
Robert Smith graduated with a PhD in medical psychology at Tilburg University, the Netherlands in 2009. He is currently a research professor at the Norwegian Institute of Public Health. His main research interests include mental health, intervention research, and statistics.
Rune A. Mentzoni
Rune Aune Mentzoni is an associate professor at the University of Bergen, Norway. At the same institution, he graduated as a clinical psychologist in 2006, and defended his PhD in 2013. His main research interests involve the psychology of gaming and gambling.
Mark D. Griffiths
Dr. Mark Griffiths is Distinguished Professor of Behavioural Addiction at the Nottingham Trent University, and Director of the International Gaming Research Unit. He is internationally known for his work on gambling and gaming addictions has published over 1300 refereed research papers, six books, and 180+ book chapters.
Eilin K. Erevik
Eilin Erevik has a PhD in psychology from the Faculty of Psychology, University of Bergen, Norway. She has worked at the same institution since 2019 as an associate professor. Her main research interests include personality and addictions
References
- Abarbanel, B. L. (2014). Differences in motivational dimensions across gambling frequency, game choice and medium of play in the United Kingdom. International Gambling Studies, 14(3), 472–491. https://doi.org/10.1080/14459795.2014.966131
- Allami, Y., Hodgins, D. C., Young, M., Brunelle, N., Currie, S., Dufour, M., Flores-Pajot, M. -C., & Nadeau, L. (2021). A meta-analysis of problem gambling risk factors in the general adult population. Addiction, 116(11), 2968–2977. https://doi.org/10.1111/add.15449
- Ariyabuddhiphongs, V. (2012). Older adults and gambling: A review. International Journal of Mental Health and Addiction, 10(2), 297–308. https://doi.org/10.1007/s11469-011-9325-6
- Auer, M., & Griffiths, M. D. (2014). An empirical investigation of theoretical loss and gambling intensity. Journal of Gambling Studies, 30(4), 879–887. https://doi.org/10.1007/s10899-013-9376-7
- Auer, M., & Griffiths, M. D. (2017). Self-reported losses versus actual losses in online gambling: An empirical study. Journal of Gambling Studies, 33(3), 795–806. https://doi.org/10.1007/s10899-016-9648-0
- Auer, M., Hopfgartner, N., & Griffiths, M. D. (2018). The effect of loss-limit reminders on gambling behavior: A real-world study of Norwegian gamblers. Journal of Behavioral Addictions, 7(4), 1056–1067. https://doi.org/10.1556/2006.7.2018.106
- Auer, M. M., & Griffiths, M. D. (2015). The use of personalized behavioral feedback for online gamblers: An empirical study. Frontiers in Psychology, 6, 1406. https://doi.org/10.3389/fpsyg.2015.01406
- Auer, M. M., & Griffiths, M. D. (2016). Personalized behavioral feedback for online gamblers: A real world empirical study. Frontiers in Psychology, 7, 1875. https://doi.org/10.3389/fpsyg.2016.01875
- Baggio, S., Gainsbury, S. M., Starcevic, V., Richard, J. -B., Beck, F., & Billieux, J. (2018). Gender differences in gambling preferences and problem gambling: A network-level analysis. International Gambling Studies, 18(3), 512–525. https://doi.org/10.1080/14459795.2018.1495750
- Baguley, T. (2009). Standardized or simple effect size: What should be reported? British Journal of Psychology, 100(3), 603–617. https://doi.org/10.1348/000712608X377117
- Balodis, S. R. S., Thomas, A. C., & Moore, S. M. (2014). Sensitivity to reward and punishment: Horse race and EGM gamblers compared. Personality and Individual Differences, 56, 29–33. https://doi.org/10.1016/j.paid.2013.08.015
- Botterill, E., Gill, P. R., McLaren, S., & Gomez, R. (2016). Marital status and problem gambling among Australian older adults: The mediating role of loneliness. Journal of Gambling Studies, 32(3), 1027–1038. https://doi.org/10.1007/s10899-015-9575-5
- Braverman, J., & Shaffer, H. J. (2012). How do gamblers start gambling: Identifying behavioural markers for high-risk internet gambling. European Journal of Public Health, 22(2), 273–278. https://doi.org/10.1093/eurpub/ckp232
- Braverman, J., Tom, M. A., & Shaffer, H. J. (2014). Accuracy of self-reported versus actual online gambling wins and losses. Psychological Assessment, 26(3), 865–877. https://doi.org/10.1037/a0036428
- Brosowski, T., Olason, D. T., Turowski, T., & Hayer, T. (2021). The gambling consumption mediation model (GCMM): A multiple mediation approach to estimate the association of particular game types with problem gambling. Journal of Gambling Studies, 37(1), 107–140. https://doi.org/10.1007/s10899-020-09928-3
- Browne, M., Rawat, V., Greer, N., Langham, E., Rockloff, M., & Hanley, C. (2017). What is the harm? Applying a public health methodology to measure the impact of gambling problems and harm on quality of life. Journal of Gambling Issues, 36(36), 28–50. https://doi.org/10.4309/jgi.2017.36.2
- Browne, M., & Rockloff, M. J. (2018). Prevalence of gambling-related harm provides evidence for the prevention paradox. Journal of Behavioral Addictions, 7(2), 410–422. https://doi.org/10.1556/2006.7.2018.41
- Calado, F., Alexandre, J., & Griffiths, M. D. (2017). Prevalence of adolescent problem gambling: A systematic review of recent research. Journal of Gambling Studies, 33(2), 397–424. https://doi.org/10.1007/s10899-016-9627-5
- Calado, F., & Griffiths, M. D. (2016). Problem gambling worldwide: An update and systematic review of empirical research (2000–2015). Journal of Behavioral Addictions, 5(4), 592–613. https://doi.org/10.1556/2006.5.2016.073
- Canale, N., Vieno, A., & Griffiths, M. D. (2016). The extent and distribution of gambling-related harms and the prevention paradox in a British population survey. Journal of Behavioral Addictions, 5(2), 204–212. https://doi.org/10.1556/2006.5.2016.023
- Castrén, S., Heiskanen, M., & Salonen, A. H. (2018). Trends in gambling participation and gambling severity among finnish men and women: Cross-sectional population surveys in 2007, 2010 and 2015. BMJ Open, 8(8), e022129. https://doi.org/10.1136/bmjopen-2018-022129
- Catania, M., & Griffiths, M. D. (2021). Understanding online voluntary self-exclusion in gambling: An empirical study using account-based behavioral tracking data. International Journal of Environmental Research and Public Health, 18(4), 2000. https://doi.org/10.3390/ijerph18042000
- Chagas, B. T., & Gomes, J. F. S. (2017). Internet gambling: A critical review of behavioural tracking research. Journal of Gambling Issues, 36(36), 1–27. https://doi.org/10.4309/jgi.2017.36.1
- Currie, S. R., Hodgins, D. C., Wang, J., el-Guebaly, N., Wynne, H., & Chen, S. (2006). Risk of harm among gamblers in the general population as a function of level of participation in gambling activities. Addiction, 101(4), 570–580. https://doi.org/10.1111/j.1360-0443.2006.01392.x
- Delfabbro, P., King, D. L., & Griffiths, M. (2012). Behavioural profiling of problem gamblers: A summary and review. International Gambling Studies, 12(3), 349–366. https://doi.org/10.1080/14459795.2012.678274
- Deng, X., Lesch, T., & Clark, L. (2019). Applying data science to behavioral analysis of online gambling. Current Addiction Reports, 6(3), 159–164. https://doi.org/10.1007/s40429-019-00269-9
- Deng, X., Lesch, T., & Clark, L. (2021). Pareto distributions in online casino gambling: Sensitivity to timeframe and associations with self exclusion. Addictive Behaviors, 120, 106968. https://doi.org/10.1016/j.addbeh.2021.106968
- Dragicevic, S., Tsogas, G., & Kudic, A. (2011). Analysis of casino online gambling data in relation to behavioural risk markers for high-risk gambling and player protection. International Gambling Studies, 11(3), 377–391. https://doi.org/10.1080/14459795.2011.629204
- Elton-Marshall, T., Wijesingha, R., Sendzik, T., Mock, S. E., van der Maas, M., McCready, J., Mann, R. E., & Turner, N. E. (2018). Marital status and problem gambling among older adults: An examination of social context and social motivations. Canadian Journal on Aging/La Revue canadienne du vieillissement, 37(3), 318–332. https://doi.org/10.1017/S071498081800017X
- Fiedler, I., Kairouz, S., Costes, J. -M., & Weißmüller, K. S. (2019). Gambling spending and its concentration on problem gamblers. Journal of Business Research, 98, 82–91. https://doi.org/10.1016/j.jbusres.2019.01.040
- Finkenwirth, S., MacDonald, K., Deng, X., Lesch, T., & Clark, L. (2021). Using machine learning to predict self-exclusion status in online gamblers on the PlayNow.Com platform in British Columbia. International Gambling Studies, 21(2), 220–237. https://doi.org/10.1080/14459795.2020.1832132
- Gainsbury, S. M., Russell, A., Blaszczynski, A., & Hing, N. (2015). The interaction between gambling activities and modes of access: A comparison of internet-only, land-based only, and mixed-mode gamblers. Addictive Behaviors, 41, 34–40. https://doi.org/10.1016/j.addbeh.2014.09.023
- González-Ortega, I., Echeburúa, E., Corral, P., Polo-López, R., & Alberich, S. (2013). Predictors of pathological gambling severity taking gender differences into account. European Addiction Research, 19(3), 146–154. https://doi.org/10.1159/000342311
- Griffiths, M. (2014). The use of behavioural tracking methodologies in the study of online gambling. Sage Publications, Ltd. https://doi.org/10.4135/978144627305013517480
- Grönroos, T., Kouvonen, A., Kontto, J., & Salonen, A. H. (2021). Socio-demographic factors, gambling behaviour, and the level of gambling expenditure: A population-based study. Journal of Gambling Studies, 38(4), 1093–1109. https://doi.org/10.1007/s10899-021-10075-6
- Haefeli, J., Lischer, S., & Schwarz, J. (2011). Early detection items and responsible gambling features for online gambling. International Gambling Studies, 11(3), 273–288. https://doi.org/10.1080/14459795.2011.604643
- Haeusler, J. (2016). Follow the money: Using payment behaviour as predictor for future self-exclusion. International Gambling Studies, 16(2), 246–262. https://doi.org/10.1080/14459795.2016.1158306
- Holdsworth, L., Hing, N., & Breen, H. (2012). Exploring women’s problem gambling: A review of the literature. International Gambling Studies, 12(2), 199–213. https://doi.org/10.1080/14459795.2012.656317
- Husky, M. M., Michel, G., Richard, J. -B., Guignard, R., & Beck, F. (2015). Gender differences in the associations of gambling activities and suicidal behaviors with problem gambling in a nationally representative French sample. Addictive Behaviors, 45, 45–50. https://doi.org/10.1016/j.addbeh.2015.01.011
- Jonsson, J., Hodgins, D. C., Lyckberg, A., Currie, S., Young, M. M., Pallesen, S., & Carlbring, P. (2022). In search of lower risk gambling levels using behavioral data from a gambling monopolist. Journal of Behavioral Addictions, 11(3), 890–899. https://doi.org/10.1556/2006.2022.00062
- Jonsson, J., Hodgins, D. C., Munck, I., & Carlbring, P. (2019). Reaching out to big losers: A randomized controlled trial of brief motivational contact providing gambling expenditure feedback. Psychology of Addictive Behaviors, 33(3), 179–189. https://doi.org/10.1037/adb0000447
- Jonsson, J., Hodgins, D. C., Munck, I., & Carlbring, P. (2020). Reaching out to big losers leads to sustained reductions in gambling over 1 year: A randomized controlled trial of brief motivational contact. Addiction, 115(8), 1522–1531. https://doi.org/10.1111/add.14982
- Koenker, R., & Hallock, K. F. (2001). Quantile regression. Journal of Economic Perspectives, 15(4), 143–156. https://doi.org/10.1257/jep.15.4.143
- Langham, E., Thorne, H., Browne, M., Donaldson, P., Rose, J., & Rockloff, M. (2016). Understanding gambling related harm: A proposed definition, conceptual framework, and taxonomy of harms. BMC Public Health, 16(1), 80. https://doi.org/10.1186/s12889-016-2747-0
- LaPlante, D. A., Nelson, S. E., & Gray, H. M. (2014). Breadth and depth involvement: Understanding internet gambling involvement and its relationship to gambling problems. Psychology of Addictive Behaviors, 28(2), 396–403. https://doi.org/10.1037/a0033810
- Leino, T., Pallesen, D., Griffiths, M. D., Mentzoni, R. A., Sagoe, S., & Molde, H. (2017). Gambling behavior in alcohol-serving and non-alcohol-serving venues: A study of electronic gaming machine players using account records. Addiction Research & Theory, 25(3), 201–207. https://doi.org/10.1080/16066359.2017.1288806
- Li, E., Browne, M., Rawat, V., Langham, E., & Rockloff, M. (2017). Breaking bad: Comparing gambling harms among gamblers and affected others. Journal of Gambling Studies, 33(1), 223–248. https://doi.org/10.1007/s10899-016-9632-8
- Marchica, L. A., Keough, M. T., Montreuil, T. C., & Derevensky, J. L. (2020). Emotion regulation interacts with gambling motives to predict problem gambling among emerging adults. Addictive Behaviors, 106, 106378. https://doi.org/10.1016/j.addbeh.2020.106378
- McCarthy, S., Thomas, S. L., Randle, M., Bestman, A., Pitt, H., Cowlishaw, S., & Daube, M. (2018). Women’s gambling behaviour, product preferences, and perceptions of product harm: Differences by age and gambling risk status. Harm Reduction Journal, 15(1), 22. https://doi.org/10.1186/s12954-018-0227-9
- Merkouris, S. S., Thomas, A. C., Shandley, K. A., Rodda, S. N., Oldenhof, E., & Dowling, N. A. (2016). An update on gender differences in the characteristics associated with problem gambling: A systematic review. Current Addiction Reports, 3(3), 254–267. https://doi.org/10.1007/s40429-016-0106-y
- Norsk Tipping. (2020) Dreams and responsibility - norsk tipping annual and social report for 2019. https://2019.norsk-tipping.no/en/
- Orford, J. F., Griffiths, M. D., & Wardle, H. (2013). What proportion of gambling is problem gambling? Estimates from the 2010 British gambling prevalence survey. International Gambling Studies, 13(1), 4–18. https://doi.org/10.1080/14459795.2012.689001
- Pallesen, S., Mentzoni, R. A., Morken, A. M., Engebø, J., Kaur, P., & Erevik, E. K. (2021). Changes over time and predictors of online gambling in three Norwegian population studies 2013–2019. Frontiers in Psychiatry, 12, 390. https://doi.org/10.3389/fpsyt.2021.597615
- Pallesen, S., Pallesen, R. A., Erevik, E., Molde, H., & Morken, A. M. (2020). Omfang av penge- og dataspillproblemer i Norge 2019 [Extent of gambling and video game problems in Norway 2013]. Retrieved October 16, 2022, from https://www.uib.no/sites/w3.uib.no/files/attachments/omfang_av_penge-og_dataspillproblemer_i_norge_2019.pdf
- Parke, A., Griffiths, M., Pattinson, J., & Keatley, D. (2018). Age-related physical and psychological vulnerability as pathways to problem gambling in older adults. Journal of Behavioral Addictions, 7(1), 137–145. https://doi.org/10.1556/2006.7.2018.18
- R Core Team. (2022). R: A language and environment for statistical computing. R Foundation for Statistical Computing. https://www.R-project.org/
- Reisel, L., Østbakken, K. M., & Attewell, P. (2019). Dynamics of claims making and gender wage gaps in the United States and Norway. Social Politics: International Studies in Gender, State & Society, 26(1), 87–115. https://doi.org/10.1093/sp/jxy019
- Rossow, I., & Hansen, M. B. (2016). Gambling and gambling policy in Norway—An exceptional case. Addiction, 111(4), 593–598. https://doi.org/10.1111/add.13172
- Roukka, T., & Salonen, A. H. (2020). The winners and the losers: Tax incidence of gambling in Finland. Journal of Gambling Studies, 36(4), 1183–1204. https://doi.org/10.1007/s10899-019-09899-0
- Shaffer, H. J., & Korn, D. A. (2002). Gambling and related mental disorders: A public health analysis. Annual Review of Public Health, 23(1), 171–212. https://doi.org/10.1146/annurev.publhealth.23.100901.140532
- Shaffer, H. J., Peller, A. J., LaPlante, D. A., Nelson, S. E., & LaBrie, R. A. (2010). Toward a paradigm shift in internet gambling research: From opinion and self-report to actual behavior. Addiction Research & Theory, 18(3), 270–283. https://doi.org/10.3109/16066350902777974
- Statistics Norway. (2023). Income and wealth statistics for households. https://www.ssb.no/en/statbank/table/06946/tableViewLayout1/
- Sussman, S., & Arnett, J. J. (2014). Emerging adulthood: Developmental period facilitative of the addictions. Evaluation & the Health Professions, 37(2), 147–155. https://doi.org/10.1177/0163278714521812
- Tse, S., Hong, S. -I., Wang, C. -W., & Cunningham-Williams, R. M. (2012). Gambling behavior and problems among older adults: A systematic review of empirical studies. The Journals of Gerontology: Series B, Psychological Sciences and Social Sciences, 67(5), 639–652. https://doi.org/10.1093/geronb/gbs068
- Ukhov, I., Bjurgert, J., Auer, M., & Griffiths, M. D. (2021). Online problem gambling: A comparison of casino players and sports bettors via predictive modeling using behavioral tracking data. Journal of Gambling Studies, 37(3), 877–897. https://doi.org/10.1007/s10899-020-09964-z
- Venne, D., Mazar, A., & Volberg, R. (2020). Gender and gambling behaviors: A comprehensive analysis of (dis)similarities. International Journal of Mental Health and Addiction, 18(5), 1181–1195. https://doi.org/10.1007/s11469-019-00116-y
- Volberg, R. A., Gupta, R. S., Griffiths, M. D., Olason, D. T., & Delfabbro, P. H. (2010). An international perspective on youth gambling prevalence studies. International Journal of Adolescent Medicine and Health. https://doi.org/10.1515/IJAMH.2010.22.1.3
- Welte, J. W., Barnes, G. M., Tidwell, M. -C.O., & Wieczorek, W. F. (2017). Predictors of problem gambling in the U.S. Journal of Gambling Studies, 33(2), 327–342. https://doi.org/10.1007/s10899-016-9639-1
- Whiteford, S., Hoon, A. E., James, R., Tunney, R., & Dymond, S. (2022). Quantile regression analysis of in-play betting in a large online gambling dataset. Computers in Human Behavior Reports, 6, 100194. https://doi.org/10.1016/j.chbr.2022.100194
- Wood, R. T. A., & Griffiths, M. D. (2007). A qualitative investigation of problem gambling as an escape-based coping strategy. Psychology and Psychotherapy: Theory, Research and Practice, 80, 107–125.