
 ?Mathematical formulae have been encoded as MathML and are displayed in this HTML version using MathJax in order to improve their display. Uncheck the box to turn MathJax off. This feature requires Javascript. Click on a formula to zoom.
ABSTRACT
In this era of austerity, while there are significant fiscal pressures on social protection programs particularly on cash benefits, there is increasing rhetoric concerning the ‘social investment turn.’ Yet, some scholars question whether social investment policies are actually expanding. The evidence is not sufficiently apparent, and others question whether social protection policies have actually crowded out social investment policies. So far, few systematic studies have examined this issue. This research aims to explore the effect of traditional social protection on social investment policies in 18 OECD countries from 1980 to 2010. To investigate the predictive and causal relationships between the two types of policies, we will use the Granger panel analysis. Then, we will adopt the Beck & Katz panel model to analyze the crowding-out effect that social protection policies have on social investment. We argue that social protection has not crowded out social investment policies in general but, rather, that the positive link between them is increasingly weaker in recent years. In the end, we discuss the theoretical and policy implications of our findings.
Social investment and social protection: crowding-out or crowding-in effect?
An era of austerity has begun in advanced welfare states. Social spending has decreased or remained stagnant in most Organisation for Economic Co-operation and Development (OECD) countries. According to Elaesser, Rademacher, and Schaefer, ‘most countries still spend more today than in 1980, but less than at the peak’ (Citation2016, p. 4). It is undeniable that significant downsizing pressures have mounted on social protection programs, especially cash benefits. Yet, scholars pay attention to the ‘social investment turn’ as the new mode for restructuring the existing welfare state. The social investment perspective can be seen as an emerging policy paradigm to modernize and restructure the welfare state and to better address new social risks and demands in the knowledge-based economy – increasing the political and financial sustainability of the welfare state (Morel, Palier, & Palme, Citation2012; Nolan, Citation2013). Particularly, it emphasizes both human capital, and the necessary skills and creativity, and self-sufficiency via employment, which are key to achieving economic prosperity.
Broadly speaking, social investment (SI) could include all welfare state programs. In a narrower sense, however, SI has been understood as policy or expenditure that directly aims to enhance an individuals’ productive capacity while simultaneously solving social problems (Lundvall & Lorenz, Citation2012). Typically, it includes policies or expenditures related to human capital improvement, families’ relationships with the economy, and activation policies for employment (Hemerijck, Citation2012; Prandini, Orlandini, & Guerra, Citation2016). In empirical studies, scholars tend to include child- and family-related policies, education, and active labor market policies as SI policies (Nikolai, Citation2012; Kuitto, Citation2016).
During the last decade, many researchers have written on SI, but many important questions on the SI turn still remain. Some scholars identify that large welfare states with generous social protection (SP), such as Nordic states, tend to develop SI policies whereas small welfare states do not. According to this observation, SP policies tend to expand together with SI – the ‘crowding-in’ effect. However, others have questioned whether existing SP policies crowd out the development of SI or whether the rise of SI policies comes at the price of SP – the ‘crowding-out’ effect – particularly in times of budgetary austerity (Bonoli & Reber, Citation2010; Deeming & Smyth, Citation2015; Nikolai, Citation2012). If SP hinders SI development, it would also impede welfare states from adapting to the new environment. On the contrary, if SI is developed while reducing SP, inequality can be reinforced (Bonoli, Cantillon, & Van Lancker, Citation2017; Busemeyer, Garritzmann, Neimanns, & Nezi, Citation2018).
In this respect, scholars commonly emphasize the importance of balancing protection strategy and investment strategy – not only ‘stock’ and ‘flow’ but also ‘buffer’ (Hemerijck, Citation2017; Vandenbroucke & Vleminckx, Citation2011). While the trade-off question between SP and SI is the crucial theoretical and policy question for establishing the better SI paradigm, few studies have systematically investigated the relationship between them. Therefore, this paper aims to analyze and discuss their relationship and whether there is the companion effect or the crowding-out effect. This research comprehensively examines the relationships of 18 welfare state regimes, through different SI policies and different time periods from the 1980s to the 2000s. We argue that SP has not crowded out SI policies in general, but the relationship varies across welfare states, time periods, and SI policies. Also, the positive link between SI and SP has become increasingly weaker in recent years. In the end, we will discuss the theoretical and policy implications of the findings.
Literature review
Before the discussion of the SI paradigm, several studies have witnessed the rise of service (in-kind) spending as opposed to cash transfers since the 1990s, and the resulting conflicts between the two types of spending (Castles, Citation2005; Kautto, Citation2002). Existing welfare regime studies, though neglecting service benefits, assume that the social policies within a welfare regime tend to uniformly change and move within an overarching logic. However, Kasza (Citation2002) refuted this argument, arguing for ‘the illusion of welfare regimes,’ where each policy area has its own diverse history, a different set of policy actors, and variations in its policy-making process. In subsequent studies, scholars found that key variables that produced the welfare service or health expansion were different from those explaining the expansion of cash transfers (Castles, Citation2009; Jensen, Citation2008). Though these studies did not explicitly examine the trade-off between cash and service spending in the welfare state, they do provide a foundation for questioning the possible crowding-out effect of SI spending.
Some scholars have regarded SI as a paradigm shift and a new vanguard of the welfare state (Morel et al., Citation2012) and have often proposed it as an alternative to the age-biased welfare state. The growing emphasis on SI has changed the welfare state from old to new social risks, from cash benefits to social services, and from ex-post remedies to ex-ante prevention (De Deken, Citation2014). On the one hand, SI’s human capital enhancements and emphasis on employment and the reproductive sphere of the family via education and employment policies supported by social services have been applauded as the new solution to the lingering welfare state (Hemerijck, Citation2011). On the other hand, as Vandenbroucke and Vleminckx (Citation2011) noted, the SI paradigm may be shifting resources away from programs that are more redistributive to programs that are less so, and it may be contributing to a recommodification and retrenchment of unemployment benefits. In this respect, the SI paradigm could reduce the redistributive cash benefits and boost spending that could push individuals back into the labor market.
However, studies also challenge whether there is actually an SI turn or not. The usual suspect is that ever-increasing spending on old-age pensions fundamentally hinders the development of SI policies within the limited budget. In some welfare states, the spending on old-age pensions has reached around 15% of the gross domestic product (GDP) and the growing old-age dependency ratio will be another pressure on the welfare state. In this context, it would be difficult to increase SI spending. Yet, there is a positive scenario on the trade-off between SP and SI. The welfare state developing SI policies could effectively enjoy the advantage of saving SP spending (Esping-Andersen, Citation2002).
Several studies attempt to address this issue. Vandenbroucke and Vleminckx (Citation2011), Nikolai (Citation2012), and Kuitto (Citation2016) attempted to empirically examine the relationship between the two types of spending. They divided social expenditures into compensatory and investment spending and investigated whether resource competition exists. Vandenbroucke and Vleminckx (Citation2011) and Nikolai (Citation2012) descriptively observed the change in these two expenditures over decades. Although they found new social risk benefits increased whereas old social risk benefits decreased, they concluded that there was not a clear consistent trade-off between the two types of policies. SI spending, except for family policies, has not increased significantly, while old-age expenditures have been increasing alongside demographic changes.
Kuitto (Citation2016) also analyzed 23 European countries to determine whether there were trade-offs between SP and SI – reviewing the change of expenditures on SI and SP from a life-course perspective: from childhood and youth, to working age, and finally, through old age. He confirmed the SI turn to some extent but found substantial cross-regime and cross-policy variations. Between 2000 and 2010, Nordic countries, together with the UK and Ireland, maintained or increased SI spending on childhood and youth, whereas that type of spending stayed low in Central, Eastern, and Southern European countries where SI was needed the most. Kuitto did not find a trade-off relationship between the two types of spending, though six countries including the UK, Germany, and Sweden showed signs of such a trade-off. Compared to previous studies, his spending profile approach reveals a more systematic pattern between the two types of expenditures but, as a descriptive analysis, cannot reveal the causal relationship between them.
In contrast, Bonoli and Reber (Citation2010) and Busemeyer and Neimanns (Citation2017) examined the conflictive nature of these expenditure types beyond a descriptive analysis. First, using the micro dataset, Busemeyer and Neimanns (Citation2017) explored the competitive relationship between the two kinds of expenditures by examining whether the provision of unemployment benefits impacted childcare service policies and vice versa. They successfully revealed the trade-off between the two, although the research was limited to individual attitudes, which may not effectively reflect actual expenditure patterns. Bonoli and Reber (Citation2010) reviewed the effect of old-age spending on childcare spending while controlling socio-economic and political variables, including the female employment rate and the presence of left-wing or religious parties in Parliament. In addition, Bonoli (Citation2013) examined the crowding-out effect of old-age spending on active labor market policies (ALMPs) spending. According to these studies, old-age spending has a negative effect on both family services and ALMP spending, and a causal relationship and conflictive nature were revealed. However, further research is required because the results do not illuminate the comprehensive dynamics between SP and SI, such as the relationship between unemployment and ALMP expenditures. Also, these results do not show the temporal dimension of the relationship between the two types of spending or the cross-regime variations. Because the results indicating a ‘trade-off’ have been mixed, this research aims to adopt a rigorous method to re-examine the causal relationship and to revisit the question of the crowding-out effect between SP and SI. The following are key hypotheses.
Hypothesis 1: Higher social protection spending is likely to decrease social investment spending (crowding-out effect).
H1–1: Higher old-age spending is likely to decrease family spending.
H1-2: Higher unemployment spending is likely to decrease ALMP spending.
The first hypothesis investigates resource competition and the crowding-out effect. First, we will test the effect of SP spending on SI spending at an aggregate level. We are primarily interested in the effect of SP on SI, rather than that of SI on SP, because SP policies developed much earlier and the spending level is also much higher than SI spending. Nevertheless, we will also use the Granger panel analysis to examine whether SI could be a precondition for SP. Then, after disaggregating the spending, we will analyze the crowding-out effect at the policy level. According to the previous studies, ‘passive’ unemployment benefits often contrasts with ‘active’ labor market programs, whereas old-age pensions and family policies tend to be discussed together (Bonoli & Reber, Citation2010; Martin & Grubb, Citation2001). We predict the effects of old-age spending on family spending and of unemployment spending on ALMP spending, as a result of resource competition (Elsässer, Rademacher, & Schäfer, Citation2015).
Hypothesis 2: The crowding-out effect is unlikely to exist in a social-democratic state, whereas it is likely to exist in conservative welfare states. There is likely to be an inconsistent crowding-out effect in liberal welfare states.
The second hypothesis relates to the effect of welfare regimes. Some scholars have found the interactive pattern between the two spending types varies among different types of welfare states. Studies have divided the two types of SI states: Nordic-type ‘thick’ SI states and UK-type ‘thin’ SI states (Deeming & Smyth, Citation2015; Morel et al., Citation2012). The former tends to have both SP and SI, whereas the latter sacrifices SP spending for SI. Morel et al. (Citation2012) proposes two additional models: the traditional compensatory welfare model and the hidden welfare model, as illustrated in . However, there is very little empirical evidence confirming the four types, including whether there is a causal relationship between the two. While Morel et al. (Citation2012) argue that egalitarian societies are more successful in implementing SI policies and desired outcomes, the relationship between SI and SP needs to be empirically scrutinized beyond case observations.
Hypothesis 3: The crowding-out effect is likely to be stronger in the later period (1996–2010) than in the earlier period (1980–1995).
Table 1. Four worlds of social investment.
Entering this era of ‘permanent austerity,’ welfare states are increasingly confronting budgetary pressures (Kuitto, Citation2016). Earlier studies witnessed the path dependency of the welfare state without much retrenchment (e.g., Pierson, Citation1994), but increases in social spending have become less prevalent in recent years. We predict that countries with higher SP spending are unlikely to increase SI spending. In other words, there is a high possibility of the crowding-out effect in recent years compared to the late twentieth century.
Research methodology
Granger panel causality and Beck and Katz’s 1995 panel model
The fundamental assumption of studies on the crowding-out effect is that interdependence exists between government budget categories in the process of funding services and benefits (Berry & Lowery, Citation1990). In other words, as one budget grows, the other budget decreases within a limited total sum. A leading example is the budget allocation process for elderly and child services, as found in Bonoli and Reber (Citation2010). Based on the concept of path dependency, they claimed to prove that pension policies for the elderly constrained the development of new family policies. However, it is difficult for their study to conclude that old age expenditures have a direct causality with childcare expenditures due to their analytical method, which did not explore beyond the variables and indicators. Therefore, this study aims to explore the changing interrelationship between SP and SI expenditures by applying the Granger causality test, which can identify the relationship order by applying a time lag.
The concept of Granger causality starts from the probabilistic premise that the past can influence the present or the future. That is, the causality in the Granger verification is analyzed as a predictive relationship (preceding-event and post-event) rather than a logical relationship (cause and effect): ‘The Granger causality is bound to be valid between Variable A and Variable B’ and ‘Variable A precedes Variable B’ (Hamilton, Citation1994). However, in the Granger causality examination, it is assumed that the information that adequately predicts the respective variables is included in the time-series data of these variables. Cross-national comparative studies have faced limitations because the analysis unit is necessarily one country. Thus, this study applied the Granger causality test to panel data (hereafter, the Granger panel analysis) recently devised by Dumitrescu and Hurlin (Citation2012). Unlike the Granger causality analysis (Hurlin & Venet, Citation2003), the Granger panel analysis, with its new measurement technique, can analyze respective panels. In sum, the Granger panel analysis has the advantage of statistically examining the direction of temporal relationships by reflecting the time differences between the self-variable and the other variables.
The Granger panel analysis, however, has the limitation of being unable to control other factors that influence dependent variables. For that reason, this study will subsequently conduct the panel analysis to estimate the net effect of SP variables that influence SI expenditures. If a temporal preceding relationship between the historical value of the ‘X’ variable and the current value of the ‘Y’ variable is proven, a subsequent panel analysis can be performed to interpret the results. Thus, the empirical analysis flow of this study can be organized into the following steps: (1) the overall picture based on the descriptive analysis of 18 OECD countries, (2) the analysis of the correlation between SP and SI expenditures according to time periods and welfare regimes, (3) the Granger panel analysis, and (4) the panel analysis.
The specific model suggested for the Granger panel causality test by Dumitrescu and Hurlin (Citation2012) and the panel model suggested by Beck and Katz (Citation1995, p. 634) are included below. Because this Granger panel analysis is examined based on panel data and not by time-series data, section αi in the aforementioned formula (1) refers to group heterogeneity. This is the coefficient that explains whether the historical variable of X is the Granger cause of Y.Footnote1
The panel analysis has the advantage of solving the small-N problem, but the panel data can lead to problems of heteroscedasticity, autocorrelation, and contemporaneous correlation in error terms, which can be against the basic assumptions of the panel analysis. As for the panel analysis, we adopt the model of Beck and Katz (Citation1995, p. 634), who criticize the general least square (GLS) method for under-evaluating the standard error (SE). Instead, they propose a new calculation of the SE by considering heteroscedasticity and the contemporaneous correlation of panel data. shows the treatment measure for violation of the basic assumptions (Plümper, Troeger, & Manow, Citation2005).
Table 2. Treatment measure for violation of the basic assumptions.
Research variables and scope
First, the main purpose of the panel analysis is to examine whether or not the level of SP spending affects SI expenditures. Therefore, the independent variable is SP expenditures and SI spending is the dependent variable. There are slight differences among scholars about what are SP and SI policies. We follow Nikolai’s SP and SI classification (Citation2012). Here, we include pension and unemployment spending, which are the key components of SP in policy and political terms. As for SI policies, we focus on family policy spending and ALMP spending, which have been the ‘stars’ of the social investment approach. One of the key differences between Nikolai and other scholars is that Nikolai regards family policy – spending on the younger generation – as SI, regardless of cash or in-kind benefits, which is unlike others who classify only childcare services as SI. Similar to Nikolai (Citation2012), we consider cash benefits for children as SI policies. Education is also a core social investment approach, but existing studies tend to separate education from other SI policies because its policy logic and public support are rather different from the others’ (e.g. Busemeyer et al., Citation2018).
We include the following sets of control variables proven to be significant in welfare state reforms. Socio-economic variables consist of economic and social transformations that trigger new social risks: ageing, deindustrialization, and globalization (Bonoli, Citation2013; Busemeyer & Garritzmann, Citation2017). Political variables include the leftist party’s power, which is based on the power resources theory, and women’s representation in Parliament, i.e., gender politics (León, Choi, & Ahn, Citation2016). The operationalization and data source of each variable is shown in .
Table 3. Analytical variables.
The period covered by this study is 1980 to 2010. The reconstruction of the welfare state started in the 1980s, as significant downsizing pressure had been placed on SP programs. Then, SI strategies emerged as a new policy framework in the 1990s. In the 2000s, an era of austerity commenced again in western welfare states. The analysis covers 18 welfare states used in Esping-Andersen (Citation1990). We classify Australia, Canada, Ireland, Japan, New Zealand, Switzerland, the United Kingdom, and the United States as liberal welfare states. Austria, Belgium, France, Germany, Italy, and the Netherlands are classified as conservative welfare states, and Denmark, Finland, Norway, and Sweden are social democratic welfare states. We will analyze the effect of SP on SI policies due to different welfare state regimes, different time periods, and different SI policies.
Analytical results
shows the spending level of SP and SI by 18 OECD countries from 1980 to 2010. Since the 1980s, fluctuations of SP spending are found in some welfare states, whereas spending levels have not changed much in other states. Overall expenditures have continuously grown in France, Italy, and Japan but have considerably decreased after the 1980s in Ireland, New Zealand, and the Netherlands. The inverse V-shape is observed in Sweden, Finland, and Canada to some extent. In general, social spending increased after the financial crisis in 2007, but the figure shows a divergence of SP spending patterns rather than a convergence.
The patterns of SI spending also vary. Unlike SP spending, SI spending has not been changed much in Japan, Italy, and the Netherlands. In some countries, such as Sweden and Norway, the two types of spending have moved together, whereas they have moved in the opposite direction in other countries, e.g., New Zealand and Ireland. This opposite trend in these states seems to follow socioeconomic changes, and the trend is clearer in some states, such as Ireland, the Netherlands, and Japan. Overall, spending patterns over the last three decades and the relationships between the two types of spending vary across welfare states.
Figure 1. Time-series of SI and SP expenditures.
shows the correlation analysis (CA) graph between SI (x) and SP (y) by welfare state regimes. The 18 OECD countries’ correlation analysis graph in the top left shows the positive relationship between SI and SP. That is, as SP increases, SI also increases. The slope of the correlation analysis targeting 18 OECD countries is +0.53, and it has been found to be statistically significant (P value < 0.05). Conservative welfare states show the highest positive correlation of +0.75.
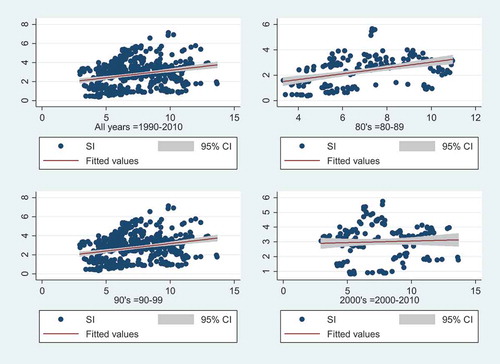
shows the CA between SP and SI from 1980 to 2010 for different time periods. The CA’s slope becomes lower over time; the statistically significant inclinations were 0.71 in the 1980s, 0.53 in the 1990s, and 0.29 in 2000s. This can be interpreted, as existing studies imply, that SP spending has increasingly lost its connection to SI spending as budgetary pressures have increased and social policies have matured over time. Yet, the crowding-out or crowding-in hypothesis needs further analysis.
Figure 2. Relationships between SP(x) and SI(y) by welfare regime.
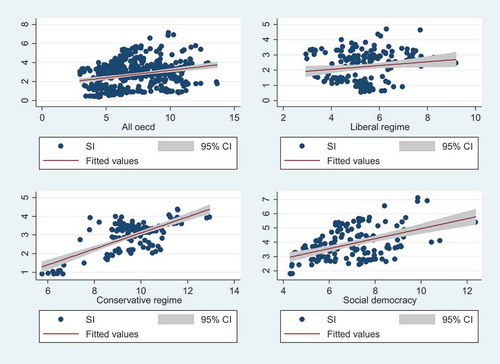
Figure 3. Relationships between SP(x) and SI(y) by period.
Granger panel analysis
illustrates the Granger panel analysis results. First, regarding all 18 nations, the null hypothesis that SI is not the predisposing factor of SP was rejected at a 95% significance level (p < .05) and the null hypothesis, that SP is not the predisposing factor, of SI was rejected at a 99% significance level (p < .01). Therefore, the Granger panel analysis that targeted 18 OECD member countries from 1980 to 2010 proved this study’s hypothesis that SP is the predisposing factor of the development of SI. Also, SI was found to be the predisposing factor of SP, which shows that the development of the two systems influenced each other dynamically.
In social democratic regimes that developed SI policies earlier than others, the SP spending preceded the SI spending. In other words, the empirical analysis implies that increases of SI spending were possible based on the progress of income security policies. However, SI was not statistically meaningful in preceding with SP spending. In conservative states, the opposite results are found. The progress of SP does not contribute to SI. Conversely, the development of SI has been found to precede SP. There is no preceding relationship in liberal welfare states. In terms of different periods, from 1980 to 1995, the interaction between SP and SI was mutually reinforcing. However, as the austerity pressure grew from 1996 to 2010, SP was not the predisposing factor of SI (SP ⇏ SI). Rather, SI acted as the predisposing factor of SP.
In addition, the Granger cause and effect analysis of pension expenditures and family policies was conducted, and illustrates the interactions. Because the two types of spending increased in the same direction and have pre- and post-temporal relationships with each other, they do not crowd one another out. This result seems to stand in contrast with the results of Bonoli and Reber (Citation2010) and Bonoli (Citation2013).
Table 4. The granger panel analysis of the social protection (SP) and social investment (SI) expenditures (1980–2010).
Panel analysis
Next, we conducted the panel analysis to explore the net effect of SP spending on SI spending. shows the influence of SP on SI in different welfare state regimes. According to the analysis, the institutional variables representing SP policies had mixed results. The pension spending positively affected the SI spending, whereas the unemployment spending had a negative effect. This spending pattern is found in liberal and social democratic welfare states. In conservative welfare states, however, the spending on unemployment positively affects SI spending, but not the pension spending. Instead, the proportion of the older population negatively influenced the SI spending. For conservative welfare states, it is more important to revitalize the labor market through both passive and active policies.
Table 5. Determinants of social investment expenditures by welfare regime.
When it comes to the socio-economic effect on SI expenditures, as the Gini coefficient becomes lower, SI spending is likely to be higher. This confirms that social investment is developed in the so-called egalitarian states, as argued by Morel et al. (Citation2012). Furthermore, higher unemployment rates had a statistically significant influence on increased SI expenditures. Regarding the political variables, gender politics (female representation in Parliament) strongly influence SI spending, and the influence of a leftist party is another important variable but only to a lesser extent. Furthermore, both old and new politics affect SI policies. In liberal regimes, leftist parties exerted an immense influence on the expansion of social investment but had little impact in social democratic states. Older populations in conservative regimes and governmental debt and globalization variables in liberal regimes affected a decrease in SI expenditures. Deindustrialization in all regimes contributed to the expansion of SI expenditures, as Bonoli (Citation2013) notes.
reveals the relationship between SP and SI during different time periods. We predicted that, according to the literature, positive relationships turn negative as budget pressures grow. The results of the analysis almost confirm this prediction. The higher SP expenditures from 1980 to 1995 contributed to higher SI expenditures, whereas the relationship reversed from 1996 to 2010, though statistically not significant. The result is consistent regardless of whether the dependent variable is the ALMP or the family policy.
Table 6. Determinants of family policy and ALPM by period.
Indeed, the fiscal pressure (the government debt level in the analysis), is the important variable that negatively affects SI spending. As Kuitto (Citation2016) noted, fiscal pressures seemingly became the important factor in the welfare state. This finding also supports the result of the Granger panel analysis, in which SP spending preceded SI spending from 1980 to 1995, but that is not the case from 1996 to 2010. Apart from SP spending and the debt level, the equality level and women in Parliament still matter. Yet, the existence of a leftist party and the unemployment rates used to be statistically influential prior to 1996. In the later period, old politics and old social risks are no longer significant variables and deindustrialization noticeably loses its effect.
The results displayed in also confirm the Granger panel analysis in that pension spending is the positive factor increasing family policy expenditures. It is the opposite result from Bonoli and Reber (Citation2010), which argued that old age expenditures negatively influenced children and family spending. However, the effect of unemployment benefit spending on ALMP spending was statistically significant, but in the negative direction, from 1980 to 1995. The two policies seem to contradict each other, which accords with the existing literature on activation and welfare-to-work because many welfare states have tightened the eligibility for unemployment benefits while introducing activation or workfare measures to facilitate employment. In the family policy spending model, the old and new political variables are all important but the equality level is not significant. Yet, the political variables are not important in explaining the ALMP spending, but the levels of equality and unemployment matter. However, most independent variables are not statistically significant in explaining the ALMP expenditures since the mid-1990s.
Conclusion
This study explored whether the maturation of SP crowds out the development of SI. Based on the literature review, we hypothesized that SP is likely to crowd out SI rather than to crowd it in. We also assumed that the effect of SP spending on SI spending would vary across the different types of welfare states and different time periods. In Nordic welfare states, we hypothesized that SP spending is less likely to crowd out the development of SI, whereas it is more likely to do so in conservative welfare states. Also, as fiscal pressures on the welfare state increase, the crowding-out effect would be more visible in later time periods. To investigate this question, we reviewed the changing patterns of SP and SI spending, and then conducted the Granger panel analysis to determine the preceding effect of SP on SI and vice versa. Finally, the panel analysis was conducted to reveal the net effect of SP spending on SI spending while controlling socio-economic and political variables.
Overall, we found mixed results. According to the correlation and Granger panel analyses, the relationship between SP and SI was statistically significant in a positive direction, and we could not find strong evidence of a crowding-out effect. Rather, higher SP became the preceding factor of SI, though it was not the case during 1996–2010 and in conservative and liberal welfare states. The panel analysis revealed more information about the relationship between the two types of spending. Disproving the hypothesis, pension spending has a crowding-in effect on SI spending and, specifically, on family spending. Therefore, in general, we can conclude that SP has not crowded out SI spending during the study period.
However, the result is not consistent in every analysis. For example, unemployment benefit spending negatively influenced ALMP spending. Besides, though not statistically significant, we observed the negative effect of SP on SI in the later time period. Further, because a long-term time gap tends to exist between pension reforms and their impact on pension spending, unlike reforms on unemployment benefits, it might be too early to judge whether pension spending is not crowding-out SI spending. In effect, the impact of pension spending on family or ALMP policies turned negative in the later period.
Figure 4. Changes in social spending (% of GDP) in 18 OECD countries (Source: OECD, Citation2018).
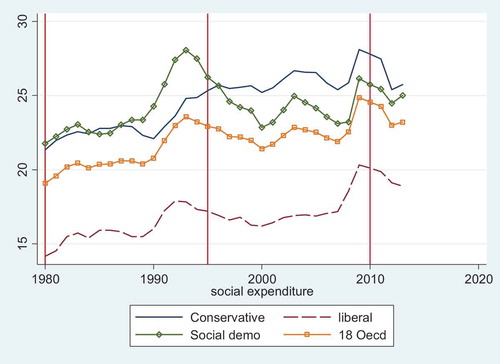
What are the theoretical and policy implications of these findings? First, it seems that the crowding-in effect of SP has changed into the crowding-out effect. We need to pay close attention to the two qualitatively different time periods. Although the retrenchment politics began with the wave of neoliberalism in the 1980s, social spending steadily increased with inertia until 1995. However, as seen in , there has been little change in social spending between 1995 and 2010 – excluding the effect of the financial crisis in 2007–8. In the expansion period of social spending, large-scale and institutional welfare states have developed both SP and SI, whereas small-scale or residual welfare states have not developed both. However, when the expansion of social expenditures reached the limit for political or financial reasons, welfare states witnessed the crowding-out effect, in which they had to cut one type of spending to increase spending in another area. In other words, it is essential to understand the nature of stagnant social spending and the current austerity to predict the trade-off between SP and SI.
Second, the trade-off between SP and SI might not be completely negative due to the fiscal pressure. Scholars already note that SI could not be effective without SP, and successful SI could save future SP spending (Esping-Andersen, Citation2002). Nordic states could be the best example. As seen in , the decrease in social spending, particularly SP, is noticeable in social democratic states. Yet, it might not be the simple crowding-out effect. Rather, their active investment into family policies and the labor market has contributed to the highest employment rate, gender equality, and the highest innovation score in Europe (European Commission, Citation2019), which allowed them to reduce SP spending. It is beyond the scope of this research to prove the nature of the trade-off in different countries, but further research is required.
Third, following the first two points, it would be important for welfare states to pursue the optimal restructuring of existing social policies to cope with increasing social risks without losing productive elements. To avoid the crowding-out effect of SP on SI and balance SP and SI, SP should be more redistributive and SI should be much more active in the social democratic states than it is now. Although their SP spending is lower than that of many conservative welfare states, their inequality and poverty level is lower (OECD, Citation2019). They are also not without social problems, but they have achieved the equitable society as well as the economically lively knowledge-based economy.
Fourth, it should be noted that this result is based on the experiences of Western welfare states. If we include other emerging welfare states, we might have different findings. Unlike Western welfare states, these emerging states tend to experience both old and new social risks simultaneously and have more room to increase social spending. South Korea is a good example. As it has introduced and expanded old-age pensions and universal social services, including long-term care and childcare services, the growth rate of social spending is the fastest among the OECD countries for the last two decades. Yet, its spending is still around 11% of the GDP. Further research is required to investigate new patterns and mechanisms of SP and SI developments in emerging welfare states, which would add new theoretical insight to the welfare state research.
Disclosure statement
No potential conflict of interest was reported by the authors.
Correction Statement
This article has been republished with minor changes. These changes do not impact the academic content of the article.
Additional information
Funding
Notes on contributors
Yun Young Kim
Yun Young Kim is an Associate Research Fellow in the Social Service Policy Department at Korea Institute for Health and Social Affairs. His research interests are comparative social policy, social services, public policy and macro quantitative methods. His research has been published in Sustainability, Korean Comparative Government Review, Public Policy Research and Disaster Prevention and Management.
Young Jun Choi
Young Jun Choi is an Associate Professor in the Department of Public Administration at Yonsei University. His research interests include aging and public policy, social investment policy, comparative welfare states, and comparative methods. His research has been published in international journals including Journal of European Social Policy, International Journal of Social Welfare, Ageing and Society, and Government and Opposition.
Notes
1 Most time-series data have unit roots. In order to verify unit roots of time-series data, the Dickey-Fuller test is used. Because the panel data are used, data stability has been identified by conducting the Levin-Lin-Chu unit-root test.
2 The optimal lag was determined based on AIC (Akaike)(Baltagi, Citation2008).
References
- Armingeon, K., Christian, I., Laura, K., David, W., & Sarah, E. (2015). Comparative political data set 1960–2013. Bern: Institute of Political Science. Berne: University of Berne.
- Armingeon, K., Wenger, V., Wiedemeier, F., Isler, C., Knöpfel, L., Weisstanner, D., & Engler, S. (2017). Comparative political data set 1960–2015. Bern: Institute of Political Science. Berne: University of.
- Baltagi, B. (2008). Econometric analysis of panel data (4 ed.). Chichester: John Wiley & Sons.
- Beck, N., & Katz, J. N. (1995). What to do (ad not to do) with time-series cross-section data. American Political Science Review, 89(3), 634–647.
- Berry, W. D., & Lowery, D. (1990). An alternative approach to understanding budgetary trade-offs. American Journal of Political Science, 34(3), 671–705.
- Bonoli, G. (2013). The origins of active social policy: Labour market and childcare policies in a comparative perspective. Oxford: Oxford University Press.
- Bonoli, G., Cantillon, B., & Van Lancker, W. (2017). Social investment and the Matthew Effect. In A. Hemerijck (Ed.), The Uses of Social Investment (pp. 66–76). Oxford: Oxford University Press.
- Bonoli, G., & Reber, F. (2010). The political economy of childcare in OECD countries: Explaining cross-national variation in spending and coverage rates. European Journal of Political Research, 49(1), 97–118.
- Busemeyer, M. R., & Garritzmann, J. L. (2017). The effect of economic globalization on compensatory and social Investment policies compared: A multi-level analysis of OECD countries. DaWS Working Paper Series, No. 2, Danish Centre for Welfare Studies - University of Southern Denmark.
- Busemeyer, M. R., Garritzmann, J. L., Neimanns, E., & Nezi, R. (2018). Investing in education in Europe: Evidence from a new survey of public opinion. Journal of European Social Policy, 28(1), 34–54.
- Busemeyer, M. R., & Neimanns, E. (2017). Conflictive preferences towards social investments and transfers in mature welfare states: The cases of unemployment benefits and childcare provision. Journal of European Social Policy, 27(3), 229–246.
- Castles, F. G. (2005). Social expenditure in the 1990s: Data and determinants. Policy & Politics, 33(3), 411–430.
- Castles, F. G. (2009). What welfare states do: A disaggregated expenditure approach. Journal of Social Policy, 38(1), 45–62.
- Dahlberg, S., Holmberg, S., Rothstein, B., Khomenko, A., & Svensson, R. (2017). The quality of government basic dataset. Gothenburg: The quality of Government Institute. Gothenburg: University of.
- De Deken, J. (2014). Is it possible to measure the social investment state? On the problems of defining a concept and operationalizing it on the basis of social expenditure data. In B. Cantillon & F. Vandenbroucke (Eds.), Reconciling work and poverty reduction: How successful are European welfare states? (pp. 260–285). Oxford: Oxford University Press.
- Deeming, C., & Smyth, P. (2015). Social investment after neoliberalism: Policy paradigms and political platforms. Journal of Social Policy, 44(2), 297–318.
- Dumitrescu, E.-I., & Hurlin, C. (2012). Testing for granger non-causality in heterogeneous panels. Economic Modelling, 29, 1450–1460.
- Elsässer, L., Rademacher, I., & Schäfer, A. (2015). Cracks in the foundation: Retrenchment in advanced welfare states. Economic Sociology: The European Electronic Newsletter, 16(3), 4–16.
- Esping-Andersen, G. (1990). The three worlds of welfare capitalism. Cambridge: John Wiley & Sons.
- Esping-Andersen, G. (2002). A child-centred social investment strategy. In G. Esping-Andersen, D. Gallie, A. Hemerijck, & J. Myles (Eds.), Why we need a new welfare state (pp. 26–67). Oxford: Oxford.
- European Commission. (2019). European innovation scoreboard 2019. Luxembourg: Publications Office of the European Union.
- Hamilton, J. D. (1994). Time series analysis (Vol. 2). Princeton: Princeton University Press.
- Hemerijck, A. (2011). The social investment imperative beyond the financial crisis. In L. Andor et al., (Ed.), Growth, Well-being and Social Policy in Europe: Trade-off or Synergy (pp. 11–19). Brussels: European Policy Centre.
- Hemerijck, A. (2012). Two or three waves of welfare state transformation? In N. Morel, B. Palier, & J. Palme (Eds.), Towards a social investment welfare state? Ideas, policies and challenges (pp. 33–60). Bristol: Policy Press.
- Hemerijck, A. (ed.). (2017). The uses of social investment. Oxford: Oxford University Press.
- Hurlin, C., & Venet, B. (2003). Granger causality tests in panel data models with fixed coefficients. Working Paper.
- Jensen, C. (2008). Worlds of welfare services and transfers. Journal of European Social Policy, 18(2), 151–162.
- Kasza, G. J. (2002). The illusion of welfare ‘regimes’. Journal of Social Policy, 31(2), 271–287.
- Kautto, M. (2002). Investing in services in West European welfare states. Journal of European Social Policy, 12(1), 53–65.
- Kuitto, K. (2016). From social security to social investment? Compensating and social investment welfare policies in a life-course perspective. Journal of European Social Policy, 26(5), 442–459.
- León, M., Choi, Y. J., & Ahn, J. S. (2016). When flexibility meets familialism: Two tales of gendered labour markets in Spain and South Korea. Journal of European Social Policy, 26(4), 344–357.
- Lundvall, B. Å., & Lorenz, E. (2012). Social investment in the globalising learning economy: A European perspective. In N. Morel, B. Palier, & J. Palme (Eds.), Towards a social investment welfare state? Ideas, policies and challenges (pp. 235–257). Bristol: Policy Press.
- Martin, J. P., & Grubb, D. (2001). What works and for whom: A review of OECD Countries’ experiences with active labour market policies. Swedish Economic Policy Review, 8(2), 9–56.
- Morel, N., Palier, B., & Palme, J. (2012). Towards a social investment welfare state?: Ideas, policies and challenges. Bristol: Policy Press.
- Nikolai, R. (2012). Towards social investment? Patterns of public policy in the OECD world. In N. Morel, B. Palier, & J. Palme (Eds.), Towards a social investment welfare state? Ideas, policies and challenges (pp. 91–116). Bristol: Policy Press.
- Nolan, B. (2013). What use is ‘social investment’? Journal of European Social Policy, 23(5), 459–468.
- OECD. (2016). OECD Factbook 2015–2016. Paris: Author.
- OECD. (2018). OECD social expenditure dataset 1980–2015. Paris: Author.
- OECD. (2019). Society at a Glance 2019: OECD social indicators. Paris: Author.
- Pierson, P. (1994). Dismantling the welfare state?: Reagan, Thatcher and the politics of retrenchment. Cambridge: Cambridge University Press.
- Plümper, T., Troeger, V. E., & Manow, P. (2005). Panel data analysis in comparative politics: Linking method to theory. European Journal of Political Research, 44(3), 327–354.
- Prandini, R., Orlandini, M., & Guerra, A. (2016). Social investment in times of crisis: A quiet revolution or a shaken welfare capitalism. Overview Report, Bologna.
- Vandenbroucke, F., & Vleminckx, K. (2011). Disappointing poverty trends: Is the social investment state to blame? Journal of European Social Policy, 21(5), 450–471.