
 ?Mathematical formulae have been encoded as MathML and are displayed in this HTML version using MathJax in order to improve their display. Uncheck the box to turn MathJax off. This feature requires Javascript. Click on a formula to zoom.
ABSTRACT
Attachment is a motivational system promoting felt security to a caregiver resulting in a persistent internal working model of interpersonal behavior. Attachment styles are developed in early social environments and predict future health and development outcomes with potential biological signatures, such as epigenetic modifications like DNA methylation (DNAm). Thus, we hypothesized infant DNAm would associate with toddler attachment styles. An epigenome-wide association study (EWAS) of blood DNAm from 3-month-old infants was regressed onto children’s attachment style from the Strange Situation Procedure at 22-months at multiple DNAm Cytosine-phosphate-Guanine (CpG) sites. The 26 identified CpGs associated with proinflammatory immune phenotypes and cognitive development. In post-hoc analyses, only maternal cognitive-growth fostering, encouraging intellectual exploration, contributed. For disorganized children, DNAm-derived cell-type proportions estimated higher monocytes –cells in immune responses hypothesized to increase with early adversity. Collectively, these findings suggested the potential biological embedding of both adverse and advantageous social environments as early as 3-months-old.
1. Introduction
1.1 Attachment development and early life environments
Early life relationships are integral to who we will later become, both in our behaviors and in our biology. This early life impact is perhaps best exemplified by attachment theory (Bowlby, Citation1979). Attachment is a learned behavioral pattern that children display with their parental caregivers, usually mothers, in which children variously can (or cannot) use their caregiver as a secure base and safe haven from stress. It represents a brain-based biological evolutionary system promoting infant survival (Ainsworth et al., Citation1978; Chisholm, Citation1996) through strategies that maintain proximity of infants to caregivers (Ainsworth et al., Citation1978; Shah et al., Citation2010). Four attachment styles have been identified: secure (Type B), insecure avoidant (Type A), insecure ambivalent/resistant (Type C), and disorganized (Type D) (Ainsworth et al., Citation1978; Main & Solomon, Citation1986). The infant is expected to be securely attached (Type B) and able to use their caregiver as a secure base for exploration and safe haven from stress when the caregiver is sensitively responsive (Ainsworth et al., Citation1978).
In contrast, insecure avoidant attachment (Type A) is observed in infants whose parents are withdrawn or under-stimulating; in this context, infants are observed to inhibit their displays of emotion, comfort, and proximity seeking to parents. Insecure ambivalent/resistant attachment (Type C), often referred to as anxious attachment in adulthood, is observed in infants whose parents are unpredictably, but intermittently responsive when comfort and safety is needed; in this context, infants are observed to exaggerate their emotional displays (e.g. anger, fear, and desire for comfort) in their relationships with parents (Sroufe, Citation2005; Sroufe et al., Citation1999). Disorganized attachment (Type D) is observed in infants whose parents provide fearful or fear-provoking stimuli or who present with unresolved trauma (Main & Hesse, Citation1990); in this context, infants are observed to present contradictory, misdirected, or freezing and/or fear behaviors in interactions with parents. These behaviors are thought to represent an inability to organize around their caregiver’s distressing behavior and occur more often in stressful and abusive family settings (Cyr et al., Citation2010; Madigan et al., Citation2007; Van Ijzendoorn et al., Citation1999).
Attachment development occurs within the first years of life, as the child gains both biological and cognitive maturity. By approximately 8–12 months children reach the “clear-cut attachment” phase, which is preceded by the “attachment-in-the-making” phase from approximately 2–8 months (Bowlby, Citation1969, Citation1982). It is during this phase that infants learn from their environment and influential caregiver interactions. Though attachment is still developing during this time, infants’ attention and behaviors show differences indicative of future attachment patterns (Conradt & Ablow, Citation2010; Sherman et al., Citation2015). Once an attachment style has developed, this internal working model of relationships is usually maintained, though flexible to some modification, into and throughout adulthood (Carlson et al., Citation2004; Chopik et al., Citation2019; Fraley, Citation2019; Groh et al., Citation2014; Hazan & Shaver, Citation1994; Khan et al., Citation2020; Sroufe, Citation2005; Waters & Waters, Citation2006). Many aspects of attachment are also echoed in our understanding of epigenetics, specifically DNA methylation (DNAm) (Aristizabal et al., Citation2019; Merrill et al., Citation2019), a molecular marker that may be an ideal avenue to examine physiological differences during attachment formation in very early life.
1.2 Evidence for the link between DNA methylation and attachment style
DNAm is the covalent addition of a methyl group to DNA Cytosine-phosphate-Guanine (CpG) dinucleotides. It is relatively stable, mitotically heritable, potentially associates with gene transcription, is variable during the first 5 years of life, and does not change the DNA sequence (Aristizabal et al., Citation2019; Jones et al., Citation2018; Nagy & Turecki, Citation2012; Pérez et al., Citation2019). DNAm allows researchers to study how early life environments can “get under the skin” (Boyce & Kobor, Citation2015) to potentially result in dynamic variation in physiology, behavior, and health outcomes – ideal for studying as a potential biomarker of early attachment experiences. Understandably then, there have been a plethora of studies examining maternal sensitivity links with offspring DNAm in both model organisms and humans (Dall’ Aglio et al., Citation2020; Mcgowan et al., Citation2011; Moore et al., Citation2017; Provenzi et al., Citation2020), as well as several studies examining the association between DNAm and attachment, specifically (Darling Rasmussen & Storebø, Citation2021; Robakis et al., Citation2020).
While the majority of these maternal sensitivity and attachment studies found associations using candidate gene approaches, especially the oxytocin (OXTR) and glucocorticoid (NR3C1) receptors (Darling Rasmussen & Storebø, Citation2021; Provenzi et al., Citation2020), one epigenome-wide study found infant attachment style may associate with up to 12% of DNAm variation in their sample (Garg et al., Citation2018). Additionally, DNAm is vital to cell type identity, and can, thus, be used to estimate cell type proportions (Houseman et al., Citation2012). Cell type proportion differences have been associated with differences in early life environment, especially exposure to social stressors (Esposito et al., Citation2016; Lam et al., Citation2012; Miller et al., Citation2011). Current evidence suggests a replicable and robust association of maternal sensitivity, and potentially attachment style, with DNAm, especially at genes in developmental pathways and as an intermediary between early adversity and DNAm (Darling Rasmussen & Storebø, Citation2021; Provenzi et al., Citation2020). Thus, while the presence of an association of caregiving to children’s DNAm during early life is consistent across the literature, to date, most of the field has focused on candidate gene investigations of psychopathology as well as the experiences of adversity and extreme caregiving environments in relation to characterizing parent-child relationships (Darling Rasmussen & Storebø, Citation2021; Robakis et al., Citation2020). However, there is currently a gap in our understanding of biological correlates in human attachment development, a period when both attachment and DNAm could be hypothetically reactive to the parental care environment, within the context of typical maternal caregiving.
1.3 Current study
We examined epigenome-wide DNAm associations with attachment style within a low-risk community sample of mothers and infants. Specifically, we assessed the connection between blood DNAm in infant offspring during the sensitive “attachment-in-the-making” phase of attachment development at 3-months with attachment style at 22-months. While the research strongly supports a link between early life context, especially maternal care, and attachment development, these data presented a unique opportunity to examine potentially lasting biological associations during this development period that had heretofore remained a “black box in attachment theory” (Bosmans et al., Citation2020).
First, we hypothesized that DNAm levels at CpGs in 3-months-olds would associate with toddler attachment style. Second, we hypothesized that birth characteristics and parent-child interaction quality may be effect modifiers that contribute to DNAm associations at 3-months-old with toddler attachment style.
2. Materials and methods
2.1. Participants
2.1.1. Alberta pregnancy outcomes and nutrition (APrON) cohort
The APrON cohort is a Canadian longitudinal cohort of 2139 families with children that enrolled women between 2009 and 2013 during their first or second trimester of pregnancy. Mothers voluntarily consented both during enrollment and at the time of collection to provide DNA samples from their children at 3 months of age. A representative subsample of children from mothers who reported no smoking, alcohol consumption, or steroid use during pregnancy donated blood samples (). Sample demographics were obtained through mothers’ survey self-reports or through hospital birth records. Infants were mostly white and represented equal numbers of males and females (). In total, data and samples from 93 dyads were employed in this analysis. Approximately half of the dyads were classified as securely attached (Type B) and the observed percentages aligned with the literature on attachment style ratios in normative, community populations (Mesman et al., Citation2016) (). There was a proportionally equal distribution of sexes, ethnicities, and ages across the attachment styles.
Table 1. Participant descriptive statistics.
2.2 Measures
2.2.1 Strange situation procedure (SSP)
At 22 months of age, maternal-infant pairs completed the SSP, the gold standard assessment for attachment styles in infancy (Ainsworth et al., Citation1978). This procedure contains eight brief episodes designed to activate infant’s attachment behaviors by evoking mild levels of stress in children through a series of mother–child separations and reunions, and interactions between the infant and a “stranger” (a research confederate), where the child’s behaviors were observed through a two-way mirror and video-recorded for coding by trained and reliable coders. All SSP videotapes were coded for styles of attachment using standard categories of secure (Type B) and insecure with subtypes avoidant (Type A) and ambivalent/resistant (Type C), and disorganized (Type D) (Ainsworth et al., Citation1978; Main & Solomon, Citation1986). A random 15% of the recordings were also re-coded by an independent expert coder. Cohen’s kappa for interrater reliability was .73. Due to the relatively small group sample sizes of insecure category subtypes the groups were dichotomized into infants classified as secure (B) versus not secure (A, C, and D) and disorganized (D) versus not disorganized (A, B, C). Disorganized (D) behavior was coded using the Scale for Disordered/Disoriented Infant Behavior (1 = low, 5 = moderate, 9 = extreme; with 5 = threshold) (Mary Main & Solomon, Citation1990; Mary Main & Stadtman, Citation1981), which assesses the degree of disorganized behavior regarding conflict (e.g. aggressive outbursts) and/or disruptive behaviors (e.g. immobilized, disoriented, sudden disordered activities, uninterpretable noises or movements) during the SSP.
2.2.2 Parent–child interaction teaching scale (PCITS)
The PCITS is a well-validated observational tool for assessing parent-child interaction quality before 36 months of age (Oxford, M. & Finlay, D, Citation2013) and conducted with APrON mother-child dyads when the child was 6 months old (Letourneau et al., Citation2018). The 76-item (scored 0 = no, 1 = yes) tool assesses interaction quality in four maternal subscales: sensitivity to cues, response to child’s distress, social-emotional growth fostering, and cognitive growth fostering, as well as two child subscales: clarity of cues and responsiveness to caregiver. Subscale scores are summed into caregiver, child, and overall totals with higher totals indicating more positive parent–child interaction quality.
2.2.3 Maternal edinburgh postnatal depression scale (EPDS)
Maternal postnatal depressive symptoms were assessed when the infants were approximately 3-months-old using the EPDS. This self-report instrument consists of 10-items rated on a 4-point scale that has been well-validated (Affonso et al., Citation2000).
2.3 Biological sample and data processing
Overall, 93 samples and 96,339 variable probes were included in the analyses (). Probe variability was determined using an inter-quantile range filter subset to probes where the DNAm β value varies by at least 5% across samples in the 5th and 95th percentile (Edgar, Jones, Robinson, et al., Citation2017). This reduced the testing space by removing probes that did not vary across individuals in our sample to better meet the Benjamini-Hochberg False Discovery Rate (FDR) control method assumptions of equal significance likelihood (Benjamini & Hochberg, Citation1995; Korthauer et al., Citation2019). For additional biological sample handling, data processing, cell type proportion estimation, and estimated cell type principal component calculation, please see Appendix.
Table 2. Cohort blood samples and DNA methylation probes were normalized and processed for quality control. A table of participant samples and Cytosine-phosphate-Guanosine (CpG) probes from the Illumina 450 K Beachip array in each step of preprocessing. Upon importing raw IDAT files, control probes were clustered to determine if any sample had abnormal values (Fortin et al., Citation2017). One sample had control probes that failed and was removed. Samples would also have been removed as outliers if failing additional outlier methods: detectOutlier, pcout, locFDR (Du et al., Citation2018; Efron, Citation2007; Efron et al., Citation2001; Hannum et al., Citation2013; Pidsley et al., Citation2013). Using these criteria, no additional samples were removed as outliers. Bad probes, defined as having a low detection p-value (≤1 × 10–16), fewer than 3 reads, or an NA in more than 1% of samples, were removed. Probes measuring SNPs or X and Y chromosomes (Price et al., Citation2013) were removed. Poorly designed probes, defined as polymorphic probes measuring a CpG that contains a difference in genetic sequence (Fortin et al., Citation2017) or multiple binding probes predicted to non-specifically bind (Pidsley et al., Citation2016; Price et al., Citation2013) were removed. Sex mismatches were discovered by employing K-means clustering with probes associated with sex and comparing this to the reported sex. One sample was removed as a sex mismatch, and one sample of the technical replicate pair was removed. Then, probes which were invariable in the cohort, a probe with <5% methylation β-value range between the 5th and 95th percentile, were removed. Finally, only samples with both DNAm at 3-months-old and Strange Situation Procedure (SSP) attachment style data at 22-months-old were included in the analysis for a total of 93 samples and 96,339 variable probes included in the analysis.
2.4 Cell type proportion analysis
2.4.1 Estimated cell type proportion association
Cell type differences are a major driver of inter-individual DNAm variability (Jones et al., Citation2018). After estimating cell type proportions, we tested for potential DNAm predicted cell type differences associated with attachment style controlling for sex, age, and ethnicity in an ANCOVA model. As they represent the two most extreme phenotypes, both secure (Type B) versus insecure (Non-Type B) attachment style and disorganized (Type D) versus organized (Non-Type D) attachment style comparisons were tested. Because the constituency of the attachment styles is unequal, for significant associations 10,000 randomized permutations were run with attachment styles classification shuffled and assigned randomly (ter Braak, Citation1992). The resulting value is the permutation p-value that represents the likelihood that comparisons were observed due to chance. This comparison was also replicated with cell proportions estimated from multiple reference panels ().
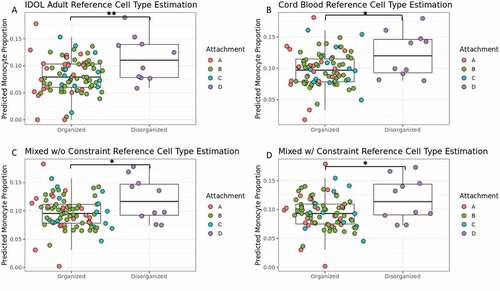
Figure 1. Higher predicted monocyte proportion in infant blood of toddlers with a disorganized attachment pattern than toddlers with a secure attachment pattern across all references used. Boxplots of toddler attachment pattern organization (Type D vs Non-Type D) and estimated monocyte proportion in infant buffy coat blood samples. Each plot shows estimated monocyte proportions calculated with a different cell type reference: (A) Identifying Optimal Libraries (IDOL) adult reference (Koestler et al., Citation2016), (B) umbilical cord blood reference (Gervin et al., Citation2019), (C) mixed reference combining both IDOL and cord blood, and (D) mixed reference combining both IDOL and cord blood, but also constraining predicted nucleated red blood cell proportion, a cell type only found in umbilical cord and newborn blood, to zero (Hermansen, Citation2001). The bar and asterisk indicate a significant difference (*p < .05 and **p < .01) between Type D and Non-Type D attachment patterns. Color refers to each of the four measured attachment styles from the Strange Situation Procedure (Ainsworth et al., Citation1978; Mary Main & Solomon, Citation1990).
2.5 DNA methylation association analysis
2.5.1 Biological DNA methylation effect size (Δβ) calculation
Change in DNAm value (or β value, indicating the proportion of methylated DNA molecules from zero to one) is the DNAm biological effect size, referred to as Δβ (Jones et al., Citation2018). Δβs were calculated by subtracting the average β of Type A,C,D attachment cases from the Type B group on a per-CpG basis. The technical Δβ threshold of ǀ≥0.03ǀ was determined to likely be greater than technical noise using the root mean squared error of the technical replicates (RMSE = 0.015) and the maximum standard error across all 96,339 variable CpGs for all individuals (SE = 0.027). To obtain a clearer understanding of biological differences in CpGs associated with attachment styles, significant CpG’s Δβs were also calculated for each style’s comparison by subtracting the mean β value of one type from the other.
2.5.2 Epigenome-wide association study (EWAS) analysis
For the a priori candidate analysis, biologically relevant candidates were chosen from recent publications reporting DNAm associations on attachment (Darling Rasmussen & Storebø, Citation2021) and early maternal caregiving (Provenzi et al., Citation2020). Of the potential candidates from these findings, 132 variable CpGs (13 genes) were tested a priori (Supplemental Table 1).
The exploratory EWAS was conducted by running an ANCOVA model on β values of all variable probes (n = 96,339) (Supplemental Table 2). Both candidate and exploratory approaches employed the same statistical model. The variable of interest was secure (Type B) versus insecure (Non-Type B) attachment styles. Model construction was tested for multicollinearity (Supplemental Figure 2) and relations were assumed to be linear and normally distributed. Variables (sex, age, ethnicity, and three PCs cell type proportions) that contribute to DNAm differences (Jones et al., Citation2018) were included as covariates in the model:
Any cell types found to associate with attachment style differences (monocytes) were excluded from these cell type proportion PCs.
All regressions were multiple-test corrected using the Benjamini-Hochberg (BH) FDR control method on the full testing space (Benjamini & Hochberg, Citation1995). Medium-confidence statistical threshold of FDR<.10 and a technical effect size threshold of Δβ≥|0.03| were used to identify significant associations with attachment style. All reported associations were from homoscedastic models as determined by Bartlett’s test. To examine if any detected CpGs were sensitive to the exclusion of cell types (monocytes) from the PCs in the first model, a second EWAS model including the PCs of all cell type proportions was run and results compared (Supplemental Table 3).
Table 3. Twenty-six CpGs were identified to associate with a secure attachment style. Represented are the details of each CpG discovered to be significantly associated with secure attachment style in infant buffy coat blood, including chromosome, map position, ∆β (Type B – Non-Type B). The FDR and p-value of each site of the primary model (not adjusted for estimated monocyte proportion) are listed, while CpGs that were not significant in the secondary model adjusting for all estimated cell type proportions (including monocytes) were marked with an asterisk. This is followed by descriptive information on each CpG: UCSC genome browser gene association, if one is present; genetic region; if there is a highly associated SNP, or methylation quantitative trait loci (mQTL), within 50kb of the CpG; and, if the CpG is part of a co-methylated region (CMR) (Gatev et al., Citation2020) with the number of CpGs in that CMR. CMR lengths marked with a dagger indicate there is another medium-confidence CpG also within that same CMR. Finally, the correlation and variability of each CpGs DNAm β value between blood and averaged over three areas of brain tissue (Broadman areas 10, 20, and 7) as provided by the Blood-Brain Epigenetic Concordance (BECon) tool (Edgar, Jones, Meaney, et al., Citation2017).
Identified CpGs were annotated to genes, CpG islands, genomic regions, and map locations with the UCSC genome browser (Price et al., Citation2013). To connect the CpGs to potential biological functions, the GeneCards (www.genecards.org) database and both PheWAS (https://atlas.ctglab.nl/PheWAS) and EWAS Atlases (http://bigd.big.ac.cn/ewas) were used. Chromatin state was gaged via ChromeHMM (Ernst & Kellis, Citation2017) based on histone modifications. Additionally, the Blood-Brain Epigenetic Concordance (BECon) tool (https://redgar598.shinyapps.io/BECon/) was used to investigate the concordance and variability of CpGs in blood and brain regions (Broadman areas 7, 10, 20) (Edgar, Jones, Meaney, et al., Citation2017).
2.5.3 Methylation quantitative trait loci (mQTL) analysis
Single nucleotide polymorphism (SNP) allelic variants can influence DNAm patterns of nearby CpGs, referred to as mQTLs (Bell et al., Citation2011; Cheung et al., Citation2017; Gertz et al., Citation2011). Therefore, significant CpGs were also analyzed against SNPs to examine potential contributions of the genomic context. To increase mQTL discovery likelihood, only variable SNPs within a 50kb window from the CpGs were included in the analysis using a CpG ~ SNP ANOVA model (Supplemental Table 4) (Islam et al., Citation2019; Smith et al., Citation2014).
Table 4. Immune system pathways were the top identified in a KEGG pathway enrichment analysis for secure attachment style exploratory EWAS results. Rank ordered values from the pathway terms that passed a medium-confidence FDR<.10 from the methylglm enrichment analysis, accounting for the number of CpGs in each term (Ren & Kuan, Citation2019). Provided p-values were from the secondary EWAS model accounting for all estimated cell type proportions (including monocytes). This analysis used the KEGG (Kyoto Encyclopedia of Genes and Genomes) database resource to discover pathway associations (Ganter et al., Citation2005). The number of genes in each term, p-value, and FDR value were included.
2.5.4 Co-Methylated region (CMR) analysis
Because DNAm patterns at CpGs located close to one another are highly correlated, and may act together, we examined if associated CpGs were within CMRs as determined using the Co-Methylation with genomic CpG Background (CoMeBack) method (Gatev et al., Citation2020). 21,803 CMRs were constructed from this cohort and interrogated here to define potential regions of co-methylation for CpGs significantly associated with future secure attachment development.
2.5.5 Gene ontology (GO) analysis
A GO analysis was performed on EWAS results using methylGSA (Ren & Kuan, Citation2019) accounting for CpG probe number length bias (Mi et al., Citation2012). The secondary EWAS model accounting for all cell types was chosen in order to not overrepresent the possible effect of differing monocyte proportions in potential pathway associations. Ranked CpGs with a p < .0001 were included in analyses of the Kyoto Encyclopedia of Genes and Genomes (KEGG) pathway, GO, and Reactome databases, as was implemented in recent EWAS literature (Croft et al., Citation2011; Ganter et al., Citation2005; Mooney et al., Citation2020; Ren & Kuan, Citation2019).
2.5.6 Contribution analysis
We also interrogated the potential influence of maternal-infant relationships and birth characteristics known to associate with DNAm on significant CpGs (Mayne, Citation2012). To investigate these contributions, a method used previously in a study examining DNAm was implemented (Roberts et al., Citation2018). Percentage contribution for each variable of interest was calculated as:
CpG ~ βbase Attachment Style + Age + Sex + Ethnicity + Predicted Cell Proportion PCs
CpG ~ βadj Attachment Style + Contributor + Age + Sex + Ethnicity + Predicted Cell Proportion PCs
% Contribution = 100
3. Results
3.1 Higher monocyte proportions at 3-months were associated with toddler type D classification
While there was no difference in infant estimated monocyte proportions between future secure (Type B) and future non-secure attachment styles (Type A,C,D) (1,87) F = 1.685 p = 0.2010, 90% CI [0.00, 0.32], infants who would later be categorized as disorganized (Type D) had a significantly higher predicted proportion of monocytes at 3-months-old than those with later organized attachment styles (A,B,C) () (1,87) F = 7.838 p = 0.0063, 90% CI [0.12, 0.48] Cohen’s f = 0.30. A randomized permutation test (p = 0.011) indicates this finding was not due to chance or imbalance in the groups. Additionally, this significant infant cell type difference was retained between future Type D and future organized attachment styles when using or including an umbilical cord blood reference for cell type estimation ((1,87) F = 6.365 p = 0.0135, Cohen’s f = 0.27) (). Future Type D infants were consistently estimated to have a higher estimated infant monocyte proportion than future organized attachment infants. Due to the unique importance of cell type on DNAm studies, this estimated cell type proportion difference was accounted for in the future secure (Type B) versus non-secure (Type A,C,D) attachment style EWAS.
3.2 Twenty-six medium-confidence CpGs were associated with toddler type B classification
With roughly equal groups of infants who would later be categorized as secure (Type B) and non-secure (Type A,C,D), we examined a model to explore potential DNAm precursors to future secure attachment style development. To operationally define medium-confidence CpGs, we adopted a statistical threshold of FDR<0.10 and a technical effect size threshold of |Δβ≥.03| reminiscent of thresholds used in EWAS literature (Bush et al., Citation2018; Essex et al., Citation2013), where none of the CpGs included in the a priori candidate tests passed; but, two CpGs in TNF passed the FDR threshold alone (Supplemental Table 1). Using 96,339 variable CpGs in the exploratory EWAS, we ran an ANCOVA model of attachment style on DNAm (; Supplemental Table 2) where 26 CpGs were significantly associated with future secure attachment style (Type B vs Non-Type B) (; ). Four CpGs met our medium-confidence criteria only in the primarily model, which did not account for monocyte cell type proportion, indicating their association is sensitive to estimated monocyte proportion (; Supplemental Figure 3; Supplemental Table 3).
Figure 2. Exploratory EWAS model results indicate a DNAm signal of secure attachment style. A p-value histogram and volcano plot of the primary EWAS model results. This model interrogates differences between Type B and Non-Type B attachment styles adjusting for sex, age, ethnicity, and three estimated cell type proportion principal components calculated excluding predicted monocyte proportions. This is because predicted estimated monocyte proportion correlated with attachment style. (A) A right-skewed histogram of the p-value distribution from each CpG result in the exploratory EWAS. (B) A volcano plot depicting medium-confidence CpGs identified as being significantly associated with toddler secure attachment style at an FDR<0.10 and ǀΔβ≥0.03ǀ, which are represented by the solid and dashed lines, respectively.
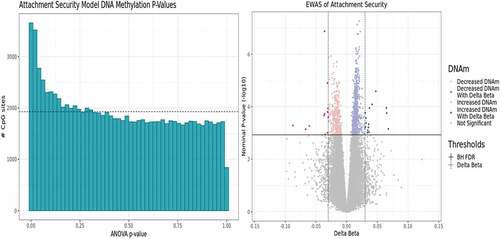
Figure 3. Sixteen medium-confidence CpGs’ DNAm differ with secure versus insecure attachment styles. Boxplots of secure versus insecure attachment style (Type B vs Not Type B) DNAm β values show differences for medium-confidence CpGs. β values range from zero to one and are on a variable y-axis scale of 0.5. Color refers to attachment style. Eight CpGs exhibited decreased β values and eight exhibited increased β values with secure attachment.
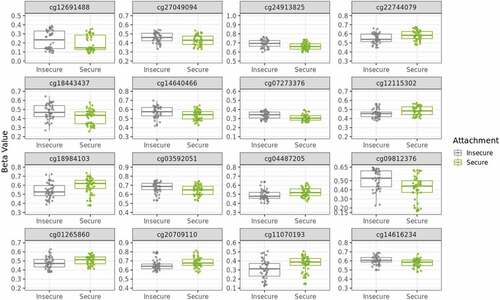
Figure 4. Seven medium-confidence CpGs associated with secure attachment style are within co-methylated regions (CMRs) with multiple significant CpGs. Three plots depicting seven medium-confidence CpGs associated with secure attachment within a CMR. Co-methylated regions were grouped if CpG β values were correlated by 40% and within 1kb of the next probe accounting for the interspersed density of background CpG sites within 400bp (Gatev et al., Citation2020). At the top of each plot is the chromosome and genomic position of each CMR, under which is the relative position of each CpG. CpGs marked with an asterisk were identified as medium-confidence CpGs associated with secure attachment style. Beneath those are gene associations based on the UCSC genome track (Kent et al., Citation2002) and the NCBI genome track (Agarwala et al., Citation2018), followed by the chromatin state of the region as determined by ChromeHMM using profiled histone marks (Ernst & Kellis, Citation2017). Finally, a line plot of DNAm β value, on a scale from zero to one, at each CpG in the CMR. Lines indicate average values, the surrounding opaque bars display confidence intervals, and colors indicate secure (Type B) and insecure (Non-Type B) attachment style. (A) CMR within LINC01556 and a tRNA cluster containing three medium confidence CpGs and 13 CpGs in total. (B) Intergenic CMR containing two medium-confidence CpGs and four CpGs in total. (C) CMR within PPFIA3 containing two medium-confidence CpGs and three CpGs in total.
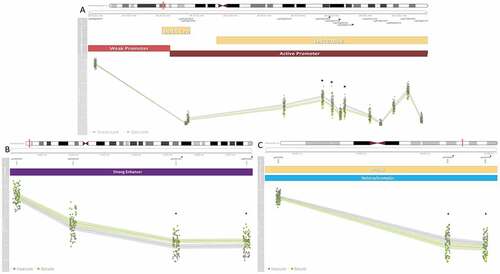
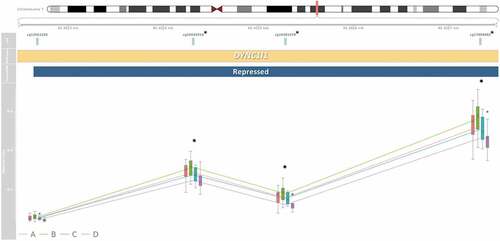
Figure 5. Three medium-confidence CpGs associated with secure attachment style are within the four CpG DYNC1I1 co-methylated region (CMR). A plot which at the top is presented a map of chromosome seven and the CMR’s genomic position, under which is the relative position of each CpG. CpGs marked with an asterisk were identified as medium-confidence CpGs associated with secure attachment style. Co-methylated regions were grouped if CpG β values were correlated by 40% and within 1kb of the next probe accounting for the interspersed density of background CpG sites within 400bp (Gatev et al., Citation2020). Beneath those is the DYNC1I1 gene association based on the UCSC genome track (Kent et al., Citation2002), which contains the entire CMR, followed by the repressed chromatin state of the region determined by ChromeHMM histone marks (Ernst & Kellis, Citation2017). Lastly displayed are boxplots of DNAm β value, on a scale from zero to one, at each CpG in the CMR. Lines indicate average values and colors refer to attachment style (Type A, B, C, or D). There were differences greater than ǀ∆β ≥ 0.03ǀ across attachment style at the three medium-confidence CpGs.
Referencing BECon, 85% of hits (22/26) were variable in both blood and brain by |≥0.03| (; Supplemental Figure 4) (Edgar, Jones, Robinson, et al., Citation2017). Additionally, using the genotyping data, no mQTLs within 50kb were found to associate with any medium-confidence CpGs. A sensitivity analysis examined the ∆βs across each attachment type comparison for the detected medium-confidence CpGs (Supplemental Table 4). The largest number of comparisons within the 26 identified medium-confidence CpGs that passed the technical effect size threshold of ǀ∆β ≥ 0.03ǀ were between Type B and Type C, while the least were between Type A and Type C.
3.3 Thirteen of the 26 medium-confidence CpGs were within CMRs
Several of the identified CpGs were proximally located to CpGs with correlated DNAm patterns. Four CMRs contained multiple hits within the medium-confidence CpGs, containing 38% of the identified CpGs (). The thirteen CpG LINC01556 CMR was within an active promoter region, the three CpG PPFIA3 CMR was within a heterochromatin region, the four CpG intergenic regulatory CMR was within a strong enhancer (), while the four CpG DYNC1I1 CMR was within a repressed chromatin state region (). DCHS2, C17orf98, and CATSPER4 CMRs each contained one medium-confidence CpG, respectively ().
3.4 Immune system action was enriched in the infant DNAm associations with toddler type B classification
To better understand the biological pathways represented by DNAm associations with Type B, a GO analysis via logistic regression model (Mi et al., Citation2012) was conducted on the results of the secondary EWAS model that accounted for all cell types (Supplemental Table 3). Using the KEGG pathway reference, the top seven pathways represented immune system or cell activity and signaling (). While not immediately apparent in its relevancy, the eighth pathway, chagas disease, is characterized by increased monocyte proportions (Gómez-Olarte et al., Citation2019). Similarly, using additional references (Reactome and GO), the top pathways were again immune-related with B cell activation, interleukin signaling, and T-cell and leukocyte activity (Supplemental Tables 5 and 6).
3.5 Caregiver score for parent–child interaction quality contributed to the association between infant medium-confidence CpGs and future type B development
None of the birth characteristic factors contributed to the discovered CpG associations with Type B, nor did maternal postnatal depression or the PCITS child scales for parent–child interaction quality (Supplemental Table 7). However, the PCITS caregiver cognitive growth fostering subscale contributed to approximately 25% of the effect at 2 CpGs: cg17889682 within the DYNC1I1 CMR (F(7, 79) = 2.727, FDR = 0.0560, R2 = 0.19, 21.05% contribution) and cg14640466 (F(7, 79) = 28.11, FDR = 0.0392, R2 = 0.71, 23.99% contribution). Both CpGs are variable in brain and are concordant .20 and .52, respectively, with DNAm in the prefrontal cortex (Supplemental Figure 4). No other subscale contributed to the medium-confidence CpGs (Supplemental Table 7).
4. Discussion
These findings demonstrated the association between increased estimated infant monocyte proportion and DNAm at 3-months with Type D attachment style categorization at 22-months, though there was no difference in estimated infant monocyte proportions between future secure and non-secure categorization. Additionally, the majority of secure attachment (Type B) development associated CpGs were variable in, and correlated with, brain DNAm (Edgar, Jones, Meaney, et al., Citation2017) and within CMRs (Gatev et al., Citation2020). Though birth characteristics and maternal postnatal depression did not contribute to these associations, maternal cognitive growth fostering contributed a quarter of the effect to two CpGs. While no mQTLs were found to associate with the medium-confidence CpGs, this does not discount previous findings of a high genetic contribution to overall DNAm variation explained by attachment (Garg et al., Citation2018). The posthoc analysis of ∆βs across specific attachment type comparisons revealed, understandably, that the reported CpGs are a signal of future secure attachment style and mostly not informative of biological differences between insecure styles. Together, these results suggest the presence of a precursor biomarker of later attachment style development among individuals as young as 3-months-old.
4.1 Many medium-confidence DNAm associations with toddler secure attachment classification were within genes related to cognitive function and neurobiology
Positive early social environments, like those associated with a secure attachment style, can be a crucial resource in cognitive development and buffering later cognitive decline (Brummelte, Citation2016; Meins, Citation1997; Walsh et al., Citation2019). This may be related to both the vital importance of infants’ social environment and the biological plasticity of the early developmental period (Jones et al., Citation2018; Kolb et al., Citation2012). Evidence shows securely attached children develop improved cognitive skills in comparison to insecure children (Bergman et al., Citation2010; Edelstein, Citation2006; Meins, Citation1997; Moss & St-Laurent, Citation2001; De Ruiter & van Ijzendoorn, Citation1993; Sroufe, Citation2005; West et al., Citation2013). For example, secure attachment style at 15-months-old associated with better performance on both teacher ratings and all tasks of executive function at 5-years-old (Bernier et al., Citation2015).
Perhaps, these benefits of secure attachment to cognitive function are reflected in the contribution of caregiver cognitive growth fostering – the only detected contributor to medium-confidence secure attachment style CpG effects – as maternal cognitive growth fostering previously associated with higher cognitive function scores in 9-months-olds (Fuller et al., Citation2010). Creating an early environment where safe exploration and critical thinking are encouraged by caregivers may result in detectable biological differences associated with cognition. This contribution may suggest the parental initiative towards nurturing cognitive growth is important to the process of future secure attachment development and its associated biomarkers, which should be further investigated in prospective work. Both CpGs contributed to by cognitive growth fostering were variable in brain and correlated with Broadman area 10 (BA10) DNAm. One of these CpGs was within DYCN1I1, which, when expressed in brain, regulates mRNA localization along axons and synapses (Gershoni-Emek et al., Citation2016). Similarly, axon guidance was significant with secure attachment style in the KEGG pathway, replicating previous findings of DNAm and attachment (Garg et al., Citation2018) and echoing potential differences in cognition and plasticity.
Several medium-confidence CpGs have been associated with cognitive outcomes or reside within genes that do. DNAm in HK2, a gene highly expressed by neurons (Lundgaard et al., Citation2015), has associated with cognitive processing (Marioni et al., Citation2018). PPFIA3, a gene important for neurotransmitter release across the synapse, and four intergenic medium-confidence CpGs associated with DNAm differences in Trisomy-21, potentially related to its neurodiverse cognitive development phenotype (Haertle et al., Citation2019; Henneman et al., Citation2018). GSG1L expression negatively regulates the strength of AMPA receptor-mediated synaptic transmission, a critical mechanism for synaptic plasticity, and plays a pivotal role in information processing (Aichurok Kamalova et al., Citation2020; Gu et al., Citation2016; Jacobi & Engelhardt, Citation2021; Mao et al., Citation2017). Finally, COMT is well-characterized for its role in catecholamine neurotransmitter release and regulation. Both SNP variation and DNAm within COMT have been associated with cognitive outcomes, especially in association with early life experience (Bruder et al., Citation2005; Malhotra et al., Citation2002; Ursini et al., Citation2011; Vidrascu et al., Citation2019; Walton et al., Citation2014). Though this study only examined blood DNAm, the high concordance and variability in brain at the majority of CpGs, especially within the prefrontal cortex (BA10), (; Supplemental Figure 4) and established relation of attachment and cognition, lend credence to these CpGs as potential precursor biomarkers of cognitive and synaptic advantages associated with future secure attachment development.
4.2 Infant proinflammatory immune biomarkers differed with toddler secure and disorganized attachment styles
Both the increased estimated monocyte cell type proportion in the blood of disorganized attachment classification (Type D) infants and the medium-confidence CpG associations with secure attachment classification (Type B), indicate the possibility of proinflammatory immune differences during early attachment development. Monocytes are white blood cells that are important in both the adaptive and innate immune systems and normally increase in response to an immune challenge (Prame Kumar et al., Citation2018). Estimated higher basal proportions of monocytes in blood, like Type D infants in this study, may suggest the presence of chronic inflammation in response (Jong et al., Citation2017). Thus, it is reasonable to suppose future Type D infants may exhibit an increased inflammatory profile at 3-months-old reflected in identified DNAm differences.
These results echo several existing attachment findings. There is substantial evidence for dysregulated hypothalamic-pituitary-adrenal (HPA) axis and immune responses with attachment insecurity (Pietromonaco & Powers, Citation2015). Children categorized as Type D at 17-months-old had higher inflammation than organized attachment styles (Measelle et al., Citation2017). Children who experienced insecure attachment at 1-year-old had increased risk for inflammation-based illness 31 years later (Puig et al., Citation2013). Moreover, children with Type D attachments during infancy had higher levels of C-reactive protein (CRP), a marker of inflammation induced by white blood cell cytokines (Samson et al., Citation2019), than Type B children at 5-years-old (Bernard et al., Citation2019).
While not directly tested in this study, the literature implies a potential mutual origin of association for attachment insecurity and early life adversity through chronic stress. For example, higher estimated monocyte proportion in infancy for Type D infants, who are in the most stressful social environment of the four attachment types (Cyr et al., Citation2010), aligns with the prediction made by the biological embedding model of early adversity (Miller et al., Citation2011). This model posits exposure to early life stress may relate to aggressive monocyte cells nonresponsive to inhibition, thus leading to a proinflammatory phenotype and increased health risks (Ehrlich et al., Citation2016). One study directly testing this theory in adolescent girls extracted and stimulated monocytes, measuring IL-6 production. They found early life adversity related to increased IL-6 and a proinflammatory phenotype (Ehrlich et al., Citation2016). In our study, DNAm at CpGs within QRICH2 have also been previously associated with adverse childhood experiences in young adult blood (Artigas et al., Citation2020) and may be associated with immune cell changes (Maltby et al., Citation2018).
Moreover, two candidate CpGs originally identified via an association with parenting and inflammation within TNF, a gene that encodes for cytokine tumor necrosis factor alpha (TNF-α) (Louis et al., Citation1998), statistically associated with secure attachment. There were also three medium-confidence CpGs within DYNC1I1, a gene in the immune super-pathway which encodes a protein that upregulates IL-6 through nuclear factor kappa-light-chain-enhancer of activated B cells (NF-κB) in vitro (Gong et al., Citation2019). The DNAm differences discovered in DYNC1I1 CpGs was the exact opposite of monocyte cell type proportions, with Type D DNAm the lowest and Type B DNAm the highest. Because the chromatin state of this region is repressed, it is reasonable to speculate these CpGs are normatively more methylated and DNAm could inversely relate to expression, though we did not measure gene expression in this study (Mendenhall & Bernstein, Citation2008). Additionally, the GO analysis resulted in a profusion of immune-related pathways, with the biological action of leukocytes (e.g. monocytes) as prevalent across all references, again granting more credence to proinflammatory biological differences during secure attachment development.
Stress experienced early in life may affect adult immune health through this biological embedding (Boyce & Kobor, Citation2015; Hertzman, Citation1999, Citation2012). Early-life adversity, including poverty, psychosocial stress, parental psychopathology, and negative caregiver experiences predict inflammation markers in late childhood (Miller & Chen, Citation2010; Slopen et al., Citation2013) and adulthood (Austin et al., Citation2018; Luecken & Lemery, Citation2004; Repetti et al., Citation2002). For example, one study demonstrated that a composite measure of proinflammatory cytokines (e.g. IL-6, TNF-α) and CRP were significantly associated with different forms of early adversity (Hoye et al., Citation2020).
However, there is substantial evidence that secure attachment style provides, and is a core component of, resilience to adversity (Darling Rasmussen et al., Citation2019). For instance, early maternal warmth can buffer the effect of early adversity proinflammatory signaling in adulthood (Chen et al., Citation2011). Also, increased proinflammatory cytokines and CRP associated with maternal depression and were moderated by Type B in 17-month-old infants (Measelle & Ablow, Citation2018). These results suggest the possibility that biomarkers of proinflammatory immune differences in response to both positive, resulting in secure attachment, and adverse, resulting in insecure or disorganized attachment, early life social environments can be observed as early as 3-months-old and may have implications for future attachment and adult health outcomes (Fraley, Citation2019). These data support an association between toddler secure attachment development and infant DNAm that suggest differences in early life proinflammatory immune action and cognitive development. Our findings illustrate both the potential consequences of early adversity and resilience of positive parenting through biological associations within the first 3-months of life.
4.3 Limitations
We acknowledge these analyses lack statistical power due to a small sample, increasing the potential for false negatives. This may have contributed to the lack of associations found among candidate CpGs and potential mQTLs. As a trade-off, we applied a moderate threshold when multiple-test correcting throughout all analyses (FDR<0.10) along with the more stringent technical effect size threshold of |Δβ≥0.03|. Thus, these associations need to be replicated and inferences made cautiously, especially as no gene expression data was reported. Similarly, venous blood is comprised of multiple cell types (Jones et al., Citation2018), including subpopulations not measured in references, and the associations of DNAm within specific cell types remain unknown. Our sample is homogeneous, primarily Caucasian, and higher socioeconomic status, reducing the ability to extrapolate these findings to high-risk or unrepresented groups. We also note there is a temporal disjoint between the DNAm measurement (3-months) and attachment style measurement (22-months), though this chronological difference allowed us to hypothesize about potential biological associations with the process of future attachment style development. Finally, though these findings provide support for the association of DNAm at 3-months-old with attachment style development, these data do not support causal mechanisms; however, we hope this report does provide the foundation for future studies into the biomarkers and processes of secure attachment formation.
Disclosure of potential conflicts of interest
The authors of this study have no affiliations with nor involvement in any organization or entity with any financial interests or non-financial interests in the subject matter or materials discussed in this manuscript.
9.1.1 Genotyping Microarray and Processing
A subset of the infants with DNAm profiling (n = 106) also had single nucleotide polymorphism (SNP) genotyping performed in addition. Extracted DNA was run on the Illumina Global Screening Array (GSA) measuring 654,027 SNPs. Quality control of SNPs was performed in plink2 (Chang et al., Citation2015) using genome build GRCh37/hg19. SNPs were filtered by a minor allele frequency of at least 1% and for missing genotype rates greater than 10%. Next, SNPs with <97% allelic invariability were removed, leaving a total of 106 individuals and 302,132 SNPs.
9.1.2 DNA Methylation Microarray and Processing
Genomic DNA was bisulfite converted using EZ-96 DNA Methylation kits (Zymo Research, Irvine, CA) and run on Infinium HumanMethylation450 (450K) BeadChips (Illumina) producing 485,577 data points for 482,421 Cytosine-phosphate-Guanosine (CpG) sites. Raw IDAT files were imported to RStudio where beta (β) values (signifying the amount of DNA molecules methylated at a site on a range from 0-1) were produced from intensity measures (Du et al., Citation2018).
Functional normalization was used for background subtraction, color correction and probe type normalization (Aryee et al., Citation2014; Fortin et al., Citation2017). Samples were removed as outliers if detected in any of three methods. The detectOutlier function (Du et al., Citation2018) checks if the sample mean is too far from the cohort mean. The outlyx function (Pidsley et al., Citation2013) checks if a sample does not cluster with the cohort using principal component analysis (PCA). The locfdr package (Efron, Citation2007; Efron et al., Citation2001; Hannum et al., Citation2013) checks if the z-score PCA of a sample is different from the cohort at a threshold FDR ≤ 0.2. Additionally, any sex mismatches were identified by comparing the reported sex with DNAm predicted sex (). We then removed probes on the X and Y chromosomes, with fewer than three beads contributing to signal, with NAs in more than 2% of samples, with poor detection p values (<1×10⁻¹⁶), or previously shown to have unreliable probe design (Price et al., Citation2013) (). Variation associated with batch was assessed using PCA and then removed using surrogate variable analysis (ComBat) (Johnson et al., Citation2007).
An inter-quantile range filter subset to probes where the DNAm β value varies by at least 5% across samples in the 5th and 95th percentile (Edgar, Jones, Robinson, et al., Citation2017). This reduced the testing space by removing probes that did not vary across individuals in our sample to better meet the Benjamini-Hochberg False Discovery Rate (FDR) control method assumptions of equal significance likelihood (Benjamini & Hochberg, Citation1995; Korthauer et al., Citation2019). In total, 114 samples and 96,339 probes were deemed variable and of good quality. Of the 114 quality blood samples, 93 individuals also had SSP data at 22-months and were included in the analyses (), resulting in an analysis with approximately 40% power as determined by the pwrEWAS package (Graw et al., Citation2019).
9.1.3 Cell Type Proportion Estimation
A major function of DNAm is in cell type differentiation (Aristizabal et al., Citation2019). Since buffy coat blood samples represent a mix of cell types we computationally derived six estimated cell type proportions using the Identifying Optimal Libraries (IDOL) adult reference set with the Houseman method (Houseman et al., Citation2012; Koestler et al., Citation2016): neutrophils, natural killer cells, monocytes, CD4 T cells, CD8 T cells, and B cells (Supplemental Figure 1). Because these samples are from infants, we also estimated cell types using umbilical cord blood and mixed IDOL adult and cord blood references (Gervin et al., Citation2019) (Supplemental Figure 1), though the adult reference is more appropriate due to the lack of nucleated red blood cells (nRBCs) in 3-month infant venous blood (Hermansen, Citation2001).
9.1.4 Estimated Cell Type Proportion Principal Component Analysis (PCA)
We used principal components to account for estimated cell type variability. For the primary model excluding any cell types with significant attachment style associations (monocytes), a classic PCA was performed using the prcomp function in the stats package on the remaining five cell types (Holland, Citation2019). Three principal components (PCs), representing 93% of that cell type variability were included as covariates. For the secondary model including all cell types, these data were compositional and add to a constant: one. Therefore, we used robust isometric logratio (ilr) PCA, which is appropriate for composite data (Filzmoser et al., Citation2009). Four PCs, representing 99% of the estimated cell type proportion variability, were included in the second model.
Acknowledgments
We are extremely grateful to all the families who took part in this study and the whole APrON team (http://www.apronstudy.ca/), investigators, research assistants, graduate and undergraduate students, volunteers, clerical staff and mangers. This cohort was established by an interdisciplinary team grant from Alberta Innovates Health Solutions (formally the Alberta Heritage Foundation for Medical Research) and additional funding from the Alberta Children’s Hospital Foundation and Kids Brain Health Network (formerly National Centre of Excellence NeuroDevNet) assisted with the collection and analysis of data presented in this manuscript.
Data Availability Statement
Raw data were generated at the University of British Columbia. Derived data and analysis scripts supporting the findings of this study are available from the corresponding author, SMM, on request.
References
- Affonso, D. D., De, A. K., Horowitz, J. A., & Mayberry, L. J. (2000). An international study exploring levels of postpartum depressive symptomatology. Journal of Psychosomatic Research, 49(3), 207–216. https://doi.org/10.1016/S0022-3999(00)00176-8
- Agarwala, R., Barrett, T., Beck, J., Benson, D. A., Bollin, C., Bolton, E., … Zbicz, K. (2018). Database resources of the National Center for Biotechnology Information. Nucleic Acids Research, 46(D1), D8–D13. https://doi.org/10.1093/nar/gkx1095
- Aichurok Kamalova, B., Nakagawa, T., Roger Colbran, A., Kavalali, C. E., Delpire, E., C., & Sachin Patel, P. D. (2020). Functional characterization of an AMPA receptor auxiliary subunit GSG1L in vivo. Vanderbilt University Institutional Repository. Retrieved February 15, 2021, from https://ir.vanderbilt.edu/handle/1803/16364
- Ainsworth, M. D. S., Blehar, M. C., Waters, E., & Wall, S. (1978). Patterns of attachment: A psychological study of the strange situation. Psychology Press. Retrieved November 25, 2020, from https://citeseerx.ist.psu.edu/viewdoc/download?doi=10.1.1.690.8245&rep=rep1&type=pdf
- Aristizabal, M. J., Anreiter, I., Halldorsdottir, T., Odgers, C. L., McDade, T. W., Goldenberg, A., … O’Donnell, K. J. (2019). Biological embedding of experience: A primer on epigenetics. Proceedings of the National Academy of Sciences, 117(38), 201820838. https://doi.org/10.1073/pnas.1820838116
- Artigas, R., Vega-Tapia, F., Hamilton, J., & Krause, B. J. (2020). Dynamic DNA methylation changes in early versus late adulthood suggest nondeterministic effects of childhood adversity: A meta-analysis. Journal of Developmental Origins of Health and Disease. Advance online publication. https://doi.org/10.1017/S2040174420001075
- Aryee, M. J., Jaffe, A. E., Corrada-Bravo, H., Ladd-Acosta, C., Feinberg, A. P., Hansen, K. D., & Irizarry, R. A. (2014). Minfi: A flexible and comprehensive Bioconductor package for the analysis of Infinium DNA methylation microarrays | Bioinformatics | Oxford Academic. Bioinformatics, 30 (10), 1363–1369. https://academic.oup.com/bioinformatics/article/30/10/1363/267584. .
- Austin, M. K., Chen, E., Ross, K. M., Mcewen, L. M., Maclsaac, J. L., Kobor, M. S., & Miller, G. E. (2018, November). Early-life socioeconomic disadvantage, not current, predicts accelerated epigenetic aging of monocytes. Psychoneuroendocrinology, 97, 131–134. https://doi.org/10.1016/j.psyneuen.2018.07.007
- Bell, J. T., Pai, A. A., Pickrell, J. K., Gaffney, D. J., Pique-Regi, R., Degner, J. F., … Pritchard, J. K. (2011). DNA methylation patterns associate with genetic and gene expression variation in HapMap cell lines. Genome Biology, 12(1), 1–13. https://doi.org/10.1186/gb-2011-12-1-r10
- Benjamini, Y., & Hochberg, Y. (1995). Controlling the False Discovery Rate: A Practical and Powerful Approach to Multiple Testing. Journal of the Royal Statistical Society: Series B (Methodological), 57(1), 289–300. https://doi.org/10.1111/j.2517-6161.1995.tb02031.x
- Bergman, K., Sarkar, P., Glover, V., & O’Connor, T. G. (2010). Maternal Prenatal Cortisol and Infant Cognitive Development: Moderation by Infant–Mother Attachment. Biological Psychiatry, 67(11), 1026–1032. https://doi.org/10.1016/j.biopsych.2010.01.002
- Bernard, K., Hostinar, C. E., & Dozier, M. (2019). Longitudinal associations between attachment quality in infancy, C-reactive protein in early childhood, and BMI in middle childhood: Preliminary evidence from a CPS-referred sample. Attachment & Human Development, 21(1), 5–22. https://doi.org/10.1080/14616734.2018.1541513
- Bernier, A., Beauchamp, M. H., Carlson, S. M., & Lalonde, G. (2015). A secure base from which to regulate: Attachment security in toddlerhood as a predictor of executive functioning at school entry. Developmental Psychology, 51 (9), 1177–1189. https://psycnet.apa.org/buy/2015-32546-001
- Bosmans, G., Bakermans-Kranenburg, M. J., Vervliet, B., Verhees, M. W. F. T., & van IJzendoorn, M. H. (2020, June). A learning theory of attachment: Unraveling the black box of attachment development. Neuroscience and Biobehavioral Reviews, 113, 287–298. https://doi.org/10.1016/j.neubiorev.2020.03.014
- Bowlby, J. (1969). Attachment and Loss (1st ed.). Basic Books.
- Bowlby, J. (1979). The making and breaking of affectional bonds. Tavistock.
- Bowlby, J. (1982). Attachment and loss: Retrospect and prospect. American Journal of Orthopsychiatry, 52(4), 664. https://doi.org/10.1111/j.1939-0025.1982.tb01456.x
- Boyce, W. T., & Kobor, M. S. (2015). Development and the epigenome: the ‘synapse’ of gene–environment interplay. Developmental Science, 18(1), 1–23.
- Bruder, G. E., Keilp, J. G., Xu, H., Shikhman, M., Schori, E., Gorman, J. M., & Gilliam, T. C. (2005). Catechol-O-methyltransferase (COMT) genotypes and working memory: Associations with differing cognitive operations. Biological Psychiatry, 58(11), 901–907. https://doi.org/10.1016/j.biopsych.2005.05.010
- Brummelte, S. (2016, September). Introduction: Early adversity and brain development. Neuroscience, 342, 1–3. https://www.clinicalkey.com/#!/content/playContent/1-s2.0-S0306452216304882?returnurl=null&referrer=null
- Bush, N. R., Edgar, R. D., Park, M., Macisaac, J. L., Mcewen, L. M., Adler, N. E., Essex, M. J., Kobor, M. S., & Boyce, T. (2018). The biological embedding of early-life socioeconomic status and family adversity in children’s genome-wide DNA methylation. Epigenomics, 10(11), 1445–1461. https://doi.org/10.2217/epi-2018-0042
- Carlson, E. A., Alan sroufe, L., & Egeland, B. (2004). The Construction of Experience: A Longitudinal Study of Representation and Behavior. Child Development, 75(1), 66–83. https://doi.org/10.1111/j.1467-8624.2004.00654.x
- Chang, C. C., Chow, C. C., Tellier, L. C., Vattikuti, S., Purcell, S. M., & Lee, J. J. (2015). Second-generation PLINK: Rising to the challenge of larger and richer datasets. GigaScience, 4(1), 7. https://doi.org/10.1186/s13742-015-0047-8
- Chen, E., Miller, G. E., Kobor, M. S., & Cole, S. W. (2011). Maternal warmth buffers the effects of low early-life socioeconomic status on pro-inflammatory signaling in adulthood. Molecular Psychiatry, 16(7), 729–737. https://doi.org/10.1038/mp.2010.53
- Cheung, W. A., Shao, X., Morin, A., Siroux, V., Kwan, T., Ge, B., Aïssi, D., Chen, L., Vasquez, L., Allum, F., Guénard, F., Bouzigon, E., Simon, -M.-M., Boulier, E., Redensek, A., Watt, S., Datta, A., Clarke, L., Flicek, P., Paul, D. S., … Grundberg, E. (2017). Functional variation in allelic methylomes underscores a strong genetic contribution and reveals novel epigenetic alterations in the human epigenome. Genome Biology, 18(1), 50. https://doi.org/10.1186/s13059-017-1173-7
- Chisholm, J. S. (1996). The evolutionary ecology of attachment organization. Human Nature (Hawthorne, N.Y.), 7(1), 1–37. https://doi.org/10.1007/BF02733488
- Chopik, W. J., Edelstein, R. S., & Grimm, K. J. (2019). Longitudinal changes in attachment orientation over a 59-year period. Journal of Personality and Social Psychology, 116(4), 598–611. https://doi.org/10.1037/pspp0000167
- Conradt, E., & Ablow, J. (2010). Infant physiological response to the still-face paradigm: Contributions of maternal sensitivity and infants’ early regulatory behavior. Infant Behavior and Development, 33(3), 251–265. https://doi.org/10.1016/j.infbeh.2010.01.001
- Croft, D., O’Kelly, G., Wu, G., Haw, R., Gillespie, M., Matthews, L., Caudy, M., Garapati, P., Gopinath, G., Jassal, B., Jupe, S., Kalatskaya, I., Mahajan, S., May, B., Ndegwa, N., Schmidt, E., Shamovsky, V., Yung, C., Birney, E., D’Eustachio, P., & Stein, L. (2011). Reactome: A database of reactions, pathways and biological processes. Nucleic Acids Research, 39(SUPPL. Database), D691–D697. https://doi.org/10.1093/nar/gkq1018
- Cyr, C., Euser, E. M., Bakermans-Kranenburg, M. J., & Van Ijzendoorn, M. H. (2010). Attachment security and disorganization in maltreating and high-risk families: A series of meta-analyses. Development and Psychopathology, 22(1), 87–108. https://doi.org/10.1017/S0954579409990289
- Dall’ Aglio, L., Rijlaarsdam, J., Mulder, R. H., Neumann, A., Felix, J. F., Kok, R., Bakermans-Kranenburg, M. J., van Ijzendoorn, M. H., Tiemeier, H., & Cecil, C. A. M. (2020). Epigenome-wide associations between observed maternal sensitivity and offspring DNA methylation: A population-based prospective study in children. Psychological Medicine, 1–11. https://doi.org/10.1017/S0033291720004353
- Darling Rasmussen, P., & Storebø, O. J. (2021). Attachment and Epigenetics: A Scoping Review of Recent Research and Current Knowledge. Psychological Reports, 124(2), 479–501. https://doi.org/10.1177/0033294120901846
- Darling Rasmussen, P., Storebø, O. J., Løkkeholt, T., Voss, L. G., Shmueli-Goetz, Y., Bojesen, A. B., Simonsen, E., & Bilenberg, N. (2019). Attachment as a Core Feature of Resilience: A Systematic Review and Meta-Analysis. Psychological Reports, 122(4), 1259–1296. https://doi.org/10.1177/0033294118785577
- de Ruiter, C., & van Ijzendoorn, M. H. (1993). Attachment and cognition: A review of the literature. International Journal of Educational Research, 19 (6), 525–540. https://dare.uva.nl/search?identifier=a5e9be2c-e78a-42f5-a699-f44052364b0b. .
- Du, P., Kibbe, W. A., & Lin, S. M. (2018). Lumi : A Pipeline for Processing Illumina Microarray. 24(13), 1547–1548. https://doi.org/10.1093/bioinformatics/btn224
- Edelstein, R. S. (2006). Attachment and emotional memory: Investigating the source and extent of avoidant memory impairments. Emotion, 6(2), 340–345. https://doi.org/10.1037/1528-3542.6.2.340
- Edgar, R. D., Jones, M. J., Meaney, M. J., Turecki, G., & Kobor, M. S. (2017). BECon: A tool for interpreting DNA methylation findings from blood in the context of brain. Translational Psychiatry, 7(8), e1187–e1187. https://doi.org/10.1038/tp.2017.171
- Edgar, R. D., Jones, M. J., Robinson, W. P., & Kobor, M. S. (2017). An empirically driven data reduction method on the human 450K methylation array to remove tissue specific non-variable CpGs. Clinical Epigenetics, 9(1), 1–8. https://doi.org/10.1186/s13148-017-0320-z
- Efron, B. (2007). Correlation and large-scale simultaneous significance testing. Journal of the American Statistical Association, 102(477), 93–103. https://doi.org/10.1198/016214506000001211
- Efron, B., Tibshirani, R., Storey, J. D., & Tusher, V. (2001). Empirical bayes analysis of a microarray experiment. Journal of the American Statistical Association, 96(456), 1151–1160. https://doi.org/10.1198/016214501753382129
- Ehrlich, K. B., Ross, K. M., Chen, E., & Miller, G. E. (2016). Testing the biological embedding hypothesis: Is early life adversity associated with a later proinflammatory phenotype? Development and Psychopathology, 28(4pt2), 1273–1283. https://doi.org/10.1017/S0954579416000845
- Ernst, J., & Kellis, M. (2017). Chromatin-state discovery and genome annotation with ChromHMM. Nature Publishing Group, 12(12), 2478. https://doi.org/10.1038/nprot.2017.124
- Esposito, E. A., Jones, M. J., Doom, J. R., Macisaac, J. L., Gunnar, M. R., & Kobor, M. S. (2016). Differential DNA methylation in peripheral blood mononuclear cells in adolescents exposed to significant early but not later childhood adversity. Development and Psychopathology, 28(4pt2), 1385–1399. https://doi.org/10.1017/S0954579416000055
- Essex, M. J., Thomas Boyce, W., Hertzman, C., Lam, L. L., Armstrong, J. M., Neumann, S. M. A., & Kobor, M. S. (2013). Epigenetic Vestiges of Early Developmental Adversity: Childhood Stress Exposure and DNA Methylation in Adolescence. Child Development, 84(1), 58–75. https://doi.org/10.1111/j.1467-8624.2011.01641.x
- Filzmoser, P., Hron, K., & Reimann, C. (2009). Principal component analysis for compositional data with outliers. Environmetrics: The Official Journal of the International Environmetrics Society, 20(6), 621–632.
- Fortin, J., Triche, T. J., & Hansen, K. D. (2017). Preprocessing, normalization and integration of the Illumina HumanMethylationEPIC array with minfi. Bioinformatics, 33(4), 558–560.
- Fraley, R. C. (2019). Attachment in Adulthood: Recent Developments, Emerging Debates, and Future Directions. Annual Review of Psychology, 70(1), 401–422. https://doi.org/10.1146/annurev-psych-010418-102813
- Fuller, B., Bein, E., Bridges, M., Halfon, N., Jung, S., Rabe-Hesketh, S., & Kuo, A. (2010). Maternal Practices That Influence Hispanic Infants‘ Health and Cognitive Growth. Pediatrics, 125(2), 324. https://doi.org/10.1542/peds.2009-0496
- Ganter, B., Tugendreich, S., Pearson, C. I., Ayanoglu, E., Baumhueter, S., Bostian, K. A., Brady, L., Browne, L. J., Calvin, J. T., Day, G.-J., Breckenridge, N., Dunlea, S., Eynon, B. P., Furness, L. M., Ferng, J., Fielden, M. R., Fujimoto, S. Y., Gong, L., Hu, C., Judo, M. S. B., … Jarnagin, K. (2005). Development of a large-scale chemogenomics database to improve drug candidate selection and to understand mechanisms of chemical toxicity and action. Journal of Biotechnology, 119(3), 219–244. https://doi.org/10.1016/j.jbiotec.2005.03.022
- Garg, E., Chen, L. I., Nguyen, T. T. T., Pokhvisneva, I., Chen, L. M., Unternaehrer, E., … O’donnell, K. J. (2018). The early care environment and DNA methylome variation in childhood. Development and Psychopathology, 30(3), 891–903. https://doi.org/10.1017/S0954579418000627
- Gatev, E., Gladish, N., Mostafavi, S., & Kobor, M. S. (2020). CoMeBack: DNA methylation array data analysis for co-methylated regions. Bioinformatics, 36(9), 2675–2683. Retrieved July 17, 2020, from Bioinformatics website: https://academic.oup.com/bioinformatics/article/36/9/2675/5716323
- Gershoni-Emek, N., Mazza, A., Chein, M., Gradus-Pery, T., Xiang, X., Li, K. W., Sharan, R., & Perlson, E. (2016). Proteomic analysis of dynein-interacting proteins in amyotrophic lateral sclerosis synaptosomes reveals alterations in the RNA-binding protein staufen. Molecular and Cellular Proteomics, 15(2), 506–522. https://doi.org/10.1074/mcp.M115.049965
- Gertz, J., Varley, K. E., Reddy, T. E., Bowling, K. M., Pauli, F., Parker, S. L., Willard, H. F., Myers, R. M., & Kucera, K. S. (2011). Analysis of DNA Methylation in a Three-Generation Family Reveals Widespread Genetic Influence on Epigenetic Regulation. PLoS Genetics, 7(8), e1002228. https://doi.org/10.1371/journal.pgen.1002228
- Gervin, K., Salas, L. A., Bakulski, K. M., Van Zelm, M. C., Koestler, D. C., Wiencke, J. K., Duijts, L., Moll, H. A., Kelsey, K. T., Kobor, M. S., Lyle, R., Christensen, B. C., Felix, J. F., & Jones, M. J. (2019). Systematic evaluation and validation of reference and library selection methods for deconvolution of cord blood DNA methylation data. Clinical Epigenetics, 11(1), 1–15. https://doi.org/10.1186/s13148-019-0717-y
- Gómez-Olarte, S., Bolaños, N. I., Echeverry, M., Rodríguez, A. N., Cuéllar, A., Puerta, C. J., Mariño, A., & González, J. M. (2019). Intermediate Monocytes and Cytokine Production Associated With Severe Forms of Chagas Disease. Frontiers in Immunology, 10, 1671. https://doi.org/10.3389/fimmu.2019.01671
- Gong, L.-B., Wen, T., Li, Z., Xin, X., Che, X.-F., Wang, J., Liu, Y.-P., & Qu, X.-J. (2019). DYNC1I1 Promotes the Proliferation and Migration of Gastric Cancer by Up-Regulating IL-6 Expression. Frontiers in Oncology, 9(JUN), 491. https://doi.org/10.3389/fonc.2019.00491
- Graw, S., Henn, R., Thompson, J. A., & Koestler, D. C. (2019). PwrEWAS: A user-friendly tool for comprehensive power estimation for epigenome wide association studies (EWAS). BMC Bioinformatics, 20(1), 1–11. https://doi.org/10.1186/s12859-019-2804-7
- Groh, A. M., Roisman, G. I., Booth-Laforce, C., Fraley, R. C., Owen, M. T., Cox, M. J., & Burchinal, M. R. (2014). IV. Stability of attachment security from infancy to late adolescence. Monographs of the Society for Research in Child Development, 79(3), 51–66. https://doi.org/10.1111/mono.12113
- Gu, X., Mao, X., Lussier, M. P., Hutchison, M. A., Zhou, L., Hamra, F. K., Roche, K. W., & Lu, W. (2016). GSG1L suppresses AMPA receptor-mediated synaptic transmission and uniquely modulates AMPA receptor kinetics in hippocampal neurons. Nature Communications, 7(1), 1–18. https://doi.org/10.1038/ncomms10873
- Haertle, L., Müller, T., Lardenoije, R., Maierhofer, A., Dittrich, M., Riemens, R. J. M., Stora, S., Roche, M., Leber, M., Riedel-Heller, S., Wagner, M., Scherer, M., Ravel, A., Mircher, C., Cieuta-Walti, C., Durand, S., van de Hove, D. L. A., Hoffmann, P., Ramirez, A., El Hajj, N., & Mégarbané, A. (2019). Methylomic profiling in trisomy 21 identifies cognition- and Alzheimer’s disease-related dysregulation. Clinical Epigenetics, 11(1), 1. https://doi.org/10.1186/s13148-019-0787-x
- Hannum, G., Guinney, J., Zhao, L., Zhang, L., Hughes, G., Sadda, S. V., Zhang, L., Klotzle, B., Bibikova, M., Fan, J.-B., Gao, Y., Deconde, R., Chen, M., Rajapakse, I., Friend, S., Ideker, T., & Zhang, K. (2013). Genome-wide Methylation Profiles Reveal Quantitative Views of Human Aging Rates. Molecular Cell, 49(2), 359–367. https://doi.org/10.1016/j.molcel.2012.10.016
- Hazan, C., & Shaver, P. R. (1994). Deeper Into Attachment Theory. Psychological Inquiry, 5(1), 68–79. https://doi.org/10.1207/s15327965pli0501_15
- Henneman, P., Bouman, A., Mul, A., Knegt, L., Van Der Kevie-Kersemaekers, A.-M., Zwaveling-Soonawala, N., van Trotsenburg, A. S. P., Mannens, M. M., & Meijers-Heijboer, H. E. J. (2018). Widespread domain-like perturbations of DNA methylation in whole blood of Down syndrome neonates. PLoS ONE, 13(3), 3. https://doi.org/10.1371/journal.pone.0194938
- Hermansen, M. C. (2001). Nucleated red blood cells in the fetus and newborn. Archives of Disease in Childhood - Fetal and Neonatal Edition, 84(3), F211–F215. https://doi.org/10.1136/fn.84.3.F211
- Hertzman, C. (1999). The Biological Embedding of Early Experience and Its Effects on Health in Adulthood. Annals of the New York Academy of Sciences, 896(1), 85–95. https://doi.org/10.1111/j.1749-6632.1999.tb08107.x
- Hertzman, C. (2012). Putting the concept of biological embedding in historical perspective. Proceedings of the National Academy of Sciences of the United States of America, 109(Suppl._2), 17160–17167. https://doi.org/10.1073/pnas.1202203109
- Holland, S. M. (2019). Principal Components Analysis (PCA). Athens.
- Houseman, E. A., Accomando, W. P., Koestler, D. C., Christensen, B. C., Marsit, C. J., Nelson, H. H., Wiencke, J. K., & Kelsey, K. T. (2012). DNA methylation arrays as surrogate measures of cell mixture distribution. BMC Bioinformatics, 13(1), 86. https://doi.org/10.1186/1471-2105-13-86
- Hoye, J. R., Cheishvili, D., Yarger, H. A., Roth, T. L., Szyf, M., & Dozier, M. (2020). Preliminary indications that the Attachment and Biobehavioral Catch-up Intervention alters DNA methylation in maltreated children. Development and Psychopathology, 32(4), 1486–1494. https://doi.org/10.1017/S0954579419001421
- Islam, S. A., Goodman, S. J., Macisaac, J. L., Obradović, J., Barr, R. G., Boyce, W. T., & Kobor, M. S. (2019). Integration of DNA methylation patterns and genetic variation in human pediatric tissues help inform EWAS design and interpretation. Epigenetics & Chromatin, 12(1), 1. https://doi.org/10.1186/s13072-018-0245-6
- Jacobi, E., & Engelhardt, J. (2021). Modulation of information processing by AMPA receptor auxiliary subunits. The Journal of Physiology, 599(2), 471–483. https://doi.org/10.1113/JP276698
- Johnson, W. E., Li, C., & Rabinovic, A. (2007). Adjusting batch effects in microarray expression data using empirical Bayes methods. Biostatistics, 8(1), 118–127. https://doi.org/10.1093/biostatistics/kxj037
- Jones, M. J., Moore, S. R., & Kobor, M. S. (2018). Annual Review of Psychology Principles and Challenges of Applying Epigenetic Epidemiology to Psychology. Annual Review of Psychology, 69(1), 459–485. https://doi.org/10.1146/annurev-psych-122414-033653
- Jong, E., Strunk, T., Burgner, D., Lavoie, P. M., & Currie, A. (2017). The phenotype and function of preterm infant monocytes: Implications for susceptibility to infection. Journal of Leukocyte Biology, 102(3), 645–656. https://doi.org/10.1189/jlb.4RU0317-111R
- Kent, W. J., Sugnet, C. W., Furey, T. S., Roskin, K. M., Pringle, T. H., Zahler, A. M., & Haussler, A. D. (2002). The Human Genome Browser at UCSC. Genome Research, 12(6), 996–1006. https://doi.org/10.1101/gr.229102
- Khan, F., Chong, J. Y., Theisen, J. C., Fraley, R. C., Young, J. F., & Hankin, B. L. (2020). Development and change in attachment: A multiwave assessment of attachment and its correlates across childhood and adolescence. Journal of Personality and Social Psychology, 118(6), 1188–1206. https://doi.org/10.1037/pspi0000211
- Koestler, D. C., Jones, M. J., Usset, J., Christensen, B. C., Butler, R. A., Kobor, M. S., Wiencke, J. K., & Kelsey, K. T. (2016). Improving cell mixture deconvolution by identifying optimal DNA methylation libraries (IDOL). BMC Bioinformatics, 17(1), 1–21. https://doi.org/10.1186/s12859-016-0943-7
- Kolb, B., Mychasiuk, R., Muhammad, A., Li, Y., Frost, D. O., & Gibb, R. (2012). Experience and the developing prefrontal cortex. Proceedings of the National Academy of Sciences of the United States of America, 109(SUPPL.2), 17186–17196. https://doi.org/10.1073/pnas.1121251109
- Korthauer, K., Kimes, P. K., Duvallet, C., Reyes, A., Subramanian, A., Teng, M., … Hicks, S. C. (2019). A practical guide to methods controlling false discoveries in computational biology. Genome Biology, 20(1), 118. https://doi.org/10.1186/s13059-019-1716-1
- Lam, L. L., Emberly, E., Fraser, H. B., Neumann, S. M., Chen, E., Miller, G. E., & Kobor, M. S. (2012). Factors underlying variable DNA methylation in a human community cohort. PNAS, 109(Suppl. 2), 17253–17260. https://doi.org/10.1073/pnas.1121249109
- Letourneau, N. L., Tryphonopoulos, P. D., Novick, J., Hart, J. M., Giesbrecht, G., & Oxford, M. L. (2018). Nursing Child Assessment Satellite Training Parent-Child Interaction Scales: Comparing American and Canadian Normative and High-Risk Samples. Journal of Pediatric Nursing, 40, 47–57. https://doi.org/10.1016/j.pedn.2018.02.016
- Louis, F., Piron, G., Schaaf-Lafontaine, R., & Belaiche. (1998). Tumour necrosis factor (TNF) gene polymorphism influences TNF-α production in lipopolysaccharide (LPS)-stimulated whole blood cell culture in healthy humans. Clinical & Experimental Immunology, 113(3), 401–406. https://doi.org/10.1046/j.1365-2249.1998.00662.x
- Luecken, L. J., & Lemery, K. S. (2004). Early caregiving and physiological stress responses. Clinical Psychology Review, 24(2), 171–191. https://doi.org/10.1016/j.cpr.2004.01.003
- Lundgaard, I., Li, B., Xie, L., Kang, H., Sanggaard, S., Haswell, J. D. R., … Nedergaard, M. (2015). Direct neuronal glucose uptake heralds activity-dependent increases in cerebral metabolism. Nature Communications, 6(1), 1–12. https://doi.org/10.1038/ncomms7807
- Madigan, S., Moran, G., Schuengel, C., Pederson, D. R., & Otten, R. (2007). Unresolved maternal attachment representations, disrupted maternal behavior and disorganized attachment in infancy: Links to toddler behavior problems. Journal of Child Psychology and Psychiatry, 48(10), 1042–1050. https://doi.org/10.1111/j.1469-7610.2007.01805.x
- Main, M., & Solomon, J. (1986). Discovery of an insecure-disorganized/disoriented attachment pattern. In T. B. Brazelton & M. W. Yogman (Eds.), Affective development in infancy (pp. 95–124). Ablex Publishing. https://psycnet.apa.org/record/1986-97821–005
- Main, M., & Hesse, E. (1990). Parents’ unresolved traumatic experiences are related to infant disorganized attachment status: Is frightened and/or frightening parental behavior the linking mechanism? In M. T. Greenberg, D. Cicchetti, & E. M. Cummings (Eds.), The John D. and Catherine T. MacArthur Foundation series on mental health and development. Attachment in the preschool years: Theory, research, and intervention (pp. 161–182). University of Chicago Press. https://psycnet.apa.org/record/1990-98514-005
- Main, M., & Solomon, J. (1990). Procedures for identifying infants as disorganized/disoriented during the Ainsworth strange situation. In M. T. Greenberg, D. Cicchetti, & E. M. Cummings (Eds.), Attachment in the Preschool Years: Theory, Research, and Intervention (pp. 121–160). The University of Chicago Press. https://books.google.ca/books?hl=en&lr=&id=WzHIfiCXE8EC&oi=fnd&pg=PA121&dq=Main,+M.,+%26+Solomon,+J.+(1990).+Procedures+for+identifying+infants+as+disorganized/disoriented+during+the+Ainsworth+strange+situation.+In+M.+Greenberg,+D.+Cicchetti,+%26+E.+M.+Cummings+(Eds.),+Attachment+in+the+preschool+years+(pp.+121-160).+University+of+Ch&ots=WVogvEysUs&sig=HxkmRQsNsHN_crrHDytIL471krg&redir_esc=y#v=onepage&q&f=false
- Main, M., & Stadtman, J. (1981). Infant Response to Rejection of Physical Contact by the Mother. Journal of the American Academy of Child Psychiatry, 20(2), 292–307. https://doi.org/10.1016/S0002-7138(09)60990-0
- Malhotra, A. K., Kestler, L. J., Mazzanti, C., Bates, J. A., Goldberg, T., & Goldman, D. (2002). A functional polymorphism in the COMT gene and performance on a test of prefrontal cognition. American Journal of Psychiatry, 159(4), 652–654. https://doi.org/10.1176/appi.ajp.159.4.652
- Maltby, V. E., Lea, R. A., Graves, M. C., Sanders, K. A., Benton, M. C., Tajouri, L., … Lechner-Scott, J. (2018). Genome-wide DNA methylation changes in CD19+ B cells from relapsing-remitting multiple sclerosis patients. Scientific Reports, 8(1), 1–10. https://doi.org/10.1038/s41598-018-35603-0
- Mao, X., Gu, X., & Lu, W. (2017). GSG1L regulates the strength of AMPA receptor-mediated synaptic transmission but not AMPA receptor kinetics in hippocampal dentate granule neurons. Journal of Neurophysiology, 117(1), 28–35. https://doi.org/10.1152/jn.00307.2016
- Marioni, R. E., Mcrae, A. F., Bressler, J., Colicino, E., Hannon, E., Li, S., … Deary, I. J. (2018). Meta-analysis of epigenome-wide association studies of cognitive abilities. Molecular Psychiatry, 23(11), 2133–2144. https://doi.org/10.1038/s41380-017-0008-y
- Mayne, J. (2012). Contribution analysis: Coming of age? Evaluation, 18(3), 270–280. https://doi.org/10.1177/1356389012451663
- Mcgowan, P. O., Suderman, M., Sasaki, A., Huang, T. C. T., Hallett, M., Meaney, M. J., & Szyf, M. (2011). Broad Epigenetic Signature of Maternal Care in the Brain of Adult Rats. PLoS One, 6(2), e14739. https://doi.org/10.1371/journal.pone.0014739
- Measelle, J. R., & Ablow, J. C. (2018). Contributions of early adversity to pro-inflammatory phenotype in infancy: The buffer provided by attachment security. Attachment and Human Development, 20(1), 1–23. https://doi.org/10.1080/14616734.2017.1362657
- Measelle, J. R., David, J., & Ablow, J. C. (2017). Increased levels of inflammation among infants with disorganized histories of attachment. Behavioural Brain Research, 325(Part B), 260–267. https://doi.org/10.1016/j.bbr.2016.12.001
- Meins, E. (1997). Security of attachment and the social development of cognition. In Essays in developmental psychology. Psychology Press. Retrieved October 15, 2020, from https://psycnet.apa.org/record/1997-36371–000
- Mendenhall, E. M., & Bernstein, B. E. (2008). Chromatin state maps: New technologies, new insights. Current Opinion in Genetics and Development, 18(2), 109–115. https://doi.org/10.1016/j.gde.2008.01.010
- Merrill, S. M., Gladish, N., & Kobor, M. S. (2019). Social environment and epigenetics. In Current topics in behavioral neurosciences (vol. 42, pp. 83–126). Springer. https://doi.org/10.1007/7854_2019_114
- Mesman, J., van Ijzendoorn, M. H., & Sagi-Schwartz, A. (2016). Cross-cultural patterns of attachment: Universal and contextual dimensions. In J. Cassidy & P. R. Shaver (Eds.), Handbook of attachment: Theory, research, and clinical applications (3rded., pp. 852–877). The Guilford Press. https://d1wqtxts1xzle7.cloudfront.net/49637071/chapter_handbook_2016.pdf?1476616663=&response-content-disposition=inline%3B+filename%3DCross_cultural_patterns_of_attachment_Un.pdf&Expires=1614329839&Signature=dJ0goq4KDS5lrZw2oQ1xxPTWW2VYpUZT-d9EiMUR9QR-NJSuU0-BE13DXEpB1v-PS1JoFPFfd85xQL4pt~yejXURYQCZqVAk2Bu1Umv5tntDiAyKF38CdmecBbPpqIs9waxapZ7S4IRRmGLXN1o1~YfvFpiCcsdyCGJRVbxqid8c0vCSf3cCc3eIpH4d5cWuSeiMIPbONMm2pvJ73Tt5-fQJYtc3K-PrrJlNDCnwyktiH34pTXm2oXTu55frL6RyjKCUQ73l23hkLss-NTspN6n59WUi7b-1-~b1lBZdkRDN3eDNf~RGuWxWJuaDaEaaPjWRxRRXpe6heXe7VQJ0hA__&Key-Pair-Id=APKAJLOHF5GGSLRBV4ZA
- Mi, G., Di, Y., Emerson, S., Cumbie, J. S., & Chang, J. H. (2012). Length Bias Correction in Gene Ontology Enrichment Analysis Using Logistic Regression. PLoS ONE, 7(10), 46128. https://doi.org/10.1371/journal.pone.0046128
- Miller, G. E., & Chen, E. (2010). Harsh family climate in early life presages the emergence of a proinflammatory phenotype in adolescence. Psychological Science : A Journal of the American Psychological Society/APS, 21(6), 848–856. https://doi.org/10.1177/0956797610370161
- Miller, G. E., Chen, E., & Parker, K. J. (2011). Psychological Stress in Childhood and Susceptibility to the Chronic Diseases of Aging: Moving Toward a Model of Behavioral and Biological Mechanisms. Psychological Bulletin, 137(6), 959–997. https://doi.org/10.1037/a0024768
- Mooney, M. A., Ryabinin, P., Wilmot, B., Bhatt, P., Mill, J., & Nigg, J. T. (2020). Large epigenome-wide association study of childhood ADHD identifies peripheral DNA methylation associated with disease and polygenic risk burden. Translational Psychiatry, 10(1), 1–12. https://doi.org/10.1038/s41398-020-0710-4
- Moore, S. R., Mcewen, L. M., Mah, S. M., & Kobor, M. S. (2017). Epigenetic correlates of neonatal contact in humans. Development and Psychopathology, 29(5), 1517–1538. https://doi.org/10.1017/S0954579417001213
- Moss, E., & St-Laurent, D. (2001). Attachment at school age and academic performance. Developmental Psychology, 37(6), 863–874. https://doi.org/10.1037/0012-1649.37.6.863
- Nagy, C., & Turecki, G. (2012). Sensitive periods in epigenetics: Bringing us closer to complex behavioral phenotypes. Epigenomics, 4(4), 445–457. https://doi.org/10.2217/epi.12.37
- Oxford, M. & Finlay, D. (2013). Parent-Child Interaction Teaching Scale manual(2nd ed.). NCAST Programs.
- Pérez, R. F., Santamarina, P., Tejedor, J. R., Urdinguio, R. G., Álvarez-Pitti, J., Redon, P., … Lurbe, E. (2019). Longitudinal genome-wide DNA methylation analysis uncovers persistent early-life DNA methylation changes. Journal of Translational Medicine, 17(1), 1–16. https://doi.org/10.1186/s12967-018-1751-9
- Pidsley, R., Wong, Y., Volta, C. C., Lunnon, M., Mill, J., K., & Schalkwyk, L. C. (2013). A data-driven approach to preprocessing Illumina 450K methylation array data. In BMC Genomics, 14(1), 1–10. http://www.biomedcentral.com/1471-2164/14/293.
- Pidsley, R., Zotenko, E., Peters, T. J., Lawrence, M. G., Risbridger, G. P., Molloy, P., Van Djik, S., Muhlhausler, B., Stirzaker, C. & Clark, S. J. (2016). Critical evaluation of the Illumina MethylationEPIC BeadChip microarray for whole-genome DNA methylation profiling. Genome Biology, 17(1), 1–17.
- Pietromonaco, P. R., & Powers, S. I. (2015, February). Attachment and health-related physiological stress processes. Current Opinion in Psychology, 1, 34–39. https://doi.org/10.1016/j.copsyc.2014.12.001
- Prame Kumar, K., Nicholls, A. J., & Wong, C. H. Y. (2018). Partners in crime: Neutrophils and monocytes/macrophages in inflammation and disease. Cell and Tissue Research, 371(3), 551–565. https://doi.org/10.1007/s00441-017-2753-2
- Price, E. M., Cotton, A. M., Lam, L. L., Farré, P., Emberly, E., Brown, C. J., … Kobor, M. S. (2013). Additional annotation enhances potential for biologically-relevant analysis of the Illumina Infinium HumanMethylation450 BeadChip array. Epigenetics & Chromatin, 6(1), 1–15. https://doi.org/10.1186/1756-8935-6-4
- Provenzi, L., Brambilla, M., Scotto di Minico, G., Montirosso, R., & Borgatti, R. (2020). Maternal caregiving and DNA methylation in human infants and children: Systematic review. Genes, Brain and Behavior, 19(3), e12616. https://doi.org/10.1111/gbb.12616
- Puig, J., Englund, M. M., Simpson, J. A., & Collins, W. A. (2013). Predicting adult physical illness from infant attachment: A prospective longitudinal study. Health Psychology, 32(4), 409–417. https://doi.org/10.1037/a0028889
- Ren, X., & Kuan, P. F. (2019). methylGSA: A Bioconductor package and Shiny app for DNA methylation data length bias adjustment in gene set testing | Bioinformatics | Oxford Academic. Bioinformatics, 35 (11), 1958–1959. https://academic.oup.com/bioinformatics/article/35/11/1958/5140219
- Repetti, R. L., Taylor, S. E., & Seeman, T. E. (2002). Risky families: Family social environments and the mental and physical health of offspring. Psychological Bulletin, 128(2), 330–366. https://doi.org/10.1037/0033-2909.128.2.330
- Robakis, T. K., Zhang, S., Rasgon, N. L., Li, T., Wang, T., Roth, M. C., … Urban, A. E. (2020). Epigenetic signatures of attachment insecurity and childhood adversity provide evidence for role transition in the pathogenesis of perinatal depression. Translational Psychiatry, 10(1), 1–14. https://doi.org/10.1038/s41398-020-0703-3
- Roberts, A. L., Gladish, N., Gatev, E., Jones, M. J., Chen, Y., MacIsaac, J. L., Tworoger, S. S., Austin, S.B., Tanrikut, C., Chavarro, J. E. Baccarelli, A. A., & Kobor, M. S. (2018). Exposure to childhood abuse is associated with human sperm DNA methylation. Translational Psychiatry, 8(1), 1–11.
- Samson, L. D., Boots, A. M. H., Verschuren, W. M. M., Picavet, H. S. J., Engelfriet, P., & Buisman, A. M. (2019, October). Frailty is associated with elevated CRP trajectories and higher numbers of neutrophils and monocytes. Experimental Gerontology, 125, 110674. https://doi.org/10.1016/j.exger.2019.110674
- Shah, P. E., Fonagy, P., & Strathearn, L. (2010). Is attachment transmitted across generations? the plot thickens. Clinical Child Psychology and Psychiatry, 15(3), 329–345. https://doi.org/10.1177/1359104510365449
- Sherman, L. J., Rice, K., & Cassidy, J. (2015, September). Infant capacities related to building internal working models of attachment figures: A theoretical and empirical review. Developmental Review, 37, 109–141. https://doi.org/10.1016/j.dr.2015.06.001
- Slopen, N., Kubzansky, L. D., McLaughlin, K. A., & Koenen, K. C. (2013). Childhood adversity and inflammatory processes in youth: A prospective study. Psychoneuroendocrinology, 38(2), 188–200. https://doi.org/10.1016/j.psyneuen.2012.05.013
- Smith, A. K., Kilaru, V., Kocak, M., Almli, L. M., Mercer, K. B., Ressler, K. J., … Conneely, K. N. (2014). Methylation quantitative trait loci (meQTLs) are consistently detected across ancestry, developmental stage, and tissue type. BMC Genomics, 15(1), 1–11. https://doi.org/10.1186/1471-2164-15-145
- Sroufe, L. A. (2005). Attachment and development: A prospective, longitudinal study from birth to adulthood. Attachment and Human Development, 7(4), 349–367. https://doi.org/10.1080/14616730500365928
- Sroufe, L. A., Carlson, E. A., Levy, A. K., & Egeland, B. (1999). Implications of attachment theory for developmental psychopathology. Development and Psychopathology, 11(1), 1–13. https://doi.org/10.1017/S0954579499001923
- ter Braak, C. J. F. (1992). Permutation Versus Bootstrap Significance Tests in Multiple Regression and Anova. In K. Jöckel, G. Rothe, & W. Sendler, (Eds.), Bootstrapping and Related Techniques (pp. 79–85). Springer, Berlin, Heidelberg. https://doi.org/10.1007/978-3-642-48850-4_10
- Ursini, G., Bollati, V., Fazio, L., Porcelli, A., Iacovelli, L., Catalani, A., … Bertolino, A. (2011). Stress-related methylation of the catechol-O-methyltransferase val158 allele predicts human prefrontal cognition and activity. Journal of Neuroscience, 31(18), 6692–6698. https://doi.org/10.1523/JNEUROSCI.6631-10.2011
- Van Ijzendoorn, M. H., Schuengel, C., & Bakermans-Kranenburg, M. J. (1999). Disorganized attachment in early childhood: Meta-analysis of precursors, concomitants, and sequelae. Development and Psychopathology, 11(2), 225–249. https://doi.org/10.1017/s0954579499002035
- Vidrascu, E. M., Bashore, A. C., Howard, T. D., & Moore, J. B. (2019). Effects of early- and mid-life stress on DNA methylation of genes associated with subclinical cardiovascular disease and cognitive impairment: A systematic review. BMC Medical Genetics, 20(1), 1–12. https://doi.org/10.1186/s12881-019-0764-4
- Walsh, E., Blake, Y., Donati, A., Stoop, R., & Von Gunten, A. (2019). Early secure attachment as a protective factor against later cognitive decline and dementia. Frontiers in Aging Neuroscience, 10(JUL), 161. https://doi.org/10.3389/fnagi.2019.00161
- Walton, E., Liu, J., Hass, J., White, T., Scholz, M., Roessner, V., … Ehrlich, S. (2014). MB-COMT promoter DNA methylation is associated with working-memory processing in schizophrenia patients and healthy controls. Epigenetics, 9(8), 1101–1107. https://doi.org/10.4161/epi.29223
- Waters, H. S., & Waters, E. (2006). The attachment working models concept: Among other things, we build script-like representations of secure base experiences. Attachment & Human Development, 8(3), 185–197. https://doi.org/10.1080/14616730600856016
- West, K. K., Mathews, B. L., & Kerns, K. A. (2013). Mother-child attachment and cognitive performance in middle childhood: An examination of mediating mechanisms. Early Childhood Research Quarterly, 28(2), 259–270. https://doi.org/10.1016/j.ecresq.2012.07.005
9. Appendix
9.1 Biological Sample and Data Preprocessing Details
Venipuncture blood draws were performed by a certified pediatric phlebotomist at the Behavioural Research Unit in Alberta Children’s Hospital as dictated in the University of Calgary approved REB. Whole blood samples were collected and briefly stored at −80°C before being centrifuged at 3000 RCF for 15 minutes to separate and pipette. Samples were then shipped on dry ice to Dr. Kobor’s Lab at the University of British Columbia for DNA extraction and measurement.