
 ?Mathematical formulae have been encoded as MathML and are displayed in this HTML version using MathJax in order to improve their display. Uncheck the box to turn MathJax off. This feature requires Javascript. Click on a formula to zoom.
ABSTRACT
This study investigates the impact of geopolitical risk (GPR) on sustainable investments, focusing on five global environmental indices and two global GPR indices. Using Corrected Dynamic Conditional Correlation Generalised Autoregressive Conditional Heteroskedasticity (cDCC-GARCH) model and Diebold and Yilmaz’s spillover analysis, we use daily data from January 2009 to October 2022, covering various market phases, including the European sovereign debt crisis, the COVID-19 pandemic, and the war in Ukraine. Results from the cDCC-GARCH model reveal high dynamic conditional correlations. During periods of high volatility, environmental indices displayed simultaneous and more intense responses, limiting investment diversification alternatives when considering only the environmental side. Diebold and Yilmaz’s static analysis demonstrates that environmental segments are more influenced by systemic shocks than specific causes, with GPR’s influence proving relatively weak. In the dynamic analysis, the spillover effects of GPR in environmental segments intensified during the pandemic crisis and the invasion of Ukraine, affecting market conditions.
1. Introduction
In recent decades, business management models have described an evolutionary path towards accommodating the different perspectives of stakeholders (Freeman, Citation2008; Wood, Citation2008), going beyond the mere financial point of view advocated in Friedman’s proposal (1970), according to which a company’s sole mission is to maximise value for shareholders.
Concerns related to global warming, climate change, the environment, and human and social rights, among other issues, made stakeholders start to see sustainability as a strategic vector, as it can also help add value to business from a long-term perspective (KPMG, Citation2011; Porter & Kramer, Citation2006; Vives & Wadhwa, Citation2012).
Increasingly, investors seek to reconcile their financial objectives with the sustainability of society, taking into account social, environmental and governance issues (European Sustainable Investment Forum – Eurosif, Citation2008; Lombardo & D’Orio, Citation2012; Statman & Glushkov, Citation2008). In this context of greater awareness of sustainability-related issues, new types of assets have emerged, reconciling financial objectives with the various dimensions of sustainability, as well as several sustainable shareholder indices (Cortez et al., Citation2009). World investment in sustainable assets has increased in importance, rising from $13.3 trillion in 2012 to $30.3 trillion in 2022. Promoting green finance in order to channel investments towards green projects and activities that are environmentally friendly becomes increasingly necessary as climate change accelerates (Yousaf, Suleman, et al., Citation2022; among others). However, as green investing can be exposed to both systematic and idiosyncratic geopolitical risk, it is crucial to consider the impact exerted by geopolitical events on these relatively new financial instruments. Despite the growing research interest in the topic of sustainable investment, the number of studies developed in this area is small, and few studies explore the behavioural mechanisms of sustainable stock indices or consider the role of global GPR, disaggregated on its two different dimensions, as a factor determining the behaviour of this type of investment asset.
The geopolitical risks, currently ranked among the top five global business threats (e.g. C. Lee et al., Citation2021), are one of the most crucial factors affecting businesses belonging to different sectors. Several studies were conducted to highlight the major consequences of the geopolitical risks among different settings and facets, such as energy, trade flows, stock market returns, investment, renewable energy consumption, renewable energy deployment, oil prices, insurance premiums, tourism investment and tourism destination selection, among others (e.g. Su et al., Citation2021; Gupta et al., Citation2019; Apergis et al., Citation2018; Bilgin et al., Citation2020; Sweidan, Citation2021; W. Zhang et al., Citation2022; C. Lee et al., Citation2021; Sarker et al., Citation2023; among others). Moreover, Zhao et al. (Citation2021) argued that environmental and economic indicators can be affected by geopolitical risks making nations more likely to lose their welfare benefits as unfavourable geopolitical events change the direction of investment spending towards less productive uses like reconstruction and security (Olanipekun & Alola, Citation2020).
As a global phenomenon, geopolitical risk has been considered a factor with the ability to influence financial markets (Cheng & Chiu, Citation2018; Das et al., Citation2019; Gu et al., Citation2021; C. Lee & Chen, Citation2020). With the rapid development of information technology, stock trading has become easier and stock prices have become more sensitive to GPR shocks. Several recent studies recognise the negative effect of geopolitical risks on asset prices, including green assets (Caldara & Iacoviello, Citation2018; Balcilar et al., Citation2018; Hoque et al., Citation2019; Smales, Citation2021; Shahzad et al., Citation2023; Sarker et al., Citation2023). Frequent geopolitical shocks, such as terrorist attacks, escalating military conflicts, or tensions from wars, are associated with economic downturns, which penalise trade and global economic welfare (Glick & Taylor, Citation2010).
Over recent decades, due to globalisation, financial market integration among developed and emerging markets has occurred (Boţoc & Anton, Citation2020). Thus, understanding the behaviour of international stock markets represents a key issue for investors, portfolio managers, and policymakers all over the world, to deal with crises spreading from one stock market to another, or even crises with origin out the financial markets but which impact them. Additionally, many of the post-communist economies find themselves heavily reliant on energy sources subject to geopolitical influences, exposing them to the uncertainties of global energy markets and the political manoeuvres of energy-rich nations. Recognising the vulnerabilities inherent in such dependencies, these economies are increasingly turning their attention to alternative energy sources and environmental investments as strategic avenues for long-term sustainability, justifying also the interest of these economies in the analysis performed.
Several world crises (eg., the Global financial crisis (GFC) or the European sovereign debt crisis (ESDC)) have shaken the world economies and financial market, with the last facing a turmoil period characterised by a simultaneous downfall, high volatility and uncertainty (Dua & Tuteja, Citation2016). The most recent world crisis, although with no financial origin, the COVID-19 pandemic crisis, had also a significant impact on world economies and financial markets, as concluded by Singh et al. (Citation2021), Salisu and Shaik (Citation2022) and Umar et al. (Citation2021). The war in Ukraine had also global impacts, it has not only led to a sharp increase in the GPR faced by regional and international financial markets (Umar, Polat, et al., Citation2022) as well as a global energy crisis that raises the prospect of returning to some sources of electricity that are far from green and environmentally friendly (Borowski, Citation2022). Major global crises, such as the COVID-19 pandemic and geopolitical conflicts, can significantly impact market sentiment and investor risk appetite, leading investors to adopt a more risk-averse approach, increasing market volatility and potential declines in asset prices, including the environmental indices. This, allied with the importance of sustainability in today’s society and by the need to deepen the study of the various segments of sustainable investment, in a context of great complexity, due to the combined consequences of the pandemic crisis and the war in Ukraine, constitutes motivations to the development of our study. Motivated also by the global impact of sustainable investing during the last two decades, the following research questions were defined: 1) Do environmental segments maintain a close relationship with GPR indices? 2) Do environmental segments and GPR indices generate static or dynamic spillover effects between each other? 3) Are the responses of environmental segments to shocks to GPR indices positive or negative? 4) Are the responses of environmental segments more influenced by threats or by events? 5) Are the environmental segments and GPR indices net transmitters or receivers of spillovers? 6) Did the pandemic crisis or the war in Ukraine imply changes in the spillover transmission process between environmental segments and GPR indices?
To meet the research objectives, this uses the Corrected Dynamic Conditional Correlation Generalised Autoregressive Conditional Heteroskedasticity (cDCC-GARCH) multivariate model, proposed by Aielli (Citation2013), in order to follow the connectivity generated between the variables studied over time. This is particularly relevant in the analysis of financial markets behaviour, where correlations between asset returns can change over time due to market dynamics and shifts in investor sentiment. Furthermore, as this model incorporates the volatility dynamics, it allows the mitigation of the potential biases that could arise if correlations were estimated without considering volatility effects. This model allows for recognising probable fluctuations in conditional correlations during the sample period, enabling the detection of dynamic investor behaviour in reaction to the GPR volatility (Aydoğan et al., Citation2017). In addition to this model, we use the methodological proposal by Diebold and Yilmaz (Citation2012, Citation2015), which allows us to analyse the magnitude of the spillover effects generated between the variables. Both models are estimated based on daily frequency data from January 2009 to October 2022 (3581 observations), involving five global environmental indices (alternative energy, sustainable water, green building, clean technology, and pollution prevention) and two indices related to global political risk (threat risk and event risk). Due to the growing recognition of environmental sustainability and the need for incorporating environmental factors into investment decision-making, it is important to analyse the behaviour of environmental indices, as it could allow investors to align their investment decisions with their environmental values and contribute to a more sustainable future.
The present makes several contributions to the literature. Previous studies on this topic employed other methodological approaches (eg. dummy variables), to identify episodes of geopolitical risk (Medel, Citation2015; Zhang et al., Citation2018) but without quantifying their magnitude. Our study tries to fill this gap and uses the methodological proposal of Diebold and Yilmaz (Citation2012, Citation2015) to quantify the referred magnitude. As far as we know, this is also the first study that uses the cDCC-GARCH model to analyse the dynamic correlations considering the disaggregated GPR index in its two different dimensions (acts and threats), and several indices representative of companies with high environmental performance. The referred disaggregation is pivotal for understanding whether the severity of geopolitical risks primarily stems from increased threats or the realisation of such threats as acts. Furthermore, analysing the differential impacts of geopolitical threats and acts on sustainable investment sheds light on the resilience of green investments to those exogenous shocks. Additionally, the assessment of the impact of these both different geopolitical dimensions is also relevant, first in order to avoid an aggregated bias and second as it could have important implications since adverse geopolitical acts may trigger a rise in geopolitical threats and because differentiating between geopolitical threats and acts tends to serve as an effective learning mechanism for investors and risk managers, allowing them to appropriately assess the risk component in their portfolios. Furthermore, this study has the ability to quantify the magnitude of the spillover effects generated by applying the methodological proposal by Diebold and Yilmaz (Citation2012, Citation2015). Secondly, this work is pioneering to deepening understanding of environmental investment behaviour based on geopolitical risk by simultaneously combining global-scale variables of geopolitical risk in order to explore their respective interaction mechanisms. Lastly, by considering a large sample acrossmultiple market phases, from the European sovereign debt crisis (ESDC) to the COVID-19 pandemic, and also the most recent extreme event, the war in Ukraine, we create conditions for a comprehensive exploration of the interaction mechanisms between environmental investment and the various dimensions of geopolitical risk, especially in periods of high turbulence.
The remainder of this is structured as follows: Section 2 presents a brief literature review, focused on studies related to the relationship between geopolitical risk and sustainable investment, as well as on the relationship between sustainable investment. Section 3 introduces the data and methodology. Section 4 reviews the results of the empirical analysis. Section 5 summarises the main findings of this study and points out some of its main implications.
2. Literature review
Concerns about sustainability have become a central issue today. In this regard, several international initiatives have been implemented to reinforce this centrality. The 2030 Agenda, launched in September 2015 by the United Nations (UN), which defined the 17 Sustainable Development Goals (SDGs), was perhaps the most significant initiative of the last decades in terms of sustainability and climate change. Of the various issues advocated by this UN initiative, one highlights the importance of the financial system and socially responsible investment in supporting the fight against climate change.
The importance given to the issue of sustainability in recent years has not only led investors to shift their focus towards greeninvestments (Dutta et al., Citation2020) but also has given rise to the creation of several sustainable assets aiming to reconcile financial and non-financial objectives, namely sustainable stock indices. These indices are relatively recent, the first one appearing in 1990, called Social Domini 400 Index (DSI). Over the last few decades, several sustainable indices have been created, seeking to cover various aspects of sustainability.
With the spread of the COVID-19 pandemic, the prices of traditional energy stocks were strongly impacted, people are becoming aware of the importance of protecting the environment and sustainable investment is becoming the preferred investment option (W. Zhang et al., Citation2022). Mirza et al. (Citation2023) aimed to assess the interlinkages of sustainable investments. In order to account for sustainable investment performance, authors combined a dependency network analysis using partial correlation and a centrality network analysis using the minimal spanning tree (MST), in static and dynamic ways. The authors analysed the interdependence and its determinants across multiple countries between January 2009 and March 2021 (covering some market turmoil, i.e. the ESDC, the Greek systemic problem, the Chinese stock market crash, and the COVID-19 outbreak). Using daily data from Dow Jones Sustainability Indices of 16 countries (namely Finland, France, Germany, Italy, Netherlands, Portugal, Spain, Sweden, UK, US, Canada, India, Japan, Korea, Taiwan, and Thailand) it was found an increase in dependence during the outbreak of the COVID-19 pandemic. The centrality network revealed the prominent significance of sustainable investments in European countries, with France identified as the lead risk transmitter while Japan and Taiwan show risk reception among international markets. Gold price volatility was identified as the key driver of the interdependence of sustainable investments.
Although sustainable investment has aroused great interest among investors and academics, little scientific research has been devoted to the subject. The vast majority of studies involving sustainable investment have focused on comparing its performance against that of traditional investment (Broadstock et al., Citation2021; Marti et al., Citation2015; Martinez-Ferrero & Frias-Aceituno, Citation2015; Miralles-Quirós et al., Citation2018; Ransariya & Bhayani, Citation2015), with little scientific research on the determinants of the behaviour of sustainable indices. Furthermore, there are sparse studies known (except the ones of Sohag et al. (Citation2022), C. Lee et al. (Citation2021), Yang et al. (Citation2021) and Sweidan (Citation2021)) that sought to understand the role of geopolitical risk in environmental investment. Despite some studies have documented how the Russia-Ukraine war affected financial markets’ performance and interrelationships from different perspectives (e.g. Adekoya et al., Citation2022; Będowska-Sójka et al., Citation2022; Boungou & Yatié, Citation2022; Chortane & Pandey, Citation2022; Gaio et al., Citation2022; Khalfaoui et al., Citation2022; Lo et al., Citation2022; Shahzad et al., Citation2023; Umar, Bossman, et al., Citation2022; Wang et al., Citation2022; Yousaf, Patel, et al., Citation2022) there is no study, to the best of our knowledge, that evaluated the impact of GPR (on its two different dimensions) on environmental investment during the most recent world extreme events.
The impact of geopolitical risk on asset prices and economic variables has been the subject of study in several research (see, for example, Shahzad et al. (Citation2023) for an extensive literature review), but limited research is devoted to the analysis of the impact of GPR (and its two different dimensions) on sustainable investment, justifying its assessment. Generally, the literature concludes that geopolitical risks significantly affect financial assets’ performance (Fernandez, Citation2008; Zhou et al., Citation2020), as well as economic agents’ decisions about their investments, which subsequently affect the performance of the underlying financial assets (Apergis et al., Citation2018; Bouri et al., Citation2019; Caldara & Iacoviello, Citation2018).
Geopolitical risks are among the main informational elements considered by economic agents in financial decisions (Dogan et al., Citation2021). In situations of high political tension, negative impacts occur on economic activities, shareholder returns and on capital outflows from economies where tensions are identified (Caldara & Iacoviello, Citation2018). Political instability can have a significant effect on equity markets through changes in the cross-correlation between different assets, investment portfolio formation, and decisions regarding diversification (Elsayed & Helmi, Citation2021; Omar et al., Citation2017). In turn, situations of social unrest, armed conflict and terrorist attacks can generate high levels of risk and uncertainty, with a very significant impact on equity assets and financial markets (Elsayed & Yarovaya, Citation2019; Guidolin & La Ferrara, Citation2010; Kollias et al., Citation2013).
In order to measure geopolitical risk, Caldara and Iacoviello (Citation2018) bring a very important contribution, bridging the gaps identified in previous studies by creating the GPR index. This index is based on word counts published in newspaper articles reporting the occurrence or worsening of adverse events, as well as the existence of military and nuclear tension, allowing to detect both the direct and indirect risks of geopolitical events. Husnain et al. (Citation2022) highlight the importance of the GPR index. This index offers a time-consistent, holistic, and real-time approach to capture geopolitical risk, and it is superior to other indicators.
The GPR has been frequently applied in several recent (e.g. Wang et al., Citation2022; Jalkh & Bouri, Citation2022; Alqahtani et al., Citation2020; Bouri et al., Citation2023; Sarker et al., Citation2023), many of them using multivariate models of conditional heteroscedasticity, namely BEKK (Baba, Engle, Kraft and Kroner) and DCC (dynamic conditional correlation) models, among others, leading to the conclusion that geopolitical risk helps explain stock price declines (Antonakakis et al., Citation2013; Arin et al., Citation2008; Aslam & Kang, Citation2015; Cai & Wu, Citation2021; Hoque & Zaidi, Citation2020; Smales, Citation2021; Zhou et al., Citation2020). However, there is no consensus in the literature regarding the impact of geopolitical risk on traditional equity markets. Balcilar et al. (Citation2018) investigated the effect of geopolitical risk on BRICS equity markets and found that geopolitical risk does not help explain equity returns in the respective markets, producing only an effect on their volatilities. In turn, Bouri et al. (Citation2019) concluded that GPR influences stock market volatility and can help predict Islamic bond returns and volatility. Bouri et al. (Citation2023) evaluated the effect of oil implied volatility (OVX) and GPR on eight Gulf Cooperation Council (GCC) stock sectors under various market conditions and found, generally, a stronger effect of OVX than that of GPR. Aiming to evaluate if GCC countries stock markets are more responsive to international-induced risk or regional-induced risk, Alqahtani et al. (Citation2020) analysed the ability of two geopolitical risk indices, the global GPR and the Saudi GPR, to predict the stock returns of GCC countries from February 2007 to December 2019. The global GPR and the Saudi GPR indices revealed weak evidence of in-sample predictability of excess stock returns. However, the out-of-sample forecasts show that only the global GPR index provides superior prediction in the context of Kuwaiti and Omani stock markets, compared to the historical average benchmark model.
The literature contains several that have analysed the relationship between geopolitical risk and traditional equity markets in various geographies. However, with exception of the studies of Sarker et al. (Citation2023), Sohag et al. (Citation2022), C. Lee et al. (Citation2021), Yang et al. (Citation2021) and Sweidan (Citation2021), empirical studies about the relationship between this type of risk and environmental assets are lacking. Sarker et al. (Citation2023) investigated the asymmetric effects of climate policy uncertainty (CPU), GPR and crude oil prices (WTI) on the realised volatility of the returns of clean energy prices (CEP) in the USA. It was found evidence of asymmetric effects of CPU, GPR and WTI on the realised volatility of the returns of the CEP’s, as well as different effects in the short and long run on the CEP returns and realised volatility. The GPR exerts higher effects on returns in the short run, while both an increase and a decrease in GPR have significant long-run effects. Sohag et al. (Citation2022) used the recently developed various measures of geopolitical risks (acts, threats, narrow and broad indices) to understand that transmission and found that all measures of GPR (except geopolitical acts) transmit positive spillovers to the green investments (both equity and bonds) from bearish to bullish market states. Applying the Granger-causality quantile analysis, C. Lee et al. (Citation2021) explored the causal relationship between GPR and a green bond index in the United States (US) from December 2013 to January 2019 and found unidirectional causality from the GPR to the green bond index for lower quantiles. According to the authors, this result suggests that geopolitical uncertainty has the ability to predict green bond price changes. Yang et al. (Citation2021) evaluated the risk spillovers from GPR to five renewable energy stock markets, and found significant risk spillovers from GPR to renewable energy stock markets, fluctuating the risk spillovers around zero (do not exhibit a clear positive or negative pattern). Sweidan (Citation2021) investigated, using a cointegration analysis, the GPR influence on the US renewable energy deployment and found that GPR has a significant and positive effect on the US renewable energy deployment, being a driver and not a barrier to renewable energy diffusion. Thus, GPR is expected to enhance cleaner production and a sustainable environment. Although these studies, none of them seem to provide an answer to our research questions. Furthermore, the studies presented above, except the second one, resort to the aggregate risk variable, without considering the possibility of this being subdivided into its main dimensions. Our study fills these gaps by resorting to two global geopolitical dimensions (threats and acts) and five global environmental indices (which include developed and emerging market large, mid and small cap companies), for several reasons: (i) geopolitical actions can contribute to intensifying geopolitical threats; (ii) analysis of the impacts of geopolitical threats and actions can provide a concrete indication about environmental segments’ resilience to exogenous shocks; (iii) analysis of the impacts of global geopolitical dimensions on global environmental segments can assist portfolio managers in protecting their assets, in the face of market falls induced by geopolitical risk, particularly in more sensitive moments, as is the case of the continuing conflict in Ukraine.
3. Data and methodology
3.1. Data
To investigate the impact of geopolitical risk on environmental investment returns, data were collected for five environmental segments from the DataStream database and two global geopolitical risk indicators from 20 January 2009 to 11 October 2022. This period was selected as it encompasses critical events and transformations that significantly influenced global financial markets, investment strategies, and regulatory frameworks. The beginning of our study (January 2009) aligns with the aftermath of the GFC, which was considered one of the most severe since the Great Depression, and had far-reaching implications for financial institutions, markets, and economies worldwide. The period immediately following the GFC was marked by unprecedented government interventions, policy adjustments, and a recalibration of financial strategies to stabilise and revive economies.
As we extend our analysis through 11 October 2022, we capture not only the recovery phase from the GFC but also subsequent developments that have continued to shape the financial landscape. This timeframe includes the evolution of regulatory frameworks globally, with many countries implementing significant reforms to enhance financial stability and investor protection. The post-GFC era witnessed a heightened focus on risk management, transparency, and sustainable practices, influencing the trajectory of investment strategies.
Moreover, the selected period encapsulates a notable rise in awareness and emphasis on Environmental, Social, and Governance (ESG) factors. Investors increasingly recognise the importance of incorporating sustainability considerations into their decision-making processes. This evolution in investor sentiment has led to the proliferation of sustainable and socially responsible investment practices.
By considering data until October 2022 this allows us to consider also recent data that allows for a comprehensive understanding of how financial markets and investment landscapes have adapted not only to the aftermath of the GFC but also to more recent global challenges and events. This extended timeframe enables us to analyse the resilience and adaptability of investment portfolios in the face of unforeseen circumstances, reinforcing the relevance and significance of the chosen period for our research.
The GPR data was retrieved from the Geopolitical Risk website (https://www.matteoiacoviello.com/gpr.htm). explains the data, variables’ definitions, and data sources.
Table 1. Variable description and data sources.
The sample period was determined by the availability of data on the subject. The resulting sample contains 3581 daily observations, involving only variables of global scope (important as the GPR is a global measure (Sohag et al., Citation2022), namely five global stock market indices(composed by companies from developed and emerging markets), representing companies that respect environmental criteria (alternative energy, energy efficiency, green building, pollution prevention and sustainable water), and two global geopolitical risk indices (threats and acts). The data for the GPR indices were produced by Caldara and Iacoviello (Citation2018), who recently developed a geopolitical risk index, obtained from newspaper news, being constructed using an automated text search of articles, in 11 newspapers of reference. It calculates the number of articles in these newspapers that address geopolitical tension and related risks (e.g. wars, terrorism, and tension between states). Several authors discuss concerning what should be the data frequency applied (e.g. Narayan and Sharma (Citation2015), Narayan et al. (Citation2015), Bannigidadmath and Narayan (Citation2016), Umar et al. (Citation2020), among others). Daily data frequency is better, compared to monthly, quarterly or weekly data, when the research aim is to retrieve as much information as possible from that data (Bannigidadmath & Narayan, Citation2016; Umar et al., Citation2020). Given the above referred, and as we aim to perform a continuous assessment of the connectivity between sustainable investment segments and two global geopolitical risk indices (threats and acts), it is important to have as much information as possible, justifying daily data frequency.
We believe that the GPR dimensions will allow for a more accurate description and analysis of the impact of geopolitical risks on the returns of environmental equity segments, as well as help to analyse the effects of geopolitical instability generated by the pandemic crisis and especially the war in Ukraine.
3.2. Methodology
To fulfil the aims of the research, we use a multivariate model of dynamic correlation (cDCC-GARCH), which can accompany the correlations generated over time, as well as the proposal of Diebold and Yilmaz (Citation2012), in order to analyse the spillover effects generated between the variables studied.
Several empirical methods have been used to estimate correlations between stock markets. This work uses the multivariate GARCH to model volatility and to construct dynamic conditional correlations based on a rolling-window analysis. Due to their comparative advantages (e.g. allowing the conditional variance-covariance matrix of the returns to vary over time (Aydoğan et al., Citation2017)), we chose to use restricted correlation models, such as DCC, ADCC (asymmetric dynamic conditional correlation) and cDCC. They are designed to solve the problems encountered when using the BEKK and VECH models, due to the presence of a large number of free parameters. The DCC, ADCC and cDCC models are easier to estimate, comparatively more robust, directly account for heteroskedasticity (as they estimate the correlation coefficients of the standardised residuals) (W. Zhang et al., Citation2022), and allow for time-varying correlations that are measurable with respect to the past values of the variables (Akkoc & Civcir, Citation2019). The main advantages of these models are the positive definiteness of the conditional covariance matrices and the model’s ability to estimate time-varying volatilities, covariances, and correlations among the assets in a parsimonious way (Yousaf & Ali, Citation2020). According to Ciner et al. (Citation2013) they are appropriate to examine the time-varying correlations between financial products and economic variables and have been applied in previous studies covering crisis and noncrisis periods (Sadorsky, Citation2012; Yousaf & Ali, Citation2020).
In order to correct both the lack of consistency and the potential bias in the estimated parameters of the DCC-GARCH model of Engle (Citation2002), Aielli (Citation2013) proposed the cDCC-GARCH modelling.
Engle (Citation2002) proposed a multivariate model of dynamic conditional correlation (DCC-GARCH), which differs from other models, for example, from the constant conditional correlation proposed by Bollerslev (Citation1990), by allowing the conditional correlation matrix to be variable over time. This model is estimated in two stages. In the first stage, univariate GARCH models are applied to each series. In the second, the standardised residuals obtained in the first stage are used to obtain the conditional correlation.
In the GARCH-DCC model, the variance-covariance matrix is written as:
is the diagonal matrix of the time-varying standard deviations from the univariate GARCH estimations and
is the matrix of correlations variable over time.
can be defined as:
is the unconditional variance between the series and
is the unconditional covariance between the series, and
is the empirical matrix of standardised residuals.
and
are implying the persistence of shocks. The sum of them measures volatility persistence. It is expected that
,
and
to define the conditional correlation matrix as positive.
However, there are some issues related to the consistency of the DCC-GARCH model. Aielli (Citation2013) reports that an estimation of the empirical correlation matrix is inconsistent because:
Aielli (Citation2013) suggests the consistent estimator of dynamic correlations named corrected DCC (cDCC) to overcome this issue. The cDCC model improved consistency by reformulating the correlations as:
EquationEquation (5)(5)
(5) shows in the cDCC model conditional correlations formulated with the combination of the relevant innovations and past correlations. When the persistence of the correlation and effects of the innovations are sufficiently high, the cDCC estimator is still unbiased, but the DCC estimator is not.
To analyse the links generated between the variables, we turn to the methodological proposal of Diebold and Yilmaz (Citation2012), setting out from the decomposition of variance associated with a generalised auto-regressive vector, which produces variance decompositions that will not be affected by the ordering of the variables included.
The decompositions of variance of the error in forecasting H steps forward are given by:
where ∑ is the matrix of variance for the vector of ,
is the standard deviation of the error term for the equation j-th, and
is the selection vector, with one as the i-th element and zeros otherwise. To use the information available in the variance of the decomposition matrix in calculating the spillover index, each entry of the variance decomposition matrix is normalised by the sum of the line as:
by construction,
For total spillovers, the contributions of the volatility of the decomposition of the variable are used, allowing the construction of the index of reversion of total volatility:
Estimating the spillovers of directional volatility, received by market from all other markets
, gives:
Similarly, estimating the spillovers of directional volatility transmitted by market to all other markets
, gives:
4. Results and discussion
4.1. Preliminary results
As mentioned in the previous section, this study uses two global daily datasets, concerning the period from 20 January 2009 to 11 October 2022. The first set includes five environmental segments (of global covering), while the second involves the global GPR indices, as proposed by Caldara and Iacoviello (Citation2018), which are widely used in the existing literature (e.g. Balcilar et al., Citation2018; Cunado et al., Citation2020), in order to reflect the tension between countries, military conflicts, terrorist attacks, and war threats.
To perform the empirical analyses, we use the daily logarithmic returns of the closing prices of the environmental segments, while for the GPR indices we consider the level series, since these are stationary, as shown in . A summary of the main statistics of the returns of the environmental segments and the geopolitical risk indices can be seen in .
Table 2. Descriptive statistics of return series.
All series show non-zero asymmetry (negative to the environmental indices and positive for the GPR indices, which can imply a greater likelihood of bigger negative price changes for the formers, and positive for the second) and excess kurtosis (i.e. leptokurtic distributions), which is the first sign of deviation from the normality hypothesis, a situation that is confirmed based on the Jarque-Bera statistics, which imply a non-normal distribution of the series. The augmented Dickey and Fuller (Citation1979) and Phillips and Perron (Citation1988) test statistics indicate that the logarithmic returns series (environmental segments) and the level series of the GPR indices are stationary. The ARCH statistics reveal the presence of heteroscedasticity in both sets of series (meaning that could exist non-linearities in the analysed series or it could also be related to a possible leverage effect), which suggests the suitability of GARCH models in their behavioural analysis.
4.2. Empirical results
Our empirical approach consists of two stages. In the first stage, several dynamic conditional correlation models (as they help to examine patterns and relationships in data and thus allow to understand of the relationship between two variables), including the recent cDCC-GARCH model by Aielli (Citation2013), are estimated to generate the conditional correlations between selected variables and capture dynamic comovements as various stylised facts related to environmental segment returns, such as volatility clusters, asymmetric volatility, and time-varying. Thus, this model has the ability to capture complex patterns in financial markets. Conditional correlation estimates can be biased, as they depend in part on the state of market volatility. Forbes and Rigobon (Citation2002) have shown that markets tend to be more correlated during episodes of stress, without any real changes in the interconnections between them. For this reason, we developed a second empirical phase, to study the connectivity and impact of GPR indices on the dynamics of returns across environmental segments, using the spillover approach introduced by Diebold and Yilmaz (Citation2012, Citation2015). This technique is based on the Forecast Error Variance Decomposition (FEVD) function from a Generalised Vector Autoregressive Model (VAR) and is therefore independent of the conditional correlation estimates generated by the cDCC-GARCH model (Aielli, Citation2013). This approach begins by investigating the results of the static spillover analysis, over the full sample period. Next, dynamic spillover is studied, based on a rolling window (of 250 days).
4.2.1. Analysis of the dynamic conditional correlations
To perform the study of the connectivity between the variables studied, we started by estimating several dynamic correlation models, namely multivariate models of conditional heteroscedasticity (VECH, BEKK, DCC, ADCC, DCC-DECO and cDCC), according to several specifications (asymmetric effect, error distribution and lag size), after ensuring statistical stationarity, considering the results of the ADF tests. To satisfy the specificities of multivariate models with the indications provided by Schwarz and Akaike’s information criteria, the cDCC-GARCH model was selected. The main estimates of this model are shown in . Panel A shows the estimates of the model parameters, while panel B shows the results of the diagnostic tests.
Table 3. Estimates of the cDCC-GARCH multivariate model.
All the parameters of the conditional variance, presented in panel A, are statistically significant at a 5% significance level and suggest that the volatility of the various variables is highly persistent, considering the values of the GARCH effect, provided by the β parameter. Additionally, the conditional correlation matrix is positive, considering the value of the sum of the general parameters of the model, is less than unity. Thus, it is possible to conclude that the shocks transmitted to the variables studied are strong and persistent, as if they had memory. Furthermore, β is much larger than α, meaning that the past volatility is more important than the past shocks for forecasting future market volatility and implying highly persistent volatility over time. Significant values at a 1% significance level are provided for the short-term (θ1) and long-term (θ2) persistence of shocks on the dynamic conditional correlation. This suggests the presence of time-varying correlations between the variables (aligned with Sarker et al. (Citation2023)). With θ2 close to unity, the long-term persistence of the shock plays an important role in predicting the dynamic correlation coefficients, which could imply a significant loss in market efficiency (aligned with Adekoya et al. (Citation2023)). Past shocks and dynamic correlations influence current conditional correlations (as the sum of θ1 and θ2 is less than one). , Panel B, presents the results of the Ljung-Box and ARCH-LM tests, which allow us to evaluate the statistical adequacy of the model selected (cDCC-GARCH). As the statistics of these tests revealed not to be statistically significant, we conclude that the model does not contain specification errors.
To analyse the connectivity between the variables studied over time, was created from the estimates of the multivariate model.
Figure 1. Dynamic conditional correlations.
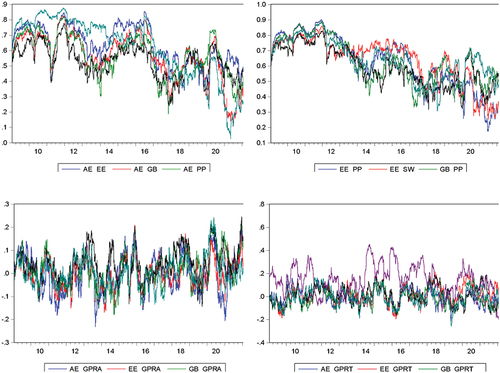
Analysis of the dynamic conditional correlations between environmental segments shows a high variability over the sample period, assuming always positive values (and different from zero) which could indicate that each of these indices does not serve as a hedge against the risk of the others. Regarding pairs of environmental segments, no major differences in their behaviour patterns were identified, with average correlations reaching a minimum value of 0.53 (AE/SW) and a maximum value of 0.64 (PP/SW). In some moments and pairs, the intensity levels of the correlations exceeded 0.85, especially between 2009 and 2011, as a result of the turbulence generated by the global financial and sovereign debt crisis. It is also important to underline that the onset of the pandemic crisis translated into a very significant increase in the intensity levels of correlations, especially from February 2020 onwards, as a result of the strong impact generated by this crisis on world economies and financial markets, as concluded by Singh et al. (Citation2021), Salisu and Shaik (Citation2022), Umar et al. (Citation2021) and Mirza et al. (Citation2023). A similar situation occurred with the outbreak of war in Ukraine on 24 February 2022, as was found for example by Umar, Polat, et al. (Citation2022). The results obtained indicate that the dynamics established between the environmental segments translate into similar responses to market events, especially at times of high volatility, in line with the findings of Forbes and Rigobon (Citation2002) and Diebold and Yilmaz (Citation2015). On the other hand, taking into account the findings of these studies, which analysed the links between some of the major traditional markets and stock indices, it is possible to conclude that, similarly to what occurs between this type of indices, environmental indices also maintain relatively close behaviour patterns among themselves. Financial globalisation allowed favourable conditions for the integration and contagion between markets and may explain the proximity between these stock markets, hindering the investment diversification process and reducing its benefits.
Similarly, to what was observed with the pairs of environmental segments, the pairs of each of the environmental segments and the geopolitical risk indices revealed variable correlations between them over time, with negative and positive values (in line with Yang et al. (Citation2021), Sohag et al. (Citation2022) and Umar, Bossman, et al. (Citation2022)). These finding points not only to the GPR’s complex mechanism of influence, meaning that the impact of each geopolitical conflict requires detailed analysis. However, it was not found high levels of intensity, especially for negative correlations. These results do not confirm the majority of those obtained in other research, according to which the correlation generated between this type of variables has a negative nature (see for example Balcilar et al., Citation2018; Caldara & Iacoviello, Citation2018; Hoque et al., Citation2019; Smales, Citation2021). The negative correlations may be related to phases of lower volatility, while the positive ones seem to be related to high volatility phases and prices falling of environmental segments, as the ones of the onset of the pandemic crisis and the war in Ukraine, in which were recorded the highest levels of conditional correlation throughout all the analysed period. The results are aligned with Sarker et al. (Citation2023), which analysed the asymmetric effects of GPR in clean energy prices. The results are consistent with those obtained in other scientific, which involved traditional stock market indices, namely Aslam and Kang (Citation2015), Bouoiyour et al. (Citation2019); Hoque and Zaidi (Citation2020), Zhou et al. (Citation2020), Cai and Wu (Citation2021) and Smales (Citation2021). In this respect, we do not find significant differences between environmental investment and traditional investment.
In order to verify the robustness of the results produced by the cDCC-GARCH model, two procedures were considered. The first involved estimating the model from weekly data, while the second involved estimating the statistical model for several specifications. In both cases, the dynamic correlations did not change significantly, which makes us believe that the results and the conclusions generated from them are robust (the results are available upon request).
4.2.2. Analysis of static connectivity
presents the results of the static analysis of the spillover generated among the variables, based on the methodological proposal of Diebold and Yilmaz (Citation2012). This technique is based on the Forecast Error Variance Decomposition (FEVD) function from a generalised Vector Autoregressive Model (VAR) of order three and ten days, respectively, where the item ijth presents the contribution to the FEVD of variable ith, caused by shocks in variable j. Intra-variable spillovers (own variation) are represented by the main diagonal of the FEVD matrix (i = j), while inter-variable spillovers (cross-variance) are shown in the off-diagonal elements (i ≠ j). The net contribution, shown in the last row, was calculated based on the difference between the contribution to others and the contribution from others.
Table 4. Spillover matrix.
The overall spillover index obtained was 46% (see ). This value corresponds to the percentage of change in the variables that is explained by the system formed by them, i.e. it translates the average percentage of spillovers from market cross-linkages. This result is consistent with the one obtained by Elsayed and Yarovaya (Citation2019). It is possible to conclude that the main contributor to the FEVD forecast is given by intra-variable spillovers, presented in the main diagonal of . Regarding the environmental variables, the EE segment shows the highest self-explanatory power, with approximately 42% of its own variation, followed by AE (38.82%). In the remaining segments, the eigen variance values are between 37% and 38%, a first sign that the various environmental segments have similar behavioural patterns. These results are confirmed by the gross directional spillover measures, which report relatively similar levels, with the maximum value being reported by the PP segment (65.25%) and the minimum value being presented by the EE segment (52.61%).
PP and GB are the segments that most contribute, in net terms, to the system, showing the highest net spillovers, 2.39% and 1.95% respectively. On the other hand, the EE segment reports negative net spillovers, being a net receiver of the system.
Since this focuses on the impact of geopolitical events on environmental segments, it is important to underline that both GPR indices show a statistically weak effect on the return of these stock market segments, but confirms the connectivity between the GPR’s and the environmental segments (aligned with Sarker et al. (Citation2023), Sohag et al. (Citation2022) and Będowska-Sójka et al. (Citation2022)). GPRA and GPRT account for 0.12% and 0.11%, respectively, of the variation in the environmental segments. This finding is in line with the conclusions of Bouras et al. (Citation2019), indicating that environmental segments may report some differences from what happens in traditional markets, guided by purely financial logic. The GPRA and the GPRT report different net spillovers to the system, the former being a net receiver, while the second is a net transmitter. This different behaviour is aligned with Sohag et al. (Citation2022), who argue that the GPRA transmits negative shocks to the system through the asset price and return channels, while the GPRT transmits positive shocks to the green equity and green bonds. Gupta and Pierdzioch (Citation2022) show that it is interesting and useful to explore a disaggregated view of geopolitical risks for forecasting the realised variances of the movements of the prices of other fossil resources and also those of agricultural commodities. In the same line, the identified different behaviour clearly shows that a disaggregated view of geopolitical risks is necessary and useful to understand its impact on environmental segments, highlighting one of the main contributions of this study.
4.2.3. Analysis of dynamic connectivity
The static spillover index, presented in the previous section, indicates the global average contribution to and from other variables over the entire sample period. However, it does not provide insight into how the transmissions of geopolitical risk evolve over time. Moreover, the static analysis does not reveal the level of impact of volatility caused by political and financial turbulence, so it does not allow us to measure the intensity and direction of spillovers in global environmental segments. In order to analyse the dynamics of the connectivity generated among the various variables during the sample period, a sliding window of 250 days was used. The size of the sliding window was defined, on the one hand, taking into account the need to have a sufficient number of observations to estimate the model, and, on the other hand, considering the period to analyse the dynamic movement. In order to guarantee the robustness of the empirical results, several estimation options were considered. The first option involved the estimation of the VAR model according to several lag levels. However, the levels and dynamics of spillovers were not sensitive to these changes. In the second option, a similar sensitivity analysis was developed, considering several forecast horizons. Also, in this case, the dynamic and global spillovers did not reveal significant changes, which makes us confident about the robustness of the results generated through the applied methodology. The results of this robustness check are not displayed due to space constraints, but they are available upon request.
The dynamic analysis presented in shows that the total spillover index (left) and the net spillover indices (right) are sensitive to situations of political and economic turbulence, which is reflected in the high variability of these indices during the sample period. This variability is consistent with the results of other research works, namely Balcilar et al. (Citation2018), Hoque et al. (Citation2019) and Smales (Citation2021), among others. In what refers to the first index, its variability was marked mainly by four cycles: (i) the global financial and sovereign debt crisis (2009–2012), with total connectivity registering values close to 0.60; (ii) the cycle related to the oil-price crash of July 2014 – December 2015; (iii) the cycle related to the onset of the COVID-19 pandemic crisis (2020), which produced a significant increase in connectivity levels, reaching a maximum value of approximately 0.58, which could be a sign that investors shifted more their attention towards sustainable investments after the COVID-19 pandemic outbreak, and is aligned with Mirza et al. (Citation2023); and (iv) the fourth cycle is associated with the beginning of the war in Ukraine in February 2022, with the global spillover index registering in this month an increase of almost 50% compared to the levels recorded at the beginning of that year.
Figure 2. Dynamic connectivity.
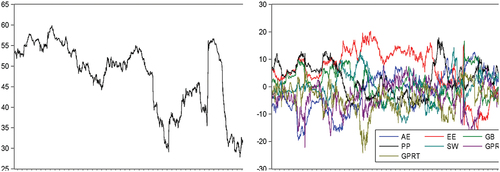
The high sensitivity of environmental segments to situations of political and economic turbulence, showed by the intensification of the information transmission process between the variables, makes the behaviour of environmental investment show some similarities to what occurs in traditional stock market indices, whose performance and behaviour is also affected by the GPR as was found in other research, such as Apergis et al. (Citation2018), Caldara and Iacoviello (Citation2018), Balcilar et al. (Citation2018); Bouri et al. (Citation2019), Hoque et al. (Citation2019) and Smales (Citation2021).
In order to obtain a more detailed analysis of the dynamic behaviour of the directional connectivity generated between the variables studied, the net spillover indices were estimated and shown in (graph on the right). The graph shows the dynamic evolution of the process of net transmission and reception of shocks generated by the system and reveals that none of the environmental segments stands out as a net contributor in each of the four cycles identified above.
Focusing on the GPR indices, two different situations stand out. The first is that, in the majority of daily sessions, these indices were not net transmitters to the environmental segments, so geopolitical indices do not seem to play a central role as net spillover transmitters (contradicting Shahzad et al. (Citation2023) for whom GPR acts as a net transmitter to non-renewable energy and precious metals markets), especially in quiet market phases. The second situation concerns the GPRT index, as it is a net transmitter in phases of greater economic and political turbulence. This was observed in the period related to the first phase of the COVID-19 pandemic crisis and at the onset of the war in Ukraine. These results are consistent with those obtained in other research, namely Hoque and Zaidi (Citation2020), Zhou et al. (Citation2020), Cai and Wu (Citation2021) and Smales (Citation2021), among others.
Considering the literature, which recognises the proximity and connectivity between financial assets, especially in turmoil periods, the results obtained here are convergent with those presented in the literature. In this context, it is important to emphasise the close movement described by environmental segments during the COVID-19 pandemic crisis and the war in Ukraine, which may be explained by the global dimension of both crises, with consequences in international economies and financial asset prices. Such a situation may have generated a change in investors’ perception of risk, about the profitability of their assets, leading them to take more defensive positions in managing their investment portfolios. In situations of high market turmoil, as occurred in the last two years, the GPRT index seems to be able to play the role of a net transmitter of spillovers to environmental segments (in line with Sohag et al. (Citation2022)), reporting some explanatory power.
5. Conclusions and policy implications
In this research work, we analyse the level of influence of two dimensions of GPR, namely threats and acts, in five global environmental segments, representing companies whose management models have sustainability as a central and strategic element, with the purpose of deepening the study of the driving forces of this type of investment. We consider several market conditions in a lengthy period from 20 January 2009 to 11 October 2022.
Although sustainable investment has generated growing interest in the scientific community, the work related to this topic is mostly directed to comparing its performance against traditional investment. Therefore, the present work contributes to filling a gap in the literature about this topic, exploring the influence of GPR on environmental investment in turmoil phases, such as the COVID-19 pandemic crisis and the war in Ukraine.
To reach the research objectives, the methodological choice fell on the multivariate cDCC-GARCH model and the methodological proposal of Diebold and Yilmaz (Citation2012), in both cases using daily observations.
The high dynamic conditional correlations generated from the cDCC-GARCH model show that the environmental segments describe identical behaviour patterns, regardless of market phases. Whenever markets were marked by high volatility, as was the case during the COVID-19 pandemic crisis and the war in Ukraine, environmental assets reported simultaneous and more intense responses, minimising the investment diversification alternatives, if only the environmental side of the investment is considered (aligned with the findings of Sarker et al. (Citation2023)). In turn, the methodological proposal of Diebold and Yilmaz (Citation2012), allowed for deepening the process of information transmission between the variables studied, based on two approaches: static and dynamic. In the static analysis, it was possible to ascertain that environmental segments are more influenced by systemic shocks than by specific causes. On the other hand, the influence of GPR’s proved to be relatively weak (similarly, Będowska-Sójka et al. (Citation2022) identified green bonds as the most resistant to changes in geopolitical risk across various scales from high- to low-frequency). The dynamic analysis allowed us to deepen the spillover effects of GPR in environmental segments, incorporating in the analysis several market conditions, namely those generated by the emergence of the pandemic crisis and the invasion of Ukraine, which led to intensifying the spillover effects generated among the several segments. The GPRT index was also found to generate some impact in the stock market segments, whenever the respective prices describe a downward trend. Thus, the net receiving or transmitting volatility role of several environmental indices is altered by extreme events. Investment decisions and sector rotation strategies across environmental segments should be conducted with close consideration of the impact of GPRT and considering various market conditions. Our findings led us to conclude that the influence of geopolitical risk changes is heterogeneous (aligned with Sarker et al. (Citation2023)), depending upon which categories of risk are considered, but economic actors and policymakers should take a close look at the GPR and how it drives the connectedness among environmental segment indices
We believe that the empirical results obtained here are important for policymakers, regulators, portfolio managers and investors in making informed decisions (especially in times of worldwide crises, such as the ones originated by the COVID-19 pandemic or by the war between Russia and Ukraine), helping to improve knowledge about the role of geopolitical risks in spillovers between environmental segments and providing implications for environmental investment.
Concerning policymakers and regulators, the results show environmental segments’ degree of exposure to contagion, especially in market phases characterised by high volatility. Special attention should be paid to the GPRA index, as it reveals some capacity to impact these segments, when the respective returns are negative, signalling the importance of creating conditions for the stabilisation and resilience of international financial markets. Considering that the influence of geopolitical risk changes is heterogeneous, depending upon which categories of risk are considered, regulators and policymakers should create different policies based on the properties and characteristics of geopolitical risks (namely, actual adverse acts, and threats). Thus, our findings provide a key message indicating that GPR and its components contain valuable information that should be considered when making investment decisions that involve environmental indices.
Governments may use grants and tax incentives to encourage climate change mitigation. Market stability is an important policy objective for regulators and policymakers (even more during periods of market stress). Thus, our empirical findings (related to environmental investment under bullish and bearish market conditions) help policymakers and researchers to establish efficient guidelines to cope with situations, such as conflicts and formulate investment strategies. Regulators and policymakers could use our findings to guide their actions in order to maintain market stability during periods of stress. The increase in geopolitical risks increases militarisation activities, adversely affecting the environment (Bildirici, Citation2017). These activities require a high amount of energy consumption (Solarin et al., Citation2018) and accelerate environmental deterioration, thus, policymakers also should strive to decrease geopolitical risks and tensions between countries. Ultimately, high environmental performance businesses must make operational decisions to prevent risk, especially when international tensions are at an all-time high. Governments and other relevant authorities, particularly in the environmental sector, should design and develop strategic plans, regulations, and processes to assist businesses in surviving periods of high worldwide geopolitical risks.
As for investors and portfolio managers of environmental assets, regarding diversification, the results show that restricting investment decisions to this type of assets may not prove beneficial, especially in turmoil periods, so it is important to consider other types of assets or use hedging instruments. These results also matter to traders, investors, and portfolio managers regarding asset allocation and managing the risk exposure to avoid future unexpected losses under high levels of GPR. Due to the availability of several sustainability indices for sustainable investments covering different assets and regions, in order to help investors to find enough opportunities for diversification within the market for sustainable assets, they should diversify and broaden their investment portfolio. At the same time, they do this, more and more finance can be diverted towards the real goal of climate change mitigation. Investors on the environmental segment, for enhanced accuracy, should conduct prediction analysis based on geopolitical shocks.
Economic actors and policymakers should take a close look at the GPR index (on its two different dimensions) and how it drives the connectedness among environmental segments to extend of spiking the level of systemic risk to a very high level, which might spill over to other financial markets, assets, and economic sectors and jeopardise financial and economic stability. These issues could be the subject of future studies. In the future, we intend to study the impact of geopolitical risk on sustainable investment behaviour further, incorporating in the analysis more detailed information regarding domestic political risk in major international markets, and applying risk management models and optimisation techniques.
Author agreement
All authors have seen and approved the final version of the manuscript being submitted. This article is the author’s original work, hasn’t received prior publication and isn’t under consideration for publication elsewhere.
Acknowledgments
Vitor Gabriel, Andreia Dionísio, Dora Almeida and Paulo Ferreira are pleased to acknowledge financial support from Fundação para a Ciência e a Tecnologia (grant UIDB/04007/2020). Paulo Ferreira and Dora Almeida also acknowledge the financial support of Fundação para a Ciência e a Tecnologia (grant UIDB/05064/2020).
Disclosure statement
No potential conflict of interest was reported by the author(s).
Data availability statement
The data that support the findings of this study are available from the corresponding author, [P.F.], upon reasonable request.
Additional information
Funding
References
- Adekoya, O. B., Asl, M. G., Oliyide, J. A., & Izadi, P. (2023). Multifractality and cross-correlation between the crude oil and the European and non-European stock markets during the Russia-Ukraine war. Resources Policy, 80(November 2022), 103134. https://doi.org/10.1016/j.resourpol.2022.103134
- Adekoya, O. B., Oliyide, J. A., Yaya, O. O. S., & Al-Faryan, M. A. S. (2022). Does oil connect differently with prominent assets during war? Analysis of intra-day data during the Russia-Ukraine saga. Resources Policy, 77, 102728. https://doi.org/10.1016/j.resourpol.2022.102728
- Aielli, G. (2013). Dynamic conditional correlation: On properties and estimation. Journal of Business and Economic Statistics, 31(3), 282–299. https://doi.org/10.1080/07350015.2013.771027
- Akkoc, U., & Civcir, I. (2019). Dynamic linkages between strategic commodities and stock market in Turkey: Evidence from SVAR-DCC-GARCH model. Resources Policy, 62(March), 231–239. https://doi.org/10.1016/j.resourpol.2019.03.017
- Alqahtani, A., Bouri, E., & Vo, X. V. (2020). Predictability of GCC stock returns: The role of geopolitical risk and crude oil returns. Economic Analysis and Policy, 68, 239–249. https://doi.org/10.1016/j.eap.2020.09.017
- Antonakakis, N., Chatziantoniou, I., & Filis, G. (2013). Dynamic co-movements of stock market returns, implied volatility and policy uncertainty. Economics Letters, 120(1), 87–92. https://doi.org/10.1016/j.econlet.2013.04.004
- Apergis, N., Bonato, M., Gupta, R., & Kyei, C. (2018). Does geopolitical risks predict stock returns and volatility of leading defense companies? Evidence from a nonparametric approach. Defense and Peace Economics, 29(6), 684–696. https://doi.org/10.1080/10242694.2017.1292097
- Arin, K., Ciferri, D., & Spagnolo, N. (2008). The price of terror: The effects of terrorism on stock market returns and volatility. Economics Letters, 101(3), 164–167. https://doi.org/10.1016/j.econlet.2008.07.007
- Aslam, F., & Kang, H. (2015). How different terrorist attacks affect stock markets. Defense and Peace Economics, 26(6), 634–648. https://doi.org/10.1080/10242694.2013.832555
- Aydoğan, B., Tunç, G., & Yelkenci, T. (2017). The impact of oil price volatility on net-oil exporter and importer countries’ stock markets. Eurasian Economic Review, 7(2), 231–253. https://doi.org/10.1007/s40822-017-0065-1
- Balcilar, M., Bonato, M., Demirer, R., & Gupta, R. (2018). Geopolitical risks and stock market dynamics of the BRICS. Economic Systems, 42(2), 295–306. https://doi.org/10.1016/j.ecosys.2017.05.008
- Bannigidadmath, D., & Narayan, P. (2016). Stock return predictability and determinants of predictability and profits. Emerging Markets Review, 26, 153–173. https://doi.org/10.1016/j.ememar.2015.12.003
- Będowska-Sójka, B., Demir, E., & Zaremba, A. (2022). Hedging geopolitical risks with different asset classes: A focus on the Russian invasion of Ukraine. Finance Research Letters, 50(April), 103192. https://doi.org/10.1016/j.frl.2022.103192
- Bildirici, M. (2017). CO2 emissions and militarization in G7 countries: Panel cointegration and trivariate causality approaches. Environment and Development Economics, 22(6), 771–791. https://doi.org/10.1017/S1355770X1700016X
- Bilgin, M. H., Gozgor, G., & Karabulut, G. (2020). How do geopolitical risks affect government investment? An empirical investigation. Defence and Peace Economics, 31(5), 550–564. https://doi.org/10.1080/10242694.2018.1513620
- Bollerslev, T. (1990). Modeling the coherence in the short-run nominal exchange rates: A multivariate generalized ARCH Model. Review of Economics and Statistics, 72(3), 498–505. https://doi.org/10.2307/2109358
- Borowski, P. F. (2022). Mitigating climate change and the development of green energy versus a return to fossil fuels due to the energy crisis in 2022. Energies, 15(24), 9289. https://doi.org/10.3390/en15249289
- Boţoc, C., & Anton, S. G. (2020). New empirical evidence on CEE’s stock markets integration. World Economy, 43(10), 2785–2802. https://doi.org/10.1111/twec.12961
- Boungou, W., & Yatié, A. (2022). The impact of the Ukraine–Russia war on world stock market returns. Economics Letters, 215, 110516. https://doi.org/10.1016/j.econlet.2022.110516
- Bouoiyour, J., Selmi, R., Hammoudeh, S., & Wohar, M. E. (2019). What are the categories of geopolitical risks that could drive oil prices higher? Acts or threats? Energy Economics, 84, 104523. https://doi.org/10.1016/j.eneco.2019.104523
- Bouras, C., Christou, C., Gupta, R., & Suleman, T. (2019). Geopolitical risks, returns, and volatility in emerging stock markets: Evidence from a panel GARCH model. Emerg. Mark. Finance Trade, 55(8), 1841–1856.
- Bouri, E., Demirer, R., Gupta, R., & Marfatia, H. (2019). Geopolitical risks and movements in Islamic bond and equity markets: A note. Defense and Peace Economics, 30(3), 367–379. https://doi.org/10.1080/10242694.2018.1424613
- Bouri, E., Hammoud, R., & Kassm, C. A. (2023). The effect of oil implied volatility and geopolitical risk on GCC stock sectors under various market conditions. Energy Economics, 120(November 2022), 106617. https://doi.org/10.1016/j.eneco.2023.106617
- Broadstock, D., Chan, K., Cheng, L., & Wang, X. (2021). The role of ESG performance during times of financial crisis: Evidence from COVID-19 in China. Finance Research Letters, 38, 101716. https://doi.org/10.1016/j.frl.2020.101716
- Cai, Y., & Wu, Y. (2021). Time-varying interactions between geopolitical risks and renewable energy consumption. International Review of Economics and Finance, 74, 116–137. https://doi.org/10.1016/j.iref.2021.02.006
- Caldara, D., & Iacoviello, M. (2018). Measuring Geopolitical Risk, vol. 1222, FRB International Finance,
- Cheng, C., & Chiu, C. (2018). How important are global geopolitical risks to emerging countries? International Economics, 156, 305–325. https://doi.org/10.1016/j.inteco.2018.05.002
- Chortane, S. G., & Pandey, D. K. (2022). Does the Russia-Ukraine war lead to currency asymmetries? A US dollar tale. The Journal of Economic Asymmetries, 26, e00265. https://doi.org/10.1016/j.jeca.2022.e00265
- Ciner, C., Gurdgiev, C., & Lucey, B. (2013). Hedges and safe havens: An examination of stocks, bonds, gold, oil and exchange rates. International Review of Financial Analysis, 29, 202–211. https://doi.org/10.1016/j.irfa.2012.12.001
- Cortez, M., Silva, F., & Areal, N. (2009) The performance of European socially responsible funds. Retrieved September 22, 2022, http://www.ifkcfs.de/fileadmin/downloads/events/conferences/2008Asset_Cortez_Silva_Areal.pdf.
- Cunado, J., Gupta, R., Lau, C., & Sheng, X. (2020). Time-varying impact of geopolitical risks on oil prices. Defense and Peace Economics, 31(6), 692–706. https://doi.org/10.1080/10242694.2018.1563854
- Das, D., Kannadhasan, M., & Bhattacharyya, M. (2019). Do the emerging stock markets react to international economic policy uncertainty, geopolitical risk and financial stress alike? The North American Journal of Economics and Finance, 48, 1–19. https://doi.org/10.1016/j.najef.2019.01.008
- Dickey, D., & Fuller, W. (1979). Distribution of the estimators for time series regressions with a unit root. Journal of the American Statistical Association, 74(366a), 427–431. https://doi.org/10.1080/01621459.1979.10482531
- Diebold, F., & Yilmaz, K. (2012). Better to give than to receive: Predictive directional measurement of volatility spillovers. International Journal of Forecasting, 28(1), 57–66. https://doi.org/10.1016/j.ijforecast.2011.02.006
- Diebold, F., & Yilmaz, K. (2015). Trans-atlantic equity volatility connectedness: U.S. and European Financial Institutions, 2004–2014. Journal of Financial Econometrics, 14, 81–127. https://doi.org/10.2139/ssrn.3680198
- Dogan, E., Majeed, M., & Luni, T. (2021). Analyzing the impacts of geopolitical risk and economic uncertainty on natural resources rents. Resources Policy, 72, 102056. https://doi.org/10.1016/j.resourpol.2021.102056
- Dua, P., & Tuteja, D. (2016). Linkages between Indian and US financial markets: Impact of global financial crisis and Eurozone debt crisis. Macroeconomics and Finance in Emerging Market Economies, 9(3), 217–240. https://doi.org/10.1080/17520843.2016.1166144
- Dutta, A., Jana, R. K., & Das, D. (2020). Do green investments react to oil price shocks? Implications for sustainable development. Journal of Cleaner Production, 266, 121956. https://doi.org/10.1016/j.jclepro.2020.121956
- Elsayed, A., & Helmi, M. (2021). Volatility transmission and spillover dynamics across financial markets: The role of geopolitical risk. Annals of Operations Research, 305(1), 1–22. https://doi.org/10.1007/s10479-021-04081-5
- Elsayed, A., & Yarovaya, L. (2019). Financial stress dynamics in the MENA region: Evidence from the Arab spring. Journal of International Financial Markets, Institutions and Money, 62, 20–34. https://doi.org/10.1016/j.intfin.2019.05.004
- Engle, R. (1982). Autoregressive conditional heteroscedasticity with estimates of the variance of United Kingdom inflation. Econometrica, 50(4), 987–1007.
- Engle, R. (2002). Dynamic conditional correlation: A simple class of multivariate GARCH models. Journal of Business and Economic Statistics, 20(3), 339–350. https://doi.org/10.1198/073500102288618487
- European Sustainable Investment Forum – Eurosif. (2008). High net worth individuals (HNWI) and sustainable investment 2008. Retrieved August 15, 2022, http://www.eurosif.org/research/hnwi-a-sustainableinvestment/2008.
- Fernandez, V. (2008). The war on terror and its impact on the long-term volatility of financial markets. International Review of Financial Analysis, 17(1), 1–26. https://doi.org/10.1016/j.irfa.2006.11.003
- Forbes, K., & Rigobon, R. (2002). No contagion, only interdependence: Measuring stock market comovements. The Journal of Finance, 57(5), 2223–2261. https://doi.org/10.1111/0022-1082.00494
- Freeman, R. (2008). Ending the so-called “Friedman-Freeman” debate, in: Agle, B.R., Donaldson, T., Freeman, R.E., Jensen, M.C., Mitchell, R. and Wood, D.J. (2008) dialogue: Towards a superior stakeholder theory. Business Ethics Quarterly, 18(2), 153–190. https://doi.org/10.5840/beq200818214
- Gaio, L. E., Stefanelli, N. O., Pimenta, T., Bonacim, C. A. G., & Gatsios, R. C. (2022). The impact of the Russia-Ukraine conflict on market efficiency: Evidence for the developed stock market. Finance Research Letters, 50(September), 103302. https://doi.org/10.1016/j.frl.2022.103302
- Glick, R., & Taylor, A. (2010). Collateral damage: Trade disruption and the economic impact of war. Review of Economics and Statistics, 92(1), 102–112. https://doi.org/10.1162/rest.2009.12023
- GSIA. (2019). 2018 Global Sustainable Investment Review. Global Sustainable Investment Alliance. Retrieved September 23, 2022, http://www.gsi-alliance.org/wp-content/uploads/2019/03/GSIR_Review2018.3.28.pdf.
- Gu, Y., Ho, K., Yan, C., & Gozgor, G. (2021). Public environmental concern, CEO turnover, and green investment: Evidence from a quasi-natural experiment in China. Energy Economics, 100, 105379. https://doi.org/10.1016/j.eneco.2021.105379
- Guidolin, M., & La Ferrara, E. (2010). The economic effects of violent conflict: Evidence from asset market reactions. Journal of Peace Research, 47(6), 671–684. https://doi.org/10.1177/0022343310381853
- Gupta, R., Gozgor, G., Kaya, H., & Demir, E. (2019). Effects of geopolitical risks on trade flows: Evidence from the gravity model. Eurasian Economic Review, 9(4), 515–530. https://doi.org/10.1007/s40822-018-0118-0
- Gupta, R., & Pierdzioch, C. (2022). Forecasting the realized variance of oil-price returns: A disaggregated analysis of the role of uncertainty and geopolitical risk. Environmental Science and Pollution Research, 29(34), 52070–52082. https://doi.org/10.1007/s11356-022-19152-8
- Hoque, M., Wah, L., & Zaidi, M. (2019). Oil price shocks, global economic policy uncertainty, geopolitical risk, and stock price in Malaysia: Factor augmented VAR approach. Economic Research-Ekonomska Istraživanja, 32(1), 3701–3733. https://doi.org/10.1080/1331677X.2019.1675078
- Hoque, M., & Zaidi, M. (2020). Global and country-specific geopolitical risk uncertainty and stock return of fragile emerging economies. Borsa Istanbul Review, 20(3), 197–213. https://doi.org/10.1016/j.bir.2020.05.001
- Husnain, M., Syed, Q., Bashir, A., & Khan, M. (2022). Do geopolitical risk and energy consumption contribute to environmental degradation? Evidence from E7 countries. Environmental Science and Pollution Research, 29, 41640–41652.
- Jalkh, N., & Bouri, E. (2022). Global geopolitical risk and the long- and short-run impacts on the returns and volatilities of US Treasuries. Defence and Peace Economics, 00(0), 1–28. https://doi.org/10.1080/10242694.2022.2150808
- Khalfaoui, R., Gozgor, G., & Goodell, J. W. (2022). Impact of Russia-Ukraine war attention on cryptocurrency: Evidence from quantile dependence analysis. Finance Research Letters, 52, 103365. https://doi.org/10.1016/j.frl.2022.103365
- Kollias, C., Kyrtsou, C., & Papadamou, S. (2013). The effects of terrorism and war on the oil price-stock index relationship. Energy Economics, 40(6), 743–752. https://doi.org/10.1016/j.eneco.2013.09.006
- KPMG. (2011). Sustainable insight: Articulating the value of sustainability to mainstream investors. Retrieved July 15, 2022, http://www.csreurope.org/data/files/For_news/Sustai nable_Insight_Jan_2011_2.pdf.
- Lee, C., & Chen, M. (2020). Do natural disasters and geopolitical risks matter for cross border country exchange-traded fund returns? North American Journal of Economics and Finance, 51, 101054. https://doi.org/10.1016/j.najef.2019.101054
- Lee, C., Lee, C., & Li, Y. (2021). Oil price shocks, geopolitical risks, and green bond market dynamics. The North American Journal of Economics & Finance, 55(October 2020), 101309. https://doi.org/10.1016/j.najef.2020.101309
- Lo, G. D., Marcelin, I., Bassène, T., & Sène, B. (2022). The Russo-Ukrainian war and financial markets: The role of dependence on Russian commodities. Finance Research Letters, 50(April), 103194. https://doi.org/10.1016/j.frl.2022.103194
- Lombardo, R., & D’Orio, G. (2012). Corporate and state social responsibility: a long-term perspective. Modern Economy, 3(1), 91–99. https://doi.org/10.4236/me.2012.31013
- Martinez-Ferrero, J., & Frias-Aceituno, J. (2015). Relationship between sustainable development and financial performance: International empirical research. Business Strategy and the Environment, 24(1), 20–39. https://doi.org/10.1002/bse.1803
- Marti, P., Rovira-Val, C., & Drescher, L. (2015). Are firms that contribute to sustainable development better financially? Corporate Social Responsibility and Environmental Management, 22(5), 305–319. https://doi.org/10.1002/csr.1347
- Medel, C. (2015). Producers, politicians, warriors, and forecasters: Who’s who in the oil market. MPRA Paper, University Library of Munich.
- Miralles-Quirós, J., Miralles-Quirós, M., & Nogueira, J. (2018). Diversification benefits of using exchange-traded funds in compliance to the sustainable development goals. Business Strategy and the Environment, 28(1), 244–255. https://doi.org/10.1002/bse.2253
- Mirza, N., Abubakr, M., Thu, T., Nguyen, H., Arfaoui, N., & Oliyide, J. A. (2023). Are sustainable investments interdependent? The international evidence. Economic Modelling, 119, 106120. https://doi.org/10.1016/j.econmod.2022.106120
- Narayan, P., Ahmed, H., & Narayan, S. (2015). Do momentum-based trading strategies work in the commodity futures markets? Journal of Futures Markets, 35(9), 868–891. https://doi.org/10.1002/fut.21685
- Narayan, P., & Sharma, S. (2015). Does data frequency matter for the impact of forward premium on spot exchange rate? International Review of Financial Analysis, 39, 45–53. https://doi.org/10.1016/j.irfa.2015.01.011
- Olanipekun, I. O., & Alola, A. A. (2020). Crude oil production in the Persian Gulf amidst geopolitical risk, cost of damage and resources rents: Is there asymmetric inference? Resources Policy, 69(September), 101873. https://doi.org/10.1016/j.resourpol.2020.101873
- Omar, A., Wisniewski, T., & Nolte, S. (2017). Diversifying away the risk of war and cross border political crisis. Energy Economics, 64, 494–510. https://doi.org/10.1016/j.eneco.2016.02.015
- Phillips, P., & Perron, P. (1988). Testing for a Unit Root in Time Series Regression. Biometrika, 75(2), 335–346.
- Porter, M., & Kramer, M. (2006). Strategy and society: The link between competitive advantage and corporate social responsibility. Harvard Business Review, 84, 42–56. https://hbr.org/2006/12/strategy-and-society-the-link-between-competitive-advantage-and-corporate-social-responsibility
- Ransariya, S., & Bhayani, S. (2015). Relationship between corporate social responsibility and financial performance of RIL. Pacific Business Review International, 7(11), 66–75.
- Sadorsky, P. (2012). Correlations and volatility spillovers between oil prices and the stock prices of clean energy and technology companies. Energy Economics, 34(1), 248–255. https://doi.org/10.1016/j.eneco.2011.03.006
- Salisu, A., & Shaik, M. (2022). Islamic stock indices and COVID-19 pandemic. International Review of Economics and Finance, 80, 282–293. https://doi.org/10.1016/j.iref.2022.02.073
- Shahzad, U., Mohammed, K. S., Tiwari, S., Nakonieczny, J., & Nesterowicz, R. (2023). Connectedness between geopolitical risk, financial instability indices and precious metals markets: Novel findings from Russia Ukraine conflict perspective. Resources Policy, 80(December 2022), 103190. https://doi.org/10.1016/j.resourpol.2022.103190
- Singh, D., Theivanayaki, M., & Ganeshwari, M. (2021). Examining volatility spillover between foreign exchange markets and stock markets of countries such as BRICS countries. Global Business Review, 097215092110205. https://doi.org/10.1177/09721509211020543
- Smales, L. (2021). Geopolitical risk and volatility spillovers in oil and stock markets. The Quarterly Review of Economics and Finance, 80, 358–366. https://doi.org/10.1016/j.qref.2021.03.008
- Sohag, K., Hammoudeh, S., Elsayed, A., Mariev, O., & Safonova, Y. (2022). Do geopolitical events transmit opportunity or threat to green markets? Decomposed measures of geopolitical risks. Energy Economics, 111(19), 106068. https://doi.org/10.1016/j.eneco.2022.106068
- Solarin, S. A., Al-Mulali, U., & Ozturk, I. (2018). Determinants of pollution and the role of the military sector: Evidence from a maximum likelihood approach with two structural breaks in the USA. Environmental Science and Pollution Research, 25(31), 30949–30961. https://doi.org/10.1007/s11356-018-3060-5
- Statman, M., & Glushkov, D. (2008). The wages of social responsibility. Retrieved August 12, 2022, http://www.socialinvest.org/resources/research/documents/2008WinningPrize-Moskowitz.pdf
- Su, C. W., Khan, K., Umar, M., & Zhang, W. (2021). Does renewable energy redefine geopolitical risks? Energy Policy, 158(September), 112566. https://doi.org/10.1016/j.enpol.2021.112566
- Sweidan, O. (2021). The geopolitical risk effect on the US renewable energy deployment. Journal of Cleaner Production, 293(June 2020), 126189. https://doi.org/10.1016/j.jclepro.2021.126189
- Umar, Z., Bossman, A., Choi, S. Y., & Teplova, T. (2022). Does geopolitical risk matter for global asset returns? Evidence from quantile-on-quantile regression. Finance Research Letters, 48(May), 102991. https://doi.org/10.1016/j.frl.2022.102991
- Umar, Z., Gubareva, M., Tran, K., & Teplova, T. (2021). Impact of COVID-19 induced panic on the environmental, social and governance leaders equity volatility: A time frequency analysis. Research in International Business and Finance, 58, 101493. https://doi.org/10.1016/j.ribaf.2021.101493
- Umar, Z., Kenourgios, D., & Papathanasiou, S. (2020). The static and dynamic connectedness of environmental, social, and governance investments: International evidence. Economic Modelling, 93(August), 112–124. https://doi.org/10.1016/j.econmod.2020.08.007
- Umar, Z., Polat, O., Choi, S., & Teplova, T. (2022). The impact of the Russia-Ukraine conflict on the connectedness of financial markets. Finance Research Letters, 48(March), 102976. https://doi.org/10.1016/j.frl.2022.102976
- Vives, A., & Wadhwa, B. (2012). Sustainability indices in emerging markets: Impact on responsible practices and financial market development. Journal of Sustainable Finance & Investment, 2, 318–337. https://doi.org/10.1080/20430795.2012.715578
- Wang, Y., Bouri, E., Fareed, Z., & Dai, Y. (2022). Geopolitical risk and the systemic risk in the commodity markets under the war in Ukraine. Finance Research Letters, 49(May), 103066. https://doi.org/10.1016/j.frl.2022.103066
- Wood, D. (2008). Corporate responsibility and stakeholder theory: Challenging the neoclassical paradigm, in: Agle, B.R., Donaldson, T., Freeman, R.E., Jensen, M.C., Mitchell, R. and wood, D.J. (2008). Dialogue: Towards a superior stakeholder theory. Business Ethics Quarterly, 18(2), 153–190. https://doi.org/10.5840/beq200818214
- Yang, K., Wei, Y., Li, S., & He, J. (2021). Geopolitical risk and renewable energy stock markets: An insight from multiscale dynamic risk spillover. Journal of Cleaner Production, 279, 123429. https://doi.org/10.1016/j.jclepro.2020.123429
- Yousaf, I., & Ali, S. (2020). The COVID-19 outbreak and high frequency information transmission between major cryptocurrencies: Evidence from the VAR-DCC-GARCH approach. Borsa Istanbul Review, 20(1), 1–10. https://doi.org/10.1016/j.bir.2020.10.003
- Yousaf, I., Patel, R., & Yarovaya, L. (2022). The reaction of G20+ stock markets to the Russia–Ukraine conflict “black-swan” event: Evidence from event study approach. Journal of Behavioral and Experimental Finance, 35, 100723. https://doi.org/10.1016/j.jbef.2022.100723
- Yousaf, I., Suleman, M. T., & Demirer, R. (2022). Green investments: A luxury good or a financial necessity? Energy Economics, 105(November 2021), 105745. https://doi.org/10.1016/j.eneco.2021.105745
- Zhang, W., He, X., & Hamori, S. (2022). Volatility spillover and investment strategies among sustainability-related financial indexes: Evidence from the DCC-GARCH-based dynamic connectedness and DCC-GARCH t-copula approach. International Review of Financial Analysis, 83(January), 102223. https://doi.org/10.1016/j.irfa.2022.102223
- Zhang, H., Liu, C., Zhao, M., & Sun, Y. (2018). Economics, fundamentals, technology, finance, speculation and geopolitics of crude oil prices: An econometric analysis and forecast based on data from 1990 to 2017. Petroleum Science, 15(2), 224–242. https://doi.org/10.1007/s12182-018-0228-z
- Zhao, W., Zhong, R., Sohail, S., Majeed, M. T., & Ullah, S. (2021). Geopolitical risks, energy consumption, and CO2 emissions in BRICS: An asymmetric analysis. Environmental Science and Pollution Research, 28(29), 39668–39679. https://doi.org/10.1007/s11356-021-13505-5
- Zhou, L., Gozgor, G., Huang, M., & Lau, M. (2020). The impact of geopolitical risks on financial development: Evidence from emerging markets. Journal of Competitiveness, 12(1), 93–102. https://doi.org/10.7441/joc.2020.01.06
