
ABSTRACT
Asphalt mastic (bitumen + filler) plays an essential role in the fatigue performance of asphalt pavements. The time sweep test is one of the bestknown test methods for assessing fatigue performance, but fracture initiation in the specimen and the high stiffness of the mastic may bias results. These problems can be avoided with a hyperbolic specimen, but this test geometry is still largely unexplored. Therefore, 20 different asphalt mastic mixes were tested with the dynamic shear rheometer and hyperbolic specimen shape to identify the impact of various fillers and their properties, moisture, and aging on fatigue performance. These results were compared with the findings in the literature to investigate the applicability of this novel test method. Thus, a correlation could be derived between the fractional void and the fatigue performance of asphalt mastic. As also described in the literature, moist filler or water stored mastic reduce fatigue performance.
1. Introduction
Rutting, thermal cracking, and fatigue are the main causes of damage on asphalt pavements while cracking is accelerated by asphalt aging. Surface layers’ premature failures have increasingly occurred on parts of the national road network, which cannot systematically be attributed to climatic or traffic-related load. Currently, it can be assumed that these damages are caused by a lack of durability of the asphalt mastic (bitumen + filler). In general, it is supposed that cohesive and adhesive microcracks in asphalt mixtures initiate fatigue cracking, and the mastic’s essential properties affect this cracking phenomenon (Kim et al., Citation2003). Mastic is considered the essential bonding component in asphalt and plays a significant role in the overall performance.
In recent years, the assessment of fatigue performance has shifted from the bitumen to the mastic level (Airey et al., Citation2004). The basis was that the filler properties significantly influence the fatigue behaviour of asphalt mixtures. It has already been shown that adding filler to bitumen increases the stiffness and the resistance to deformation under loading (Hesami et al., Citation2013). The filler has a significant effect on the fatigue behaviour of asphalt mastic. Also, filler properties such as density, specific surface area, or factional voids RV significantly influence the material behaviour (Mazzoni et al., Citation2019; Roberto et al., Citation2018; Rochlani et al., Citation2019). The choice of filler affects the aging and moisture sensitivity of asphalt mastic (Choudhary et al., Citation2020; Lesueur et al., Citation2016). Several test methods have been developed or adapted to characterise the material behaviour of asphalt mastic to study the mentioned effects in recent years. One of the most popular test methods with a dynamic shear rheometer (DSR) is the time sweep (TS) test.
The TS test is designed to damage the material structure by repeated loads until a fatigue criterion occurs. Thus, this test setup follows standard experimental methods for evaluating fatigue damage on asphalt mix level. Commonly, cylindrical specimen is used for TS test. However, Anderson et al. (Citation2001), Kim et al. (Citation2021) and Hospodka et al. (Citation2018) showed that TS test with cylindrical specimen is unsuitable. The bitumen or mastic requires the necessary stiffness to create microcracks in the structure, associated with high torque. Not all DSRs available on the market can apply such a large torque or cause a significant measurement error due to motor cooling during long-term tests (Anderson et al., Citation2001; Kim et al., Citation2021). For samples with high stiffness, fracture occurs not only in the specimen but also in the transition region to the measurement geometry, which results in an abort of measurement (Hospodka et al., Citation2018).
The remedy is a hyperbolic specimen shape, introduced by Hospodka et al. (Citation2018). Due to the stress concentration in the necking of the sample, an actual cohesive fracture occurs in the mastic specimen. Furthermore, the load on the DSR is reduced because a smaller torque is required due to the necking. The influences from motor cooling can be limited. It has already been shown that the assessment of the fatigue performance of asphalt mastic determined with DSR on cylindrical and hyperbolic specimens is identical (Steineder et al., Citation2022).
However, it is of particular interest to see how filler properties, moisture, and aging influence the fatigue performance of asphalt mastic, tested with TS test and hyperbolic specimens and whether the results are comparable to other studies. As part of a large study, intending to derive a reliable prediction model of the fatigue performance of asphalt mixtures by tests on asphalt mastic level, this paper studies the influences of filler properties (grading curve, true density, specific surface area, fractional void, grain shape), aging, and moisture on the fatigue performance of asphalt mastics. Due to the high number of tests necessary to describe one material thoroughly, only one test method could be investigated. The investigation of the different mastic mixes and the bitumen used with other loading modes or test methods could not be examined within the scope of this study. Instead, results are compared with findings in the literature to investigate the applicability of this novel test method. The objective is to examine whether a hyperbolic specimen shape is suitable to correctly describe the influences of filler, aging, and moisture. From this, it will be deduced whether it makes sense to use hyperbolic specimens or to remain with cylindrical specimen shapes to assess the fatigue performance of asphalt mastic.
2. Materials
As part of the extensive study, fatigue tests at the asphalt mix level are planned in the future to compare results on asphalt mix and asphalt mastic levels. Therefore, the required quantities of bitumen and filler for the asphalt mastic are weighed according to a respective asphalt mix design. This mix design will be used to prepare specimens for fatigue tests on the asphalt mix level in the next step of this research. Asphalt concrete (AC) with a binder content of 5.2% and a maximum grain size of 11 mm was selected as an asphalt mix design to study the fatigue performance of asphalt mastic.
Based on the chosen asphalt mix and grading curve of the aggregates and fillers, the mastic mix formulation was derived, and the related materials were selected. Due to national standards and regulations, the weight of asphalt is determined based on its mass. Therefore, the asphalt mastic is mixed in relation to the mass to examine an exact image of the mastic from the reference asphalt mix. All fillers used in this study have a maximum grain size of 0.125 mm. The asphalt mastic comprises bitumen, filler from the coarse aggregates (filler that exists in the coarse aggregates as an undersized particle in the grain groups, designated as own filler in this study), and added filler from various sources. According to EN 13108-Citation1 (Citation2016), the respective proportions were calculated based on the grading curve of the asphalt mixture. The mastic consists of 33.13 M.% (Percent by mass) bitumen and 66.87 M.% filler (own filler + added filler). A wide range of materials was used in this research study to investigate the various influences of added filler and bitumen on fatigue performance. Two different bitumen and six different added fillers were used. Thus, 12 different types of mastic were produced and studied. A coarse reference aggregate (Granite porphyry) was sieved for the own filler. These sieved coarse aggregates will be used in the future to produce asphalt mix specimens for further studies by adding the different asphalt mastics. The percentage of the own filler with a grain size fraction 0/0.125 mm to the total mass of mastic is 3.79%. Sieving sands extracted the added fillers with the grain size fraction 0/0.125 mm from different mines or industries. The percentage of the added filler to the total mass of mastic is 63.08%. These proportions correspond to a filler bitumen ratio by mass of 2.02 for all mastic mixes. The resulting filler volume ratio by using different fillers in the mastic mix is given in Table . The high filler bitumen ratio is due to the selected grain size of 0/0.125 mm for the filler and the derivation of the mix design from the asphalt mixture. As a result, the filler volume ratio is higher than for mastic mixes, with a maximum grain size of 0.063 mm. Table summarises the mixed fillers used in this study and the corresponding abbreviations. Since hydrated lime is not used by itself as an added filler, a mixed filler of lime and hydrated lime is used in this study. For this purpose, both fillers mixed in a ratio of 30:70 in the appropriate steps. 30% hydrated lime corresponds to the common use in road construction (European Lime Association, Citation2010). The mixed filler will be referred to as hydrated lime in the following sections.
Table 1. Own filler and added fillers used in this study.
The bitumen grades used in this study can be found in Table . The bitumens used in this study are an unmodified bitumen 70/100 and a polymer-modified bitumen PmB 45/80-65.
Table 2. Bitumen grades and test results.
The needle penetration (Pen) and the softening point with ring and ball (R&B) were determined for the two bitumen grades. The test method for determining needle penetration is regulated in the standard EN Citation1426 (Citation2015). The determination of the softening point with ring and ball is performed according to the standard EN Citation1427 (Citation2015). The results of the bitumen tests are also summarised in Table .
For the production of the asphalt mastic, the two dry filler components (own and added filler) are weighed according to the quantity of mastic produced. The dry filler is homogenised by stirring for about 5 min. The homogenised mixture is then heated at +180°C for 1 h. The heated filler mixture is then added at +180°C to the pre-heated bitumen and mixed until a homogeneous mastic is produced. The mastic mixture is stirred at room temperature until it solidifies and stored in the refrigerator before use to prevent the fillers from sinking.
2. Test methods
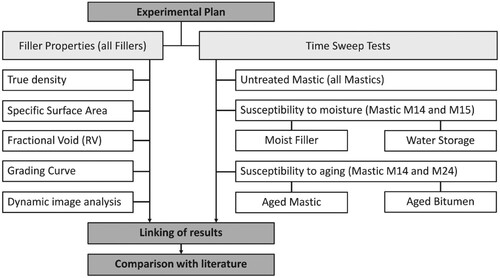
The following section summarises the tests carried out at filler and mastic levels. As specified, the base material for filler for all tests was the mixed filler of own and added filler. Figure shows the experimental plan.
Figure 1. Experimental plan.
3.1. Mastic fatigue test
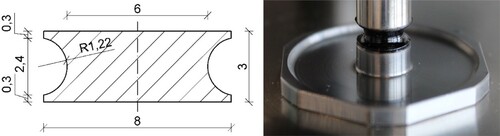
The fatigue performance tests on the mastic are carried out with DSR and time sweep (TS) tests. The hyperbolic mastic specimens are prepared directly in the DSR using a silicone mold and are conditioned at +10°C. At this test temperature, the asphalt mastic reaches the necessary stiffness to prevent creep of the specimen in the rheometer during the fatigue test; at higher temperatures, the specimen will lose its original shape (Figure ).
Figure 2. Dimensions of hyperbolic mastic specimens (left) and mounted mastic specimen (right).
Dynamic tests on the four-point bending beam (4PB) on asphalt mixture level according to EN 12697-Citation24 (Citation2018) are currently one of the most common test methods to describe the fatigue performance of asphalt. A test frequency of 30 Hz is commonly used for these tests and also set by the European Standard EN 13108-Citation1 (Citation2016). Since it is planned to perform the tests at the asphalt mixture level using 4PB, 30 Hz were also chosen as a frequency for mastic tests. Thus, same conditions on the mastic and asphalt mix level are ensured. The hyperbolic specimen shape is used to prevent failure at the interface of the test geometry and mastic specimen due to the high stiffness. The necking in the middle creates a predetermined breaking point due to the stress concentration in this area. Studies by Hospodka et al. (Citation2018) have shown that both dynamic modulus and fatigue life have good repeatability realised with the stresscontrolled TS-Test. In EN 14770 (Citation2012), there is no value for repeatability defined for standard DSR tests. In the study by Hospodka et al. (Citation2018), ten fatigue tests on the hyperbolic specimen at a shear stress level of 400 kPa and a frequency of 30 Hz were performed on the same mastic mix. The fatigue life, expressed as the number of load cycles to failure, and the complex shear modulus after 10 s, corresponding to 300 load cycles, were used to determine repeatability. The complex shear modulus after 10 s is designated as the initial complex shear modulus in this study. The standard error’s median and 95% confidence interval were calculated to investigate the quality of the measured fatigue life. The true fatigue life was between 188,000 and 212,000 load cycles with 95% confidence, corresponding to about ±6% of the mean value and conforming to good repeatability. One reason for the good repeatability is that, due to the silicone mould, the specimen shape is identical for each test, and measurement influences due to trimming are avoided. As in the study by Hospodka et al. (Citation2018), stress-controlled TS tests are used in the present study due to good repeatability. The failure criterion was defined as reaching the maximum phase angle. In stress-controlled TS tests, the independence of the fatigue criteria (reduction of stiffness, phase angle peak, dissipated energy ratio, and ratio of dissipated energy change) on the fatigue evaluation could be shown (Steineder et al., Citation2022). All measured fatigue load cycles dependent on the selected fatigue criterion correlate with a determination coefficient of approximately 1.0. This means that the fatigue criterion does not influence the correlation analyses for stress-controlled TS tests. For each mastic mix in this study, three stress-controlled TS tests are performed for three different shear stresses, resulting in 9 tests per mastic.
The selected stress levels varied between 300 and 1200 kPa. These stress levels were chosen to obtain similar load cycles. The aim was to achieve around 10,000 load cycles at high and 800,000 load cycles at low-stress levels. It should be noted that these are nominal shear stresses, as the actual shear stress at the predetermined breaking point is higher due to the necked specimen shape. The DSR calculates the shear stress at the maximum radius for a cylindrical specimen shape. Because the complex shear modulus is linked with the shear stress, this study also deals with nominal complex shear modulus. The actual initial complex shear modulus due to necking is larger. The nominal values are used since there is still no method of converting nominal values into actual values resulting from the necking.
3.2. True density
The true density was determined using a helium pycnometer for the fillers, according to DIN 66137-Citation2 (Citation2019). The volume of the sample is precisely determined based on gas displacement. Each test consists of 10 measuring cycles, and from the results obtained, the mean value of the true density of the fillers was calculated.
3.3. Specific surface area
The BET test method can be used to measure the specific inner and outer surface area of disperse or porous solids according to ISO Citation9277 (Citation2014). The amount of physically adsorbed gas is determined by the method of Grünauer, Emmett, and Teller (BET method) (Brunauer et al., Citation1938). This method is based on determining the amount of adsorbate or adsorptive gas required to cover the outer and inner accessible sample surface of the solid with a complete adsorbate monolayer. Inaccessible pores cannot be included. The BET method cannot be used for materials that absorb the gas (ISO, Citation9277, Citation2014).
3.4. Fractional void (RV)
The fractional void of dry compacted mineral filler, referred to as RV, is determined according to EN Citation1097-Citation4 (Citation2008). The filler is compacted using a standardised compaction device, and the volume of the compacted filler is determined by measuring the layer height. The RV is calculated using determined height, the mass of compacted filler, the density of filler, and the diameter of the hole in the drop block.
3.5. Grading curve
The grading curve up to 0.002 mm of the fillers was determined using a laser particle sizer. The measurements were performed with a FRITSCH Analysette 22 MicroTec Plus measuring system. The instrument is used to determine the size distribution of suspensions, emulsions, and powders based on laser diffraction.
3.6. Dynamic image analysis
Dynamic image analysis can investigate the particle shape of the filler. For this purpose, the filler is dispersed in a solution and then fed to the analyzer. The filler particles are imaged using a high-resolution camera and a high-speed flash unit. Individual particle images are recorded directly and captured as high-resolution graphics files for post-processing. The dynamic, turbulent flow path allows random particle orientation and a direct view of moving particles within the capture zone. Various grain shape properties describe the particle shape through the obtained two-dimensional images of the individual particles.
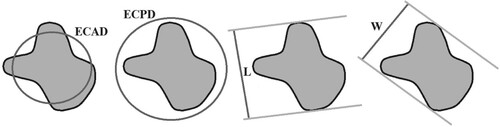
Figure shows basic characteristic values of dynamic image analysis:
The equivalent circle area diameter ECAD (µm) describes a circle’s diameter with the same area as the particle.
The equivalent circle perimeter diameter ECPD (µm) corresponds to the diameter of a circle with the same perimeter as the particle image silhouette.
The length L (µm) of a particle is estimated according to the maximum Feret diameter. The maximum Feret diameter corresponds to the largest distance between two parallel lines that do not intersect the particle.
The width W (µm) corresponds to the minimum Feret diameter. The minimum Feret diameter corresponds to the smallest distance between two parallel lines that do not intersect the particle.
The ratio of length by width can be calculated from the two values, referred to as the Feret aspect ratio FA.
The circularity C is the ratio of the particle area to the area of the bounding circle that surrounds but does not intersect a particle. The diameter of the bounding circle is defined as the diameter of the smallest circle that encloses but does not intersect the particle. For circularity, the value is 1 for a perfectly round particle and becomes smaller the larger the deviation from the perfect circle.
The ellipticity E is calculated similarly to the circularity. Here, the value for ellipticity corresponds to the ratio of the particle area to the area of the bounding ellipse. A value of 1 will conform to a perfect elliptical shape. If the particle shape deviates from the elliptical shape, the value becomes smaller.
The rectangularity R is the ratio of the particle area to the area of the minimum bounding rectangle. The smallest possible area defines the bounding rectangle encloses but does not intersect the particle. The rectangularity has a value of 1 for an exactly rectangular particle and becomes smaller as it deviates from this shape.
Figure 3. Characteristic values of dynamic image analysis.
3.7. Susceptibility to moisture
Two different manufacturing methods were used for the mastic to examine the impact of moisture on the fatigue performance of asphalt mastic. The first production method results in a mastic mixture with residual moisture in the filler. The filler is mixed with distilled water until complete water saturation is achieved. After a soaking time of 24 h, the filler-water mixture is heated at +180°C in the oven. By regular weighing, the filler is heated until 10% residual moisture is reached in the mix. Immediately after that, the filler is mixed with bitumen heated to +180°C. Water evaporates during the mixing process, so there is residual moisture of around 5% in the cooled mastic. With the second production method, mastic samples are stored in a water bath under the influence of temperature and pressure for 24 h. This preparation method is to test the water sensitivity of the mastic mixes. The increased pressure and temperature should accelerate water penetration into the mastic structure. In addition, water penetration into fine pores and voids benefits from test conditions. The test setup presented in this study is a prototype, as there is no standardised test setup yet.
For this purpose, 2 g of mastic are poured into a silicone mold with a diameter of 25 mm. The resulting thin and round mastic platelets are placed in a glass dish with distilled water. The glass dish with the mastic samples is stored in a pressure vessel for 24 h. The internal pressure is +5bar, and the internal temperature in the vessel is +60°C. Afterward, the mastic samples are stored in the refrigerator. The reason for keeping the mastics under pressure at an elevated temperature is to simulate significantly longer water storage of the mastics under ‘normal conditions’. The selected test conditions are based on the performance characteristics of the vessel used. Since no empirical values are available for this type of test setup, an initial trial was performed as part of this study to determine whether possible changes in the fatigue performance of the asphalt mastics can be detected.
The fillers F04 and F05 and the bitumen B01 were used for these two production methods. These are the most commonly used filler materials. The prepared mastics specimens’ fatigue performance was then tested in the DSR.
3.8. Susceptibility to aging
Two different manufacturing methods were used for the mastic to investigate the effect of aging on the fatigue performance of asphalt mastic. For the preparation of the aged mastic samples, two different aging methods were used. On the one hand, only the bitumen was aged. The aged bitumen was then used to produce the mastic. On the other hand, the already mixed mastic was aged. Both methods using the RTFOT method according to EN 12607-Citation1 (Citation2015) and PAV method according to EN 14769 (Citation2012) for aging. The aged specimens were then tested for fatigue performance by TS test. The two bitumen grades B01 and B02 with the filler F04 were used for the aging methods.
4. Results and discussion
Regression analyses can be performed based on the numerous tests at filler and mastic levels. Thus, correlations between filler morphology and asphalt mastic can be identified. In addition, the results are compared with findings from the literature to be able to assess the observations. The mastic mixtures are considered separately according to bitumen grades for the analyses since a joint evaluation by means of regression analyses is not possible.
4.1. Mastic fatigue test
Figure summarises the results for the 12 mastic mixes. The designations for the mastic grades are composed of the number of the bitumen and the number of the filler. The first digit represents the bitumen used (M1x and M2x), and the second digit represents the filler used (Mx1; Mx2. Mx3. Mx4. Mx5 and Mx6).
Figure 4. Test results of mastic fatigue performance tests.
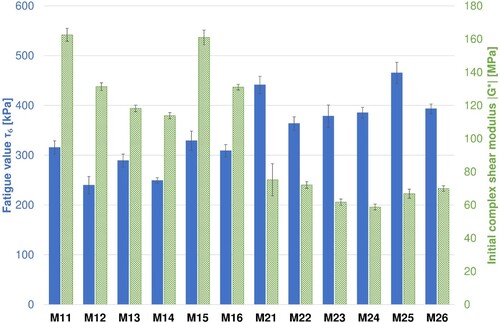
The results in Figure show that the mastic mixes with polymer-modified bitumen achieve a higher τ6 value (M21–M26). The increase in fatigue performance by using polymer modified bitumen is in accordance with general observations (Micaelo et al., Citation2017), and the mastic mixes with unmodified bitumen (M11–M16) have a higher stiffness. Also, the mastic mixes with filler F01 and F05 (M11, M15, M21, and M25) show a higher τ6 value than the corresponding mastic mixes. Furthermore, the results show no direct correlation between fatigue performance and initial complex shear modulus (the complex shear modulus after 10 s). In general, mixtures with hydrated lime show higher stiffness and better durability than normal filler (Kim et al., Citation2003; Lesueur et al., Citation2012). This effect can be observed in the results. The positive influence of granodiorites on fatigue performance has also already been observed in another study (Rochlani et al., Citation2019).
4.2. True density
Table lists the determined true densities of the six investigated fillers using a helium pycnometer. Accordingly, F05 with 2.57 g/m3 has the lowest true density, while F03 with 3.0 g/m3 has the highest true density. The other fillers have true densities between 2.7 and 2.9 g/m3. Considering the coefficient of determination (R2 = 0.049 and R2 = 0.017) of the correlations between the fatigue value τ6 and the true density, it can be assumed that the true density does not influence the fatigue performance. Studies show that increasing particle density causes a higher mastic stiffness but no clear trend on fatigue performance (Mazzoni et al., Citation2019). However, no correlation between the true density and the initial complex shear modulus could be found either. Due to the massrelated weighed portion of mastic, all mixtures have a filler bitumen ratio of 2.02 by mass. However, the true density affects the filler volume ratio. Based on the volume, the filler content by volume changes as summarised in Table . The stiffness increases as the filler content by volume increases (Liao et al., Citation2012; Miro et al., Citation2017). This increase in stiffness cannot be observed in the results. The reason for this is probably the low variation of the filler content by volume in the mastic mixes. If we look at the correlation between filler volume ratio, there is no correlation between filler volume ratio and the fatigue parameter τ6 (R2 = 0.36 and R2 = 0.64) or the initial complex shear modulus |G∗|initial (R2 = 0.065 and R2 = 0.29). It is undisputed that adding filler to bitumen increases fatigue performance, but excessive filler concentrations lead to a decrease in fatigue performance (Wang et al., Citation2012). However, due to the large scale of tests, the filler-bitumen ratio was not varied in this study.
Table 3. Results for true density, specific surface and fractional void RV.
4.3. Specific surface area (SSA)
Table summarises the specific surface areas (SSA) determined for the six fillers investigated using the BET method. Especially the filler made of basalt stands out due to the large SSA. The reason for the high SSA of F03 is probably a high amount of tiny pores in the fine grain. In literature (Rochlani et al., Citation2019), the fillers’ specific surface area affects the mastics’ rheological and mechanical performance. A filler with a higher specific surface area mixed with bitumen shows better stiffness, aging, fatigue, and rutting performance.
Considering the coefficient of determination of the correlations between the fatigue value τ6 and SSA (R2 = 0.0321 and R2 = 0.01), no correlation would be expected. But due to the high SSA of F03 and the small sample quantity, the regression is excessively influenced by Mx3 samples. Especially brecciated and altered basalt samples can have an SSA value up to 52 m2/g (Nielsen & Fisk, Citation2010). Without the M13 mix, the coefficient of determination of the correlation between τ6 and SSA increases to R2 = 0.47 for mastic mixes with the bitumen B01. The coefficient of determination of the correlation between τ6 and SSA increases to R2 = 0.86 for mastic mixes with the polymer-modified bitumen B02 without the M23 mix. The reason for the low coefficient of determination for the mastic mixes with the unmodified bitumen B01 is the sample with quartz as filler. Due to its smooth surface, it has a very small SSA of only 1.29 m2/g. This observation concludes a correlation between the fatigue value τ6 and SSA if mastic mixes with fillers with high or low SSA are not considered. Excluding these two mastic mixes, the coefficient of determination of the correlations between the τ6 and SSA is R2 = 0.96 and R2 = 0.93, respectively.
Thus, SSA impact the fatigue performance of asphalt mastic, measured with a stress-controlled TS test and hyperbolic specimen shape. The situation is similar for the initial complex shear modulus and the SSA. Here, the mastic mixes with unmodified bitumen (excluding M13) show a good correlation (R2 = 0.84). However, no correlation with stiffness can be derived for mastic mixes with modified bitumen. It is assumed that due to the larger surface area of the filler, there is a better adhesion between bitumen and filler, which minimises the crack initiation between bitumen and filler. In addition, chemical reactions between bitumen and filler can be enhanced (Rochlani et al., Citation2019).
4.4. Fractional void (RV)
Correlations between the physical properties of fillers show that RV can be used as a suitable candidate to characterise the physical behaviour of fillers (Chaudhary et al., Citation2020). The results of the fractional void tests are summarised in Table . Especially F01 and F05 have a high RV value. Figure shows the correlation between the fatigue value τ6 and the RV separately for both bitumen grades. The green line represents the regression line for the mastic mixes with the unmodified bitumen B01. The blue line represents the regression line for the mastic mixes with the polymer-modified bitumen B02. The coefficient of determination of the two correlations is R2 = 0.76 and R2 = 0.80.
Figure 5. Correlation between the fatigue value τ6 and the RV.
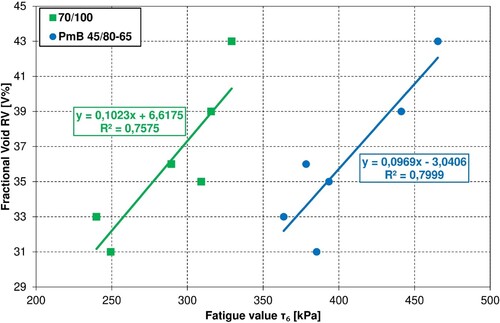
These two correlation analyses allow the conclusion that the RV of the filler influences the fatigue performance of the asphalt mastic. The study by Roberto et al. (Citation2018) show that the filler type and RV affect the fracture limits. Accordingly, the fatigue value τ6 of the asphalt mastic can also be estimated from the RV of the filler. Thus, this parameter is suitable to characterise the filler quality in terms of fatigue performance of the asphalt mastic. A series of further tests must be carried out to validate this observation. The initial complex shear modulus |G∗|initial and RV show no correlation. This observation does not correspond to the literature observations; with higher RV, the stiffness increases (Chen et al., Citation2020; Mazzoni et al., Citation2019).
4.5. Grading curve and dynamic image analysis
Figure shows the grading curves of the different fillers. It is possible to derive characteristic values relevant to the grading curves from the data obtained. The characteristic values describe the different grading curves and are used for subsequent analyses. The most important characteristic values related to the grading curves include the passage rate through a selected sieve (S), the coefficient of curvature Cc, the coefficient of uniformity U and the calculated maximum mesh size in millimetres of a sieve with a defined mass percent of the filler passes through (D).
Figure 6. Grading curves of used fillers.
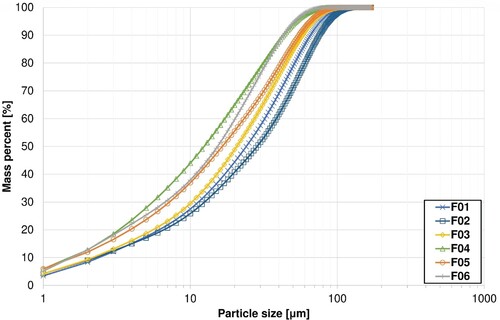
All characteristic values are summarised in Table . From the grading curve and the characteristic values relevant to the grading curve, it can be seen that the fillers F04 to F06 have a high proportion of very fine grain in the filler.
Table 4. Characteristic values related to the grading curves.
Studies show that grain size and roundness influence material behaviour (Antunes et al., Citation2015; Grabowski & Wilanowicz, Citation2007). Table summarises the results represented as mean values of the dynamic image analysis. It can be observed that F04 and F05 have small ECAD and ECPD, while F01 has the largest values. F01 also has the largest deviations from the perfect circle and ellipse compared to the other fillers. On the other hand, F05 has the highest circularity and ellipticity values. According to the results for rectangularity, no clear differences can be found among the fillers.
Table 5. Results of the dynamic image analysis represented as mean values.
Table summarises the coefficients of determination of the regression analyses between the fatigue value τ6 and the characteristic values relevant to the grading curve and the grain shape. None of the determined values shows a correlation with τ6. Consequently, there is no direct correlation between the fatigue performance of asphalt mastic and grading curve or grain shape. The observations from the literature, that grain size and roundness influence material behaviour (Antunes et al., Citation2015; Grabowski & Wilanowicz, Citation2007), are not confirmed by the results. A possible reason for the missing impact of the grain shape on τ6 could be the small scatter in the results of the grain shape of the fillers used in this study. To exclude the effect of grain shape, fillers with a higher variation of grain shape have to be used.
Table 6. R2 of the regression analyses between τ6 and the characteristic values relevant to the grading curve and the grain shape.
The coefficient of determination for the correlation between FA and |G∗|initial for the mastic mixes with polymer-modified bitumen (M2x) is 0.66. Since this is only valid for the M2x mastic mixes, it can be assumed that there is no direct correlation between the initial complex shear modulus and the characteristic values according to grading curve or grain shape.
4.6. Susceptibility to moisture
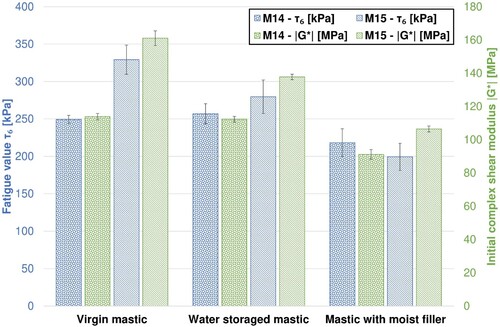
The mineralogical composition of fillers influences the moisture resistance of asphalt mixes (Choudhary et al., Citation2020). The results of the fatigue tests including moisture conditioning are shown in Figure . It can be seen that the water storage only affects the mastic with filler F05. The fatigue value τ6 and the initial complex shear modulus |G∗|initial decrease. These changes are probably due to the water sensitivity of hydrated lime since the mastic with filler F04 remains unaffected by water storage. An evident influence can be seen in the mastic specimens with wet filler. The fatigue value τ6, as well as the initial complex shear modulus |G∗|initial decreases for both mastic mixes. As a result of the mastic’s mounting temperature of over +100°C, the bonded water in the mastic dissolves as vapour. As the water evaporates from the mastic, tiny air bubbles occur in the hot liquid mastic. These air bubbles probably generate voids in the solidified mastic sample and harm the mastic structure. As a result, a smaller transmission area is available in the necking of the specimen, which reduces fatigue resistance. The reduced initial complex shear modulus also indicates that the stiffness decreases due to the smaller transmission area. Thus, the shear deformation to reach the selected shear stress is higher, leading to a faster formation of microcracks.
Figure 7. Test results of mastic fatigue performance tests under the influence of moisture.
4.7. Susceptibility to aging
Figure shows that the fatigue parameter τ6 and the initial complex shear modulus |G∗|initial increase as a result of aging. Studies show that aging increases the complex shear modulus (Xing, Fan, et al., Citation2020). Also, an increased amount of aged bitumen independent of the filler considered increases mastic stiffness (Mazzoni et al., Citation2019). These observations are consistent with the results. According to Li et al. (Citation2018), the stiffness increases while the fatigue resistance decreases with the increase of aging time.
Figure 8. Test results of mastic fatigue performance tests under the influence of aging.
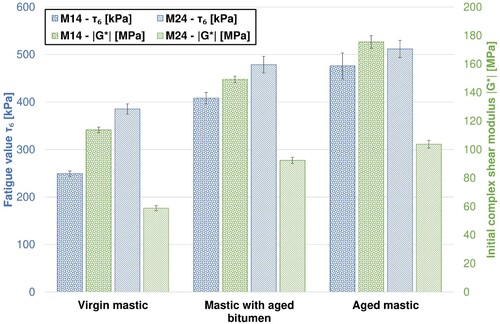
However, the increase in fatigue performance is contrary to the expectations and is due to the stress-controlled test method used in this study. In a stress-controlled TS test, a high initial stiffness implies a small applied strain in the specimen to reach the defined stress. However, small strains mean that the fatigue deformation in the specimen is small, which is why the number of load cycles to fatigue also increases. The energy lost due to internal friction and viscous deformation is minimised. It can be seen that the mastic samples with aged bitumen and the aged mastic samples lead to different results. These different results are probably by physio-chemical processes or due to the aging of the mastic by the RTFOT process. As a result of the aging process, a thin bitumen film remains in the glass vessel of the RTFOT system. which changes the bitumen/filler ratio. The increasing filler/bitumen ratio due to the loss of bitumen in the RTFOT glass vessel could also increase mastic stiffness. Other studies were also able to show a change of filler/bitumen ratio of mastics by the traditional PAV aging method (Xing, Liu, et al., Citation2020).
4.8. Multiple linear regression analyses
Multiple linear regression analyses were performed to investigate the effects of several filler morphological properties on the fatigue performance of asphalt mastic. Due to the small sample quantity per bitumen grade, a maximum of 2 independent parameters were used for the multiple regression analysis. It was studied whether a rheological parameter of the mastic in combination with a filler parameter produces a better regression model. The multiple regression with the combination of |G∗|initial and RV has a coefficient of determination of 0.58 for M1x and 0.64 for M2x. All other combinations between the rheological parameter of the mastic with a filler parameter have a smaller coefficient of determination. A multiple regression between these parameters does not improve the model. Furthermore, it was studied if two filler parameters produced a better multiple regression model. The multiple regression with RV and BET has a coefficient of determination of 0.57 for M1x and 0.78 for M2x. All other combinations of two filler parameters have smaller coefficients of determination.
Considering the coefficients of determination of the multiple regression analysis, the combination with other parameters does not improve the regression models. However, multiple regressions with RV and any other parameter have significantly better coefficients of determination than with other parameters. This supports the hypothesis that RV is related to the fatigue performance of asphalt mastic.
5. Conclusion
To investigate the effects of filler morphological properties, moisture, or aging on the fatigue performance of asphalt mastic by TS tests and hyperbolic specimen shape, 20 different mastic mixes were analysed in this study. Eight of the twenty mastic mixes were prepared to study the effect of moisture and aging on fatigue resistance, respectively. Based on correlation analysis between results of filler properties and fatigue resistance and initial complex shear modulus of the respective mastic together with a comparison of literature, the following conclusions can be drawn:
Mastic mixtures with polymer-modified bitumen show better fatigue performance than those with unmodified bitumen and thus follows the general observations in literature.
Regarding the true density, grading curve’s properties, and the grain shape of the filler, no direct impact on the fatigue performance τ6 of the asphalt mastic could be found.
As described in other studies, a correlation was found between the fatigue performance τ6 and the fractional void (RV).
The specific surface area has only a limited relationship with the fatigue performance τ6 of asphalt mastic, but corresponds to observations in the literature with a few exceptions. Fillers with a very high or small specific surface area cannot be related to fatigue performance τ6.
Moist filler in the mastic leads to tiny steam bubbles during the production of the mastic specimens in the DSR. These bubbles negatively affect the fatigue performance τ6. Mastic specimens stored in water show deterioration only if the filler is water sensitive, as with hydrated lime.
Aged mastic specimens increase the initial complex stiffness modulus |G∗|initial and the fatigue value τ6. An increase in the initial complex shear modulus is consistent with the literature, but the improved fatigue performance contradicts the observations in the literature. The reason for this is probably the choice of the stress-controlled loading mode. In a stress-controlled time sweep test, a high initial stiffness implies a small applied strain in the specimen to reach the defined stress. However, small strains mean that the fatigue deformation in the specimen is small, wherefore the number of load cycles to fatigue also increases. It can be concluded that a stress-controlled TS test with hyperbolic specimen shape is not suitable to investigate the influences of aging on fatigue performance.
In this study, a time sweep test as a fundamental tool combined with a hyperbolic specimen shape was used to assess the fatigue performance of asphalt mastic. The identified influence of RV, SSA and moisture correspond to the observations from the literature. According to the results and the comparison with the literature, it can be confirmed that the hyperbolic specimen shape is a possible alternative to determine the fatigue performance of asphalt mastic and the effects of filler properties and moisture. The negative experience with cylindrical specimen shape in mastic fatigue tests can be compensated. However, to improve the validity of this study, the mastic mixes should also be tested with other fatigue test methods. Due to the high number of tests necessary to describe one sample thoroughly, this could not be performed in this study. The effects of aging cannot be reproduced with stress-controlled TS tests. Whether this effect could have been avoided by strain-controlled tests was not investigated in this study. By expanding the data set presented in this paper in the future, we aim at improving the correlation quality between asphalt mastic and asphalt mix and establish a new filler criterion in terms of fatigue performance. The implementation of dissipated energy approaches will be considered in subsequent studies.
Acknowledgement(s)
The study reported in this paper is part of the research project on assessment of asphalt mastic quality concerning the durability of asphalt pavements (Beurteilung der Asphaltmastixqualität in Hinblick auf die Dauerhaftigkeit von Asphaltdecken), funded by the Austrian Federal Ministry of Climate Action. Environment. Energy. Mobility. Innovation and Technology and the Federal Ministry for Digital and Economic Affairs.
Disclosure statement
No potential conflict of interest was reported by the author(s).
References
- Airey, G. D., Thom, N. H., Osman, S., Huang, H., & Collop, A. C. (2004). A comparison of bitumen/mastic fatigue data from different test methods. Proceedings of the 5th international conference on cracking in pavements, Limoges, France, 5 May 2004.
- Anderson, D., Hir, Y., Marasteanu, M., Planche, J.-P., Martin, D., & Gauthier, G. (2001). Evaluation of fatigue criteria for asphalt binders. Transportation Research Record: Journal of the Transportation Research Board, 1766, 48–56. https://doi.org/10.3141/1766-07
- Antunes, V., Freire, A. C., Quaresma, L., & Micaelo, R. (2015). Influence of the geometrical and physical properties of filler in the filler–bitumen interaction. Construction and Building Materials, 76, 322–329. https://doi.org/10.1016/j.conbuildmat.2014.12.008
- Brunauer, S., Emmett, P. H., & Teller, E. (1938). Adsorption of gases in multimolecular layers. Journal of the American Chemical Society, 60(2), 309–319. https://doi.org/10.1021/ja01269a023
- Chaudhary, M., Saboo, N., Gupta, A., Hofko, B., & Steineder, M. (2020). Assessing the effect of fillers on LVE properties of asphalt mastics at intermediate temperatures. Materials and Structures, 53(4), 1–16. https://doi.org/10.1617/s11527-020-01532-6
- Chen, Y., Xu, S., Tebaldi, G., & Romeo, E. (2020). Role of mineral filler in asphalt mixture. Road Materials and Pavement Design, 23(2), 247–286. https://doi.org/10.1080/14680629.2020.1826351
- Choudhary, J., Kumar, B., & Gupta, A. (2021). Analysing the influence of industrial waste fillers on the ageing susceptibility of asphalt concrete. International Journal of Pavement Engineering, 23(11), 3906–3919. https://doi.org/10.1080/10298436.2021.1927027
- DIN 66137-2. (2019). Determination of solid state density – Part 2: Gaspycnometry. German Institute for Standardization e.V.
- EN 1097-4. (2008). Tests for mechanical and physical properties of aggregates – Part 4: Determination of the voids of dry compacted filler. European Committee for Standardization.
- EN 12607-1. (2015). Bitumen and bituminous binders – determination of the resistance to hardening under influence of heat and air – Part 1: RTFOT method. European Committee for Standardization.
- EN 12697-24. (2018). Bituminous mixtures – test methods – Part 24: Resistance to fatigue. European Committee for Standardization.
- EN 13108-1. (2016). Bituminous mixtures – material specifications – Part 1: Asphalt concrete. European Committee for Standardization.
- EN 1426. (2015). Bitumen and bituminous binders – determination of needle penetration. European Committee for Standardization.
- EN 1427. (2015). Bitumen and bituminous binders – determination of the softening point – Ring and Ball method. European Committee for Standardization.
- EN 14769. (2012). Bitumen and bituminous binders – accelerated long-term ageing conditioning by a Pressure Ageing Vessel (PAV). European Committee for Standardization.
- EN 14770. (2012). Bitumen and bituminous binders – determination of complex shear modulus and phase angle using a Dynamic Shear Rheometer (DSR). European Committee for Standardization.
- EuLA – European Lime Association. (2010). Hydrated lime: A proven additive for durable asphalt pavements. Report to the European Lime Association / Asphalt Task Force.
- Grabowski, W., & Wilanowicz, J. (2007). The structure of mineral fillers and their stiffening properties in filler-bitumen mastics. Materials and Structures, 41(4), 793–804. https://doi.org/10.1617/s11527-007-9283-4
- Hesami, E., Birgisson, B., & Kringos, N. (2013). Numerical and experimental evaluation of the influence of the filler–bitumen interface in mastics. Materials and Structures, 47(8), 1325–1337. https://doi.org/10.1617/s11527-013-0237-8
- Hospodka, M., Hofko, B., & Blab, R. (2018). Introducing a new specimen shape to assess the fatigue performance of asphalt mastic by dynamic shear rheometer testing. Materials and Structures, 51(46), 1–11. https://doi.org/10.1617/s11527-018-1171-6
- ISO 9277. (2014). Determination of the specific surface area of solids by gas adsorption – BET method. International Organization for Standardization.
- Kim, Y.-R., Little, D., & Song, I. (2003). Effect of mineral fillers on fatigue resistance and fundamental material characteristics: Mechanistic evaluation. Transportation Research Record: Journal of the Transportation Research Board, 1832(1), 1–8. https://doi.org/10.3141/1832-01
- Kim, Y. S., Sigwarth, T., Büchner, J., & Wistuba, M. P. (2021). Accelerated dynamic shear rheometer fatigue test for investigating asphalt mastic. Road Materials and Pavement Design, 22(sup1), S383–S396. https://doi.org/10.1080/14680629.2021.1911832
- Lesueur, D., Petit, J., & Ritter, H. (2012). The mechanisms of hydrated lime modification of asphalt mixtures: A state-of-the-art review. Road Materials and Pavement Design, 14, 1–16. https://doi.org/10.1080/14680629.2012.743669
- Lesueur, D., Teixeira, A., Lazaro, M. M., Andaluz, D., & Ruiz, A. (2016). A simple test method in order to assess the effect of mineral fillers on bitumen ageing. Construction and Building Materials, 117, 182–189. https://doi.org/10.1016/j.conbuildmat.2016.05.003
- Li, Q., Chen, X., Li, G., & Zhang, S. (2018). Fatigue resistance investigation of warm-mix recycled asphalt binder, mastic, and fine aggregate matrix. Fatigue & Fracture of Engineering Materials & Structures, 41(2), 400–411. https://doi.org/10.1111/ffe.12692
- Liao, M.-C., Chen, J.-S., & Tsou, K.-W. (2012). Fatigue characteristics of bitumen-filler mastics and asphalt mixtures. Journal of Materials in Civil Engineering, 24(7), 916–923. https://doi.org/10.1061/(ASCE)MT.1943-5533.0000450
- Mazzoni, G., Virgili, A., & Canestrari, F. (2019). Influence of different fillers and SBS modified bituminous blends on fatigue, self-healing and thixotropic performance of mastics. Road Materials and Pavement Design, 20(3), 656–670. https://doi.org/10.1080/14680629.2017.1417150
- Micaelo, R., Guerra, A., Quaresma, L., & Cidade, M. (2017). Study of the effect of filler on the fatigue behaviour of bitumen-filler mastics under DSR testing. Construction and Building Materials, 155, 228–238. https://doi.org/10.1016/j.conbuildmat.2017.08.066
- Miro, R., Martinez, A. H., Perez-Jimenez, F. E., Botella, R., & Alvarez, A. (2017). Effect of filler nature and content on the bituminous mastic behaviour under cyclic loads. Construction and Building Materials, 132, 33–42. https://doi.org/10.1016/j.conbuildmat.2016.11.114
- Nielsen, M. E., & Fisk, M. R. (2010). Surface area measurements of marine basalts: Implications for the subseafloor microbial biomass. Geophysical Research Letters, 37(15), 1–5. https://doi.org/10.1029/2010GL044074
- Roberto, A., Romeo, E., Montepara, A., & Roncella, R. (2018). Effect of fillers and their fractional voids on fundamental fracture properties of asphalt mixtures and mastics. Road Materials and Pavement Design, 21(1), 25–41. https://doi.org/10.1080/14680629.2018.1475297
- Rochlani, M., Leischner, S., Falla, G. C., Wang, D., Caro, S., & Wellner, F. (2019). Influence of filler properties on the rheological, cryogenic, fatigue and rutting performance of mastics. Construction and Building Materials, 227, 116974. https://doi.org/10.1016/j.conbuildmat.2019.116974
- Steineder, M., Peyer, M., Hofko, B., Chaudhary, M., Saboo, N., & Gupta, A. (2022). Comparing different fatigue test methods at asphalt mastic level. Materials and Structures, 55(132), 1–16. https://doi.org/10.1617/s11527-022-01970-4
- Wang, D., Wang, L., & Zhou, G. (2012). Fatigue of asphalt binder, mastic and mixture at low temperature. Frontiers of Structural and Civil Engineering, 6(2), 166–175. https://doi.org/10.1007/s11709-012-0157-7
- Xing, B., Fan, W., Han, L., Zhuang, C., Qian, C., & Lv, X. (2020). Effects of filler particle size and ageing on the fatigue behaviour of bituminous mastics. Construction and Building Materials, 230, 117052. https://doi.org/10.1016/j.conbuildmat.2019.117052
- Xing, C., Liu, L., & Sheng, J. (2020). A new progressed mastic aging method and effect of fillers on SBS modified bitumen aging. Construction and Building Materials, 238, 117732. https://doi.org/10.1016/j.conbuildmat.2019.117732