
 ?Mathematical formulae have been encoded as MathML and are displayed in this HTML version using MathJax in order to improve their display. Uncheck the box to turn MathJax off. This feature requires Javascript. Click on a formula to zoom.
Abstract
Permanent deformation is one of the failure modes considered in the analysis and design of flexible pavements. ERAPave performance prediction (PP) which is a mechanistic empirical (ME) pavement design tool utilises two distinct models for the prediction of permanent deformation in the bound and unbound granular layers including subgrade. This paper aims to calibrate these models using pavement response and performance data from accelerated pavement testing (APT) structures. Material properties such as layer modulus were established through an optimisation that involves both falling weight deflectometer (FWD) and pavement response measurements. Based on the predicted performance results, a separate set of calibration was performed for permanent deformation development in moist and wet moisture conditions. The calibrated models have resulted in predictions that are in good agreement with observed performances. Furthermore, the model parameters successfully captured the initial densification behaviour and the associated sensitivity with axle load level.
Introduction
Permanent deformation is one of the primary failure modes considered in the analysis and design of flexible pavements. All the layers in a flexible pavement structure exhibit permanent deformation and contribute to the total observed surface rutting. This failure mode has been recognised and addressed in pavement performance prediction tools such as Pavement ME, CalME and ERAPave PP, among others (Ahmed & Erlingsson, Citation2013; ARA Inc., Citation2004; Ullidtz et al., Citation2008). Several distinct and unique models are currently available for the prediction of permanent deformation in the asphalt concrete (AC) layer, unbound granular material (UGM) layers and subgrade (ARA Inc., Citation2004; Erlingsson & Rahman, Citation2013b; Huang et al., Citation2021; Kenis & Wang, Citation1997; Korkiala-Tanttu, Citation2009; Rahman et al., Citation2022; Tseng & Lytton, Citation1989). These models were developed using failure mechanisms and material behaviour characterisations that are appropriate for different analysis conditions. In addition, the models are expected to provide accurate predictions while capturing the non-linear behaviour of the materials and the constant variation in traffic and environmental conditions (Tutumluer, Citation2013). As most of these models are semi-empirical in nature, a continuous evaluation and assessment of the models for circumstances that are different from the original conditions upon which they were developed is required.
For the prediction of permanent deformation in flexible pavements, ERAPave PP employs the layer strain approach with unique predictive models for each layer of the pavement structure (Barksdale, Citation1972). The model developed by ARA Inc. (Citation2004) for Pavement ME was adopted for the bound layers while a strain-based model that was recently developed by Rahman et al. (Citation2022) was used for the unbound layers and subgrade. These models have been observed in delivering satisfactory and reliable results for laboratory mixtures and accelerated pavement testing (APT) sections (Ahmed & Erlingsson, Citation2015; Dinegdae & Erlingsson, Citation2020; Rahman & Erlingsson, Citation2015). Nevertheless, as reported by Schwartz et al. (Citation2011), semi-empirical models can exhibit no or low sensitivity to changes in the analysis condition and as such require a comprehensive evaluation and calibration to fully assess their capability and sensitivity. These evaluations are crucial as the predictions from these models control not only the construction phase of the pavement structure but also govern the maintenance strategy that will be implemented during the service life of the pavement. This would consequently have a significant impact on the estimated overall life cycle cost (Santos & Ferreira, Citation2013).
Empirical models require a thorough calibration and validation before implementation for actual use. This is intended to guarantee that the models fully account for the various pavement design conditions that exist in practice. Pavement sections are generally designed and constructed for a service life of 20 years, making it very difficult to obtain relevant performance data in a timely manner. APT using heavy vehicle simulator (HVS) can be used instead to compensate for the lack of data from actual in-service pavement sections (Gungor et al., Citation2020; Laurent-Matamoros et al., Citation2020; Stache & Gonzalez, Citation2020). APT can be an excellent alternative for the evaluation of pavement performance predictive models as it provides performance data in a short period of time while modelling a full pavement structure with realistic traffic and environmental conditions (Al-Qadi & Wang, Citation2012; Ávila-Esquivel et al., Citation2020; Chazallon et al., Citation2009; Harvey & Popescu, Citation2000). APT using HVS is conducted in a controlled environment, where environmental conditions and traffic factors are continuously monitored and measured. In addition, it allows for the continuous measurement of pavement responses such as strains, stress, and deflections along with applied traffic volume, allowing the characterisation and modelling of key material properties and pavement behaviour. The use of APT is very convenient for controlling the level of variability associated with inputs such as layer modulus and thickness. This allows measured pavement response and performance to reflect accurately the actual material behaviour and failure mechanism (Louw et al., Citation2020). APT can also be employed to establish the sensitivity of pavement response and performance towards factors such as moisture, axle load, tire inflation pressure and other important inputs (Erlingsson, Citation2010; Fladvad & Erlingsson, Citation2022a; Meroni et al., Citation2020; Saevarsdottir & Erlingsson, Citation2013).
Objectives
The main objective of this paper is to evaluate and calibrate the models that are incorporated in ERAPave PP for the prediction of permanent deformation in the AC layer, unbound granular material (UGM) layers and subgrade. Furthermore, the study investigates the impact of factors such as axle load level and moisture content on the rate and overall evolution of permanent deformation. For this purpose, several APT structures that were tested using HVS and which are representative of actual in-service conditions were used. The APT sections were originally constructed and tested to study the influence of factors such as load level, moisture content, mixture type, traffic volume and structural layout on the permanent deformation behaviour of flexible pavements. The calibration of the models using these sections allows the models to incorporate and capture the influence of these factors on predicted results. The material properties used in the performance predictions were obtained through an optimisation that involve both falling weight deflectometer (FWD) and pavement response measurements. The calibration of the predictive models was achieved by carefully examining the correlation between the predicted and measured values of each layer. For this, model coefficients that are unique for each layer and analysis condition were established and incorporated into the models.
ERAPave PP
The ERAPave PP tool, which employs a mechanistic-empirical design approach for the prediction of distresses in flexible pavements, is currently under consideration by the Swedish and Norwegian Transport Administrations as a possible successor to existing pavement design methods. ERAPave PP primarily optimises pavement sections for fatigue cracking and permanent deformation performances. It can also be used to analyse pavement structures for conditions that are typical of cold climate such as frost heave and studded tires wear. The tool has so far been implemented for the performance evaluation of a number of asphalt mixtures, unbound granular materials (UGMs) and APT sections, and was observed in delivering results that are generally satisfactory and acceptable (Ahmed & Erlingsson, Citation2013; Fladvad & Erlingsson, Citation2022b; Saevarsdottir & Erlingsson, Citation2015).
Figure presents the flowchart of ERAPave PP. ERAPave PP, as can be seen in Figure , consists of two components: a mechanistic-based pavement response analysis and an empirically calibrated performance predictive model. A multi-layered linear elastic theory (MLET) based analysis is utilised for pavement response prediction, which is in essence the determination of the field variables (i. e., strain, stress, and deflection) for the prevailing environmental and traffic conditions (Erlingsson & Ahmed, Citation2013a; Huang, Citation2004). The calibrated model component, on the other hand, computes the design life of the pavement.
Figure 1. ERAPave PP flow chart.
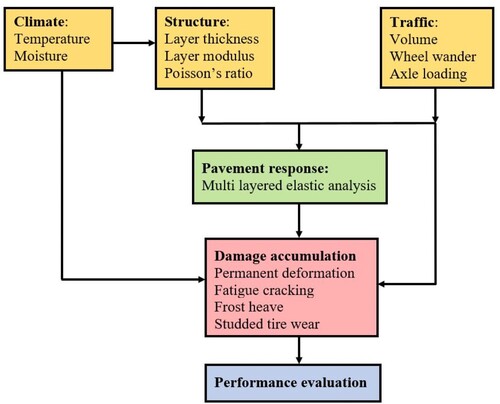
Flexible pavement structures are made of layers that are unique in their material make up. This makes it practically impossible to formulate a unique mathematical equation that can capture the permanent deformation behaviour of the whole flexible pavement structure. To overcome this problem, ERAPave PP in similar fashion as other mechanistic-empirical pavement design tools employs the layer stain approach for the estimation of permanent deformation. This approach determines the total observed surface rut depth by adding together the permanent deformation exhibited by each layer of the pavement structure. For predicting the permanent deformation of each layer, the approach uses models that take into account the respective material properties of each layer (Barksdale, Citation1972). The mathematical formulation of the (Barksdale, Citation1972) approach is presented in Equation Equation1(1)
(1) . In the equation, the total rut depth (RDtot) is calculated by integrating the permanent deformation (εp) exhibited by an infinitesimal element (dz) over the specified lower and upper limits. In the case when the pavement structure is divided into a number of sublayers (n) with depth (Δzi), the total rut depth is calculated by adding together the permanent deformation (εp,i) exhibited by each sublayer.
(1)
(1) For computing the evolution of permanent deformation in each layer of the pavement structure, ERAPave PP employs a strain hardening approach that considers the stress history of the material (Erlingsson & Rahman, Citation2013b; Lytton et al., Citation1993).
Permanent deformation modelling in asphalt concrete
The permanent deformation behaviour of the AC layer is affected by factors such as temperature, binder type and content, loading rate and aggregate gradation. Factors such as traffic volume, tire pressure and axle load level are also observed in increasing the propensity of the asphalt mixture towards permanent deformation failure (Kim, Citation2009). For the prediction of permanent deformation in the AC layer, ERAPave PP adopts the model that was originally developed for Pavement ME (ARA Inc., Citation2004). Equation (2) presents the mathematical formulation of this model. The model captures the permanent deformation behaviour of AC layers through factors such as traffic volume (N), temperature (T) and applied load level.
(2)
(2) where εr and εp are resilient and accumulated permanent strains, respectively, while a, b, and c are model coefficients.
Permanent deformation modelling in unbound granular materials
UGM layers are highly susceptible to failures related to permanent deformation or rutting (Epps et al., Citation2014). Several models that are suitable for various analysis conditions are currently available for the prediction of permanent deformation in UGM layers and subgrade (Korkiala-Tanttu, Citation2009; Rahman & Erlingsson, Citation2015; Tseng & Lytton, Citation1989). These models attempt with the implementation of various theories and assumptions to capture the permanent deformation behaviour of the material, which is primarily governed by factors such as number of load applications, stress level, stress history, moisture content and aggregate gradation (Erlingsson, Citation2010; Lekarp & Dawson, Citation1998). For the prediction of permanent deformation in UGM layers and subgrade, ERAPave PP employs a strain-based model that was recently developed by Rahman et al. (Citation2022). The model was developed using data that was obtained from a multi-stage repeated load triaxial (MS-RLT) test and considers resilient strain (εr) and number of applied traffic cycles (N) as inputs. A time-hardening approach is utilised in the model to take into account the stress-history behaviour of UGMs, which is induced as a result of either lateral wheel wander or change in axle load level (Rahman et al., Citation2022). Equation Equation3(3)
(3) presents the mathematical formulation of the model.
(3)
(3) where εp is accumulated permanent strain while a, b, and c are model coefficients.
Experimental plan
Accelerated pavement testing
The Swedish Road and Transport Research Institute (VTI) employs APT for the performance evaluation of pavement structures for various analysis and design conditions. Traffic loading is simulated using a mobile HVS (Mark IV), which is capable of applying different load levels and wheel configurations while moving bi-directionally at a speed of 12 km/h (Wiman & Erlingsson, Citation2008). In most testing, three phases of traffic loadings with distinct unique features are applied. In the first phase, for post compacting the structure, traffic loadings of different magnitude in terms of load level and tire inflation pressure are applied. A total of around 20,000 cycles of loading are expected during this phase. In the second phase, for pavement response measurement, the structure is subjected on average between 2000 and 3000 cycles of loadings with different magnitudes. In the third stage, which is referred as the main accelerated loading phase, the traffic loading of interest is applied. Depending on the purpose of the testing, the structure is subjected to various combinations of traffic loadings. For the traffic application, a dual wheel single axle with rubber tires of type 295/80R22.5 is mainly used. Traffic wander or the application of the traffic in lateral directions is simulated during this phase, which is usually limited to a maximum distance of 25 cm in either direction. The traffic wander locations, which are discreet points with a 5 cm gap, are mainly determined using a normal distribution. This approach was adopted as field measurements of wheel wander closely resemble a normal distribution (Erlingsson et al., Citation2012).
The APT facility at VTI is an insulated system where environmental factors such as temperature and moisture are fully controlled and continuously measured. In addition, pavement test structures are instrumented with various sensors, gauges and laser beams for the measurement of the field variables and surface rutting. The type, number and location of the sensors and gauges is dependent on factors such as the type of testing performed and the required level of accuracy and precision. For guaranteeing the accuracy and repeatability of the measurements, multiple gauges and sensors are provided. It is customary to perform a thorough evaluation and calibration of the instruments before any testing commences. The data acquisition system is also assessed on regular basis to improve the accuracy and reliability of the measured data. More information regarding the instrumentation and the testing procedure can be obtained from the following articles: Erlingsson (Citation2010), Ahmed and Erlingsson (Citation2013) and Saevarsdottir et al. (Citation2016).
Pavement sections
The evaluation and calibration of the models was achieved using five APT structures. These sections represent design features that are representative of Swedish in-service conditions. The evaluation and calibration of the models using these APT sections, which were originally constructed to study the influence of various factors on pavement performance, will allow the models to capture satisfactorily and reliably the design features that exist in practice. The construction of the sections was carried out using workmanships, techniques and equipment that are typically employed for the construction of actual field pavement sections. Extra efforts were also made during construction to reduce variability and structural flaws. A schematic representation of the sections is presented in Figure .
Figure 2. Schematic representation of the APT structures with a cross section view of the installed instruments.
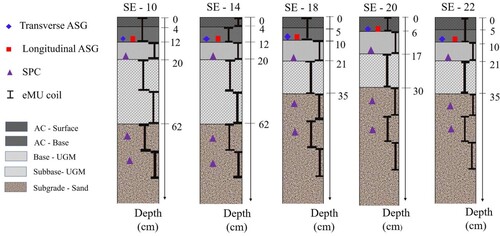
The APT sections used in this study, as can be seen in Figure , were all embedded with sensors and gauges of various kinds. Instrumentation was provided in the longitudinal direction, along the main loading path or centre line of the road. For the whole testing period, the instruments provided a continuous measurement of the field variables and the environmental factors such as moisture and temperature. The field variables included the horizontal strains at the bottom of the AC layer, the vertical pressures at different locations within the UGM layers and subgrade, and the vertical strains along full depth. Accordingly, longitudinal, and transverse asphalt strain gauges (ASG), soil pressure cells (SPC), vertical strain gauges (eMU coils) and temperature and moisture measuring sensors were installed at locations of interest. For each variable of interest, a multiple set of gauges and sensors were installed.
The development and accumulation of surface rutting with traffic cycle repetitions was measured at five different locations along the longitudinal path. The measurements cover the full transverse direction and can be used to identify defects and flaws in the pavement structure. In addition, surface elevation measurements that characterise the homogeneity of the structural thickness and falling weigh deflectometer (FWD) measurements that assess the integrity of the pavement structure were performed on regular intervals. The FWD measurements were conducted before, during and after the main accelerated loading testing phase, providing valuable insights into damage accumulation.
The layer thickness and applied axle loading of the studied APT sections is provided in Table . As can be seen in Figure and Table , the studied APT sections comprise structures of various layouts with mixtures and thickness dimensions that are appropriate for various analysis conditions. Furthermore, during testing, the sections were subjected to traffic conditions that comprise axle loads of different magnitudes and volumes. All the sections except SE-10 were tested at a constant pavement temperature of 10°C and at a moisture condition that represent a ‘moist’ state in all the UGM layers and subgrade. However, for SE-10, after the structure was subjected to almost half of the expected traffic volume, the moisture level in the subgrade was changed from ‘moist’ to ‘wet’ condition by raising the ground water level.
Table 1. Layer thickness and applied loading of the studied structures.
Results and discussion
Falling weight deflectometer measurements
For each APT section, the modulus of each individual layer was determined through a back calculation that involves an average of several FWD measurements and a MLET based analysis tool (Irwin, Citation2002). The estimation of each layer mechanical property using average FWD measurements allows estimated moduli to capture the variability associated with each layer. In addition, the backcalculation analyses were performed considering the expected bearing capacity of each layer material constituent, allowing predicted pavement response and performance to reflect the actual pavement condition. This is achieved by bounding the modulus of each layer with an upper and lower limit moduli value. Table presents for each impact load the root mean squared error (RMSE) of the estimated backcalculated deflections.
Table 2. RMSE of backcalculated deflections.
As can be seen in Table , the RMSE of SE-14 and SE-18 backcalculated deflections are lower than sections SE-20 and SE-22. The FWD measurements of the four sections, SE-14, SE-18, SE-20 and SE-22 were carried out at constant moisture conditions and at pavement temperatures of 14°C, 11°C, 22°C and 20°C, respectively. The higher RMSE observed for sections SE-20 and SE-22 might be due to the higher testing temperatures. At higher temperatures, the viscoelastic behaviour of the AC layer will be more pronounced and using a MLET based analysis might introduce a discrepancy between measured and backcalculated deflections. It can also be seen in Table that for most sections as the impact load increases the RMSE also increases. This is mainly due to the fact that higher impact loads induce higher deflections which in turn increase in most likelihood the difference between observed and backcalculated values.
RMSE values were also computed for section SE-10 using FWD measurements that were carried out ‘before’ and ‘after’ the moisture condition in the subgrade was altered. The ‘before’ FWD testing was conducted at a moisture condition in the UGM layers and subgrade that represent a ‘moist’ state, representing a state where the ground water table is at a greater depth. The ‘after’ FWD testing was conducted after the ground water table was raised to a level which was 30 cm below the surface of the subgrade, altering the moisture content for most of the subgrade material from ‘moist’ to ‘wet’ condition. As can be seen in Table , the RMSE values for both cases are relatively lower. As the testing temperature for the ‘before’ and ‘after’ testing were 12°C and 9°C, respectively, this allowed the MLET based analysis to capture the actual behaviour of the pavement structure for both moisture conditions.
The material properties obtained from the FWD testing needed to be adjusted so as to reflect the analysis conditions of the APT structures. The FWD measurements and the APT testing were conducted utilising different loading rates and in some instances at different temperatures, requiring a two-level adjustment. The temperature difference adjustment was performed using the procedure which was originally proposed by Kim et al. (Citation1995) for correcting moduli to a reference temperature. The adjustment for the loading rate difference between the FWD and APT measurements were performed using the full- depth vertical strain response. Table presents the optimised moduli of each layer after temperature and loading rate difference adjustments.
Table 3. Layer’s properties after temperature and loading rate adjustments.
The two-level adjustment has reduced the FWD back-calculated AC stiffness by a substantial margin while the effect on the moduli of the UGM layers was insignificant. As a viscoelastic material, it is expected that a change in testing temperature and loading rate will affect more the AC layer than the UGM layers or subgrade. For SE-10, the AC stiffness exhibited a further reduction in value after the moisture condition in the subgrade was changed from moist to wet condition. As testing was paused for 30 days after the ground water table was raised, it is expected that through capillary action and moisture migration the moisture condition in the base and subbase layers to be affected as well.
Pavement response comparisons
Pavement responses at different locations within the pavement structure were calculated and compared with the corresponding measured values to further validate the optimised material properties. Pavement response was calculated using a dual wheel single axle configuration with an axle load magnitudes of 80 and 100 kN, which were the primary loadings for most of the structures during the main accelerated loading phase. The loadings were applied using tire inflation pressure of 800 kPa. Variables of interest were the full depth vertical strain, the horizontal strains at the bottom of the AC layer and the vertical stresses at different locations within the unbound layers and subgrade.
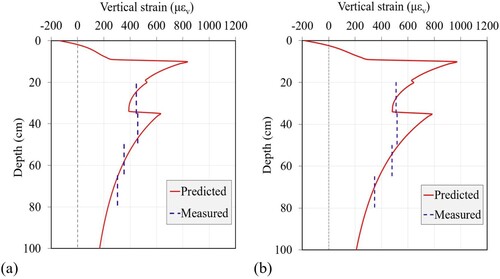
The response comparison was performed for all the sections listed in Table and shown in Figure , resulting in comparisons that are generally acceptable. For illustrating and presenting the comparison between the measured and predicted responses, section SE-18 was selected. Accordingly, Figure presents the comparison between the full-depth measured and predicted vertical strains for SE-18. As can be seen in Figure , for both axle loads and for the depths under consideration, a good agreement between the measured and predicted responses was observed. The vertical strains in the asphalt and base layers were omitted from the comparison as those measurements were characterised by a considerable amount of noise.
Figure 3. Comparison between predicted and measured vertical strains for single axle loads of (a) 80 kN and (b) 100 kN.
A close-up comparison using time-series values was also performed between the predicted and measured vertical strains. Figure presents the comparison between the two values for single axle loads of 80 and 100 kN. Figure (a), (c) and (e) present the comparison for 80 kN load while Figure (b), (d) and (f) present the comparison for 100 kN. The comparison includes measurements that were taken at upper and lower parts of subbase and upper part of subgrade. For all the cases considered, a good agreement between the two values was observed. Generally, the quality of measured values was fairly high, but in some instances noisy, requiring an approximation using the moving average approach. To further examine the relationship between the two values, a close examination of the results was performed using statistical tools such as the coefficient of determination (R2) and the one-way analysis of variance (ANOVA). For all the considered cases, the ANOVA analyses have shown that there is no statistically significant difference between the two values. For the R2 analysis, values in the range of 0.70–0.99 were obtained. The lowest R2 value was obtained for the comparison in Figure (a) while the highest was attained for the comparison in Figure (e).
Figure 4. Comparison between predicted and measured vertical strains for depth ranges of [21–35] cm (a) and (b); [35–50] cm (c) and (d) and [50–65] cm (e) and (f).
![Figure 4. Comparison between predicted and measured vertical strains for depth ranges of [21–35] cm (a) and (b); [35–50] cm (c) and (d) and [50–65] cm (e) and (f).](/cms/asset/1e58f140-65cf-4430-83da-737d466dc663/trmp_a_2191733_f0004_oc.jpg)
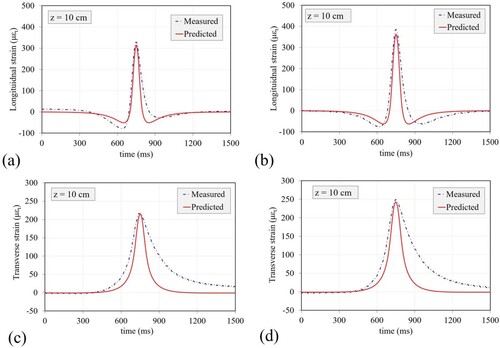
Responses such as horizontal strains at the bottom of the AC layer and vertical stresses in the UGM layers were used to further validate the optimised material properties. The horizontal strain measurements were taken at a pavement temperature of 10°C. Figure compares for SE-18 the predicted and measured longitudinal and transverse strains at the bottom of the AC layer. Figure (a) and (c) present the comparison for 80 kN load while Figure (b) and (d) present the comparison for 100 kN. For both loading cases, a good agreement between the measured and predicted longitudinal strains was observed. A statistical analysis using R2 results values that are in the range of 0.73–0.83. The R2 results have shown that predicted longitudinal strains fit observed values better than predicted transverse strains. This is further corroborated by the ANOVA results where a statistically significant difference between predicted and observed transvers strains was observed. This discrepancy might be due to the viscoelastic nature of the AC layer.
Figure 5. Comparison between predicted and measured horizontal strains at the bottom of the AC layer (a) and (b) longitudinal and (c) and (d) transvers.
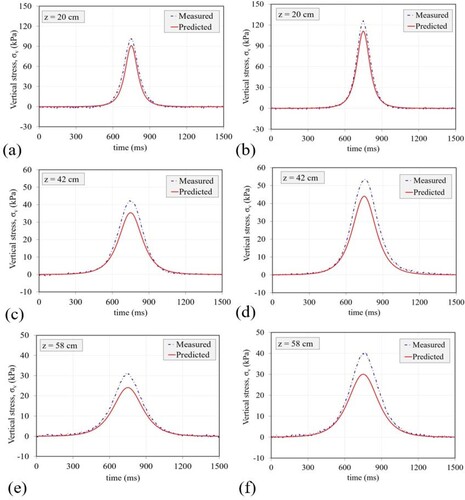
For the vertical stress comparison, measurements taken at the bottom of the base layer and at different locations within the subgrade were used. Figure presents for SE-18 the comparison between the predicted and measured vertical stress values. Figure (a), (c) and (e) present the comparison for 80 kN load while Figure (b), (d) and (f) present the comparison for 100 kN. For measurements taken at the bottom of the base layer, as can be seen in Figure (a) and (b), a good agreement between the two values were observed. For measurements taken in the subgrade, there was a discrepancy between the two values, especially in the lower part of the subgrade. Even if some of the comparisons exhibit discrepancies that can easily be noticed visually, the R2 analyses results values that are in the range of 0.92–0.98. The lower R2 values correspond for comparisons depicted in Figure (d), (e) and (f). For all the cases, the ANOVA results have also shown that there is no statistically significant difference between the two values. Moving average values were used for some measurements as the data featured some noise.
Figure 6. Comparison between predicted and measured vertical stresses at a depth of 20 cm (a) and (b); 42 cm (c) and (d) and 58 cm (e) and (f).
Material properties are expected to remain unaffected during APT testing as environmental factors such as temperature and moisture are closely monitored. Nevertheless, the repeated application of traffic loading is expected to deteriorate the structural integrity of the pavement structure. This deterioration in material properties should be considered in the estimation of layer properties. It has been observed that, measured responses of the APT sections show a slight increase in value as number of repetitions increase.
Model calibration
The calibration of the models was achieved by matching as closely as possible the predicted permanent deformation curves with the corresponding observed values. Model parameters that were initially established through engineering judgement and experience were experimented with for establishing the unique optimised model values. For the strain-based model, model parameters that are unique for each layer and which distinguish between moist and wet moisture conditions were established. Table presents the optimised model parameters. Theses parameters are expected to deliver reasonable and acceptable permanent deformation predictions while accounting for the various design features that exist in practice.
Table 4. Optimised model parameters.
The optimised model parameters for the ARA Inc. (Citation2004) predictive model are nearly identical to the ones obtained by Ahmed and Erlingsson (Citation2015). This shows the effectiveness and robustness of the ARA Inc. (Citation2004) model for the prediction of permanent deformation in the AC layer. For the strain based UGM model, it can be assumed that the model coefficients ‘a’ and ‘b’ define the moisture sensitivity and the strain tolerance level of each layer, respectively. The strain tolerance level is the amount of strain a layer is subjected to as defined by its distance from the load application point. These assumptions are made based on observations of the model calibration result. From Table , it can be seen that model parameter ‘a’ has the same value for all the layers except for the wet moisture condition in the subgrade. Parameter ‘b’, on the other hand, has different values for each layer and for the subgrade its value remains unchanged irrespective of the moisture condition in the subgrade. The same has also been observed during a MS-RLT testing of UGMs. It was also observed that the model coefficient ‘c’ might be a redundant parameter as its influence on predicted performance is insignificant. The lack of an exponential term associated with the resilient strain parameter has greatly facilitated the calibration process of the strain based UGM model. As a result, the model is more sensitive to changes in the analysis condition such as moisture and axle load level when compared with other similar models.
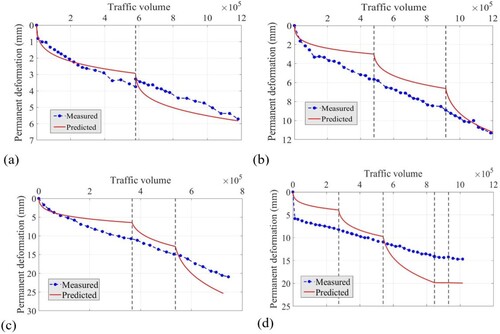
The calibrated models were used to compute the permanent deformation performance of each APT section. Figure presents the comparison between the predicted and observed total surface permanent deformations for sections SE-14, SE-18, SE-20, and SE-22. As can be seen in the figure, for all the sections considered, there is a good agreement between the two values. A statistical analysis using ANOVA has shown that for the comparisons depicted in Figure there is no statistically significant difference between the two values. Nevertheless, for section SE-22, the comparison between predicted and observed rut-depths which is depicted in Figure (d) resulted in a value of R2 that is less than 0.5. The results are a confirmation to the ability of the optimised model parameters as these sections have different structural profiles and also during testing were subjected to different traffic volumes and loadings. A closer look at each section permanent deformation prediction reveals that the predictions have managed to capture the expected trend in permanent deformation evolution with a clear distinction between primary and secondary stages. In addition, the predictions have managed to systematically distinguish between different load levels with higher load levels causing a faster accumulation of permanent deformation. In the case when a lower axle load is applied after a higher axle load, as can be seen in Figure (d), the change in permanent deformation is minimal. It should also be mentioned that some measurements like the one depicted in Figure (d) have exhibited some anomalies that cannot be explained by traditional permanent deformation failure mechanisms. This is the main reason why the optimised model parameters failed to deliver predictions that are in good agreement with measured values. Post compaction has been cited as a possible cause, but issues related to instrument installation and calibration, and human error cannot be ruled out as well.
Figure 7. Comparison between predicted and measured permanent deformations for (a) SE-14, (b) SE-18, (c) SE-20 and (d) SE-22. The dashed vertical lines indicate change in axle load levels.
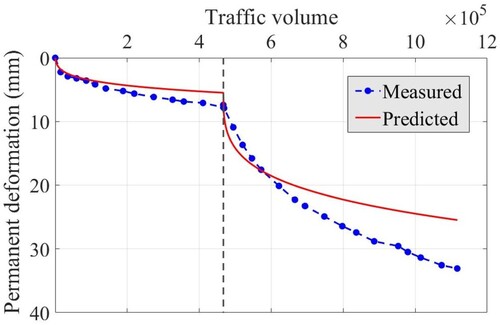
For section SE10, the permanent deformation accumulation in the subgrade was calculated using the moisture sensitive model parameters. Figure presents the comparison between the predicted and observed surface deformation values. As the case with the other APT sections, a generally good agreement between the two values was observed. For both ‘moist’ and ‘wet’ moisture conditions, a statistical analyses using ANOVA have also shown that there is no statistically significant difference between the two values. For the R2 analyses, satisfactory R2 values of 0.65 and 0.72 are obtained for the ‘moist’ and ‘wet’ moisture conditions, respectively. Furthermore, as can be seen in Figure , the prediction has managed to capture the moisture sensitivity of the structure, especially the behaviour expected during the primary stage. The two values, however, diverge during the secondary stage of the evolution where the prediction increases at a steady rate while the measured rutting increases without any substantial loss of rate.
Figure 8. Comparison between predicted and measured permanent deformations for SE-10. The dashed vertical line indicates change in moisture content.
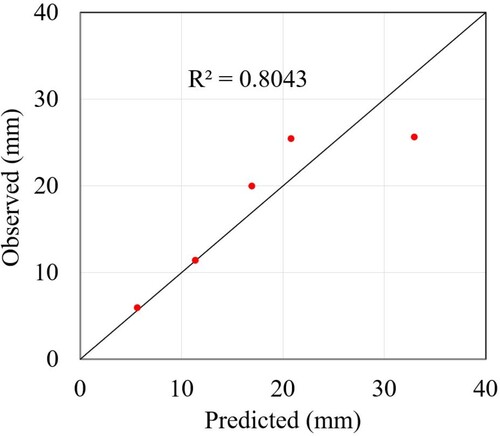
Pavement design tools are primarily tasked with determining the total accumulated permanent deformation at the end of the design period. A comparison between the total measured and predicted permanent deformation values at the end of the analysis period was performed for the studied five APT sections. The measured values represent average surface rut depths. These rut depths are obtained by averaging five measurements that are taken at different locations along the longitudinal direction. Figure presents the comparison between these two values. As can be seen in Figure , there is a good agreement between the measured and predicted values, which is further supported by the computed coefficient of determination, R2.
Figure 9. Comparison between predicted and observed total surface rutting.
Conclusions and recommendations
This paper presents a preliminary calibration of the models that are incorporated in ERAPave PP tool for the prediction of permanent deformation in the AC layer, UGM layers and subgrade. The preliminary calibration was achieved using pavement response and performance data from APT sections that are representative of actual field conditions. The determination of each layer’s mechanical property by optimising both FWD measurements and pavement responses have resulted in values that reflect actual pavement conditions. The good agreement between predicted and observed responses is also a good indication that the determined mechanical properties have captured the actual pavement behaviour for the prevailing traffic and environmental conditions. This also demonstrates the effectiveness of APT in providing response values that are precise and accurate when proper construction, instrumentation, and testing are employed.
The use of unique model parameters for each layer of the pavement structure allows the establishment of each layer permanent deformation contribution to the total observed surface rut depth. The optimised model parameters were observed in delivering permanent deformations that are generally in good agreement with corresponding measured values. The model parameters have also been observed in capturing the primary and secondary stages of permanent deformation development and evolution. In addition, the model parameters were observed to be sensitive enough to factors such as moisture level and axle load level. Nevertheless, the model parameters have failed to capture accurately the rate of evolution in permanent deformation when there is a change in axle load level or moisture condition.
Even if the preliminary calibration results are promising, further investigations using either APT sections or actual in-service pavements are required in order to fully assess the capability and limitations of the models. When selecting pavement sections for future model calibration and validation, it is important to consider the various design features that exist in practice and the expected range in design inputs and factors. In addition, the quality of the data that is required for pavement response and performance calculation is important and as such, should be given a priority during the selection of prospective pavements.
Data accessibility statement
The data that support the findings of this study are available from the corresponding author, [Yared D.], upon reasonable request.
Disclosure statement
No potential conflict of interest was reported by the author(s).
Additional information
Funding
References
- Ahmed, A. W., & Erlingsson, S. (2013). Evaluation of permanent deformation models for unbound granular materials using accelerated pavement tests. Road Materials and Pavement Design, 14(1), 178–195. https://doi.org/10.1080/14680629.2012.755936
- Ahmed, A. W., & Erlingsson, S. (2015). Evaluation of a permanent deformation model for asphalt concrete mixtures using extra-large wheel-tracking and heavy vehicle simulator tests. Road Materials and Pavement Design, 16(1), 154–171. https://doi.org/10.1080/14680629.2014.987311
- Al-Qadi, I. L., & Wang, H. (2012). Impact of wide-base tires on pavements: Results from instrumentation measurements and modeling analysis. Transportation Research Record: Journal of the Transportation Research Board, 169–176. https://doi.org/10.3141/2304-19
- ARA Inc. (2004). Guide for the mechanistic-empirical design ofnew and rehabilitated pavement structures, final report (Tech. Rep. NCHRP 1-37A). Transportation Research Board of the National Academies. http://onlinepubs.trb.org/onlinepubs/archive/mepdg/guide.htm
- Ávila-Esquivel, T., Aguiar-Moya, J.P., Camacho-Garita, E., Loria-Salazar, L.G., (2020). Development and calibration of performance models based on APT data. In A. Chabot, P. Hornych, J. Harvey, & L. Loria-Salazar (Eds.), Accelerated pavement testing to transport infrastructure innovation. Lecture notes in civil engineering (Vol. 96). Springer. https://doi.org/10.1007/978-3-030-55236-7_38
- Barksdale, R. D. (1972). Laboratory evaluation of rutting in base course materials. In Presented at the 3rd International Conference on Structural Design of Asphalt Pavements (pp. 161–174).
- Chazallon, C., Koval, G., Hornych, P. Allou, F., & Mouhoubi, S. (2009). Modelling of rutting of two flexible pavements with the shakedown theory and the finite element method. Computers and Geotechnics, 36(5), 798–809. https://doi.org/10.1016/j.compgeo.2009.01.007
- Dinegdae, Y., & Erlingsson, S. (2020). Evaluation of permanent deformation models for flexible pavements using accelerated pavement testing. In A. in Chabot (Ed.), Accelerated pavement testing to transport infrastructure innovation (pp. 399–408). Springer International Publishing.
- Epps, J., Sebesta, S., Hewes, B., Sahin, H., Luo, R., Button, J., Lytton, R., Herrera, C.A., Hatcher, R., & Gu, F. (2014). Development of a specification for flexible base construction, (p. College Station, TX, 414: Final Rep. No. FHWA/TX-13/0-6621.
- Erlingsson, S. (2010). Impact of water on the response and performance of a pavement structure in an accelerated test. Road Materials and Pavement Design, 11(3), 863–880. https://doi.org/10.3166/rmpd.11.863-880
- Erlingsson, S., & Ahmed, A. W. (2013a). Fast layered elastic response program for the analysis of flexible pavement structures. Road Materials and Pavement Design, 14(1), 196–210. https://doi.org/10.1080/14680629.2012.757558
- Erlingsson, S., & Rahman, M. S. (2013b). ‘Evaluation of permanent deformation characteristics of unbound granular materials by means of multistage repeated-load triaxial tests’. Transportation Research Record: Journal of the Transportation Research Board, https://doi.org/10.3141/2369-02
- Erlingsson, S., Said, S. F., & McGarvey, T. (2012). Influence of heavy traffic lateral wander on pavement deterioration.’ In. Malmö, Sweden: Proceedings of the 4th European Pavement Asset Management Conference.
- Fladvad, M., & Erlingsson, S. (2022a). Modelling the response of large-size subbase materials tested under varying moisture conditions in a heavy vehicle simulator. Road Materials and Pavement Design, 1107–1128. https://doi.org/10.1080/14680629.2021.1883462
- Fladvad, M., & Erlingsson, S. (2022b). Permanent deformation modelling of large-size unbound pavement materials tested in a heavy vehicle simulator under different moisture conditions. Road Materials and Pavement Design, 23(5), 1157–1180. https://doi.org/10.1080/14680629.2021.1883464
- Gungor, O. E., Al-Qadi, I. L., & Garg, N. (2020). Bayesian calibration of ILLI-THERM for temperature prediction within airfield concrete pavement. In A. Chabot (Ed.), Accelerated pavement testing to transport infrastructure innovation (pp. 418–427). Springer International Publishing.
- Harvey, J., & Popescu, L. (2000). Accelerated pavement testing of rutting performance of two caltrans overlay strategies. Transportation Research Record: Journal of the Transportation Research Board, 116–125. https://doi.org/10.3141/1716-14
- Huang, K., Onifade, I., & Birgisson, B. (2021). Rutting performance of flexible pavements using new energy-based potentials. Construction and Building Materials, 266, 120896. https://doi.org/10.1016/j.conbuildmat.2020.120896
- Huang, Y. (2004). Pavement analysis and design (2nd ed.). Prentice Hall.
- Irwin, L. H. (2002). Backcalculation: An overview and perspective. In Pavement Evaluation Conference.
- Kenis, W., & Wang, W. (1997). Calibrating mechanistic flexible pavement rutting models from full scale accelerated tests. In Eighth International Conference on Asphalt Pavements Federal Highway Administration (No. Volume I).
- Kim, Y. (2009). Modeling of asphalt concrete. 1st ed. (Y. R. Kim Ed). McGraw-Hill Education. https://www.accessengineeringlibrary.com/content/book/9780071464628
- Kim, Y. R., Hibbs, B. O., & Lee, Y.-C. (1995). Temperature correction of deflections and backcalculated asphalt concrete moduli. Transportation Research Record, (1473), 55–62. http://onlinepubs.trb.org/Onlinepubs/trr/1995/1473/1473-007.pdf
- Korkiala-Tanttu, L. (2009). Verification of rutting calculation for unbound road materials. In Proceedings of the Institution of Civin Engineers, Transport (TR2) (pp. 107–114).
- Laurent-Matamoros, P., Avila-Esquivel, T., Camacho-Garita, E., Aguiar-Moya, J., & Loria-Salazar, L. G. (2020). Development of a distress prediction model based on deflection parameters. In A. Chabot, , P. HornychJ. Harvey, & L. G. Loria-Salazar (Eds.), Accelerated pavement testing to transport infrastructure innovation (pp. 428–437). Springer International Publishing.
- Lekarp, F., & Dawson, A. (1998). Modelling permanent deformation behaviour of unbound granular materials. Construction and Building Materials, 12(1), 9–18. https://doi.org/10.1016/S0950-0618(97)00078-0
- Louw, S., Jones, D., & Wu, R. (2020). Lessons learnt from accelerated pavement testing of full-depth recycled material stabilized with Portland cement. In A. Chabot (Ed.), Accelerated pavement testing to transport infrastructure innovation (pp. 309–318). Springer International Publishing.
- Lytton, R. L., Uzan, J., Fernando, E. G., Roque, R., Hiltunen, D., & Stoffels, S. M. (1993). Development and validation of performance prediction models and specifications for asphalt binders and paving mixes (Vol. 357). Strategic Highway Research Program.
- Meroni, F., Xue, W., Flintsch, G. W., & Diefenderfer, B. K. (2020). Impact of Mix design optimization on HMA rutting performance under accelerated pavement testing. In A. Chabot, P. Hornych, J. Harvey, & L. G. Loria-Salazar (Eds.), Accelerated pavement testing to transport infrastructure innovation (pp. 108–117). Springer International Publishing.
- Rahman, M. S., & Erlingsson, S. (2015). A model for predicting permanent deformation of unbound granular materials. Road Materials and Pavement Design, 16(3), 653–673. https://doi.org/10.1080/14680629.2015.1026382
- Rahman, M. S., Erlingsson, S., Ahmed, A., & Dinegdae, Y. (2022). A model for the permanent deformation behavior of the unbound layers of pavements. In Eleventh international conference on the bearing capacity of roads, railways and airfields (pp. 277).
- Saevarsdottir, T., & Erlingsson, S. (2013). Effect of moisture content on pavement behaviour in a heavy vehicle simulator test. Road Materials and Pavement Design, 14(sup1), 274–286. https://doi.org/10.1080/14680629.2013.774762
- Saevarsdottir, T., & Erlingsson, S. (2015). Modelling of responses and rutting profile of a flexible pavement structure in a heavy vehicle simulator test. Road Materials and Pavement Design, 16(1), 1–18. https://doi.org/10.1080/14680629.2014.939698
- Saevarsdottir, T., Erlingsson, S., & Carlsson, H. (2016). Instrumentation and performance modelling of heavy vehicle simulator tests. International Journal of Pavement Engineering, 17(2), 148–165. https://doi.org/10.1080/10298436.2014.972957
- Santos, J., & Ferreira, A. (2013). Life-cycle cost analysis system for pavement management at project level. International Journal of Pavement Engineering, 14(1), 71–84. https://doi.org/10.1080/10298436.2011.618535
- Schwartz, C., Li, R, Ceylan, H., Kim, S., & Gopalakrishnan, K. (2011). Sensitivity evaluation of MEPDG performance prediction. Final report of NCHRP 1-47 project.
- Stache, J. M., & Gonzalez, C. R. (2020). Use of heavy vehicle simulator-aircraft in the development of the CBR-beta procedure. In A. Chabot, P. Hornych, J. Harvey, & L. G. Loria-Salazar (Eds.), Accelerated pavement testing to transport infrastructure innovation (pp. 458–466). Springer International Publishing.
- Tseng, K.-H., & Lytton, R. L. (1989). Prediction of permanent deformation in flexible pavements materials, implication of aggregates in the design, construction, and performance of flexible pavements., In. West Conshohocken, PA: ASTM STP 1016, ASTM, 154–172.
- Tutumluer, E. (2013). Practices for unbound aggregate pavement layers. NCHRP Synthesis 445. Washington, DC.
- Ullidtz, P., Harvey, J., Tsai, B-W, & Monismith, C. L. (2008). Calibration of mechanistic-empirical models for flexible pavements using California heavy vehicle simulators. Transportation Research Record: Journal of the Transportation Research Board, (2087), 20–28. https://doi.org/10.3141/2087-03
- Wiman, L. G., & Erlingsson, S. (2008). Accelerated pavement testing by HVS a trans-national testing equipment. In. Ljubljana,21-24 April: Transport Research Arena Europe 2008 [CD ROM].