
 ?Mathematical formulae have been encoded as MathML and are displayed in this HTML version using MathJax in order to improve their display. Uncheck the box to turn MathJax off. This feature requires Javascript. Click on a formula to zoom.
Abstract
In this paper, the influence of particle-fluid density ratio and particle diameter on the turbulence modulation by finite-size particles in forced homogeneous isotropic turbulence is investigated. Results show that the presence of finite-size particles always attenuate the turbulence, and the attenuation is larger for particles with larger density when the particle diameter is fixed. But the attenuation is smaller for particles with larger diameter if the density is fixed, and the weaker attenuation is due to the wake fluctuation when the particle Reynolds number is large enough. The turbulence kinetic energy is attenuated at the large scales and augmented at the small scales. The radial dissipation profiles show that the region affected by the particles with same diameter is identical, but the dissipation near the particle surface is larger if the density is larger due to larger slip velocity and particle Reynolds number. For particles with same density, smaller particles have smaller dissipation near the particle surface but the influence region is larger, and the combined effect leads to the result that the contribution of dissipation in the influence region of smaller particles to the total dissipation is larger. The influence region mainly depends on the particle diameter.
1. Introduction
Turbulent particle-laden flows can be found in a variety of natural phenomena and industrial applications, such as warm rain formation [Citation1], sandstorm movement and fluidised bed [Citation2]. Early researches can be traced back to the 1950s and understanding the interaction between the particles and the carrier flow had been crucial to understand the natural phenomena and design industrial facilities. From these early studies, Crowe et al. [Citation3] concluded that the presence of particles can either enhance or attenuate the carrier phase turbulence depending on the ratio of particle diameter to the integral length scale of the turbulence. This simple indicator is obviously insufficient to predict the degree of turbulence modulation as a large number of parameters are involved in the particle-laden flow, such as particle diameter , particle Stokes number St, particle Reynolds number
, and particle–fluid density ratio. Much efforts were made to find the key parameters dominating the turbulence modulation afterwards. Most studies of turbulence modulation by particles usually concentrate on small particles with diameter (
) smaller than the Kolmogorov length scale (η). For example, Kulick et al. [Citation4] experimentally studied the turbulence modulation by particles smaller than the Kolmogorov length scale in a fully developed turbulent channel flow, and turbulence attenuation was found for all cases. The degree of attenuation increases with increasing St and mass loading. Paris [Citation5] extended the measurements of Kulick et al. [Citation4], and the effect of particle Reynolds number on turbulence modulation was investigated. It was found that the turbulence attenuation was more profound for particles with larger particle Reynolds number. Yang and Shy [Citation6] investigated the modulation by small settling particles in a nearly homogeneous isotropic turbulence (HIT). Turbulence augmentation was found in their study and was maximised around St = 1. They contributed the augmentation to the energy transfer from the potential energy of particles to the kinetic energy of the carrier flow.
In addition to the experiments, numerical methods are also frequently employed to investigate the turbulence modulation by the small particles as the whole-field flow information and particle information can be easily accessible in numerical simulation. For particles smaller than the Kolmogorov length scale (η), one of the important parameters is the Stokes number (St) defined as the ratio of particle relaxation time () and Kolmogorov time scale of the turbulence (
), and the point-particle method is extensively used for particles with
and
. Squires and Eaton [Citation7] investigated the turbulence modulation by small particles of different particle–fluid density ratio and mass loading in a forced HIT, and turbulence attenuation was observed for different cases. Li et al. [Citation8] numerically studied the experiments of Kulick et al. [Citation4] and found the same attenuation as in experiments. Elghobashi and Truesdell [Citation9] studied the two-way interaction between homogeneous decaying turbulence and small heavy particles with St of the order unity. The result revealed that the decaying rate of the turbulence kinetic energy was enhanced due to the presence of particles while the gravity was absent. Druzhinin and Elghobashi [Citation10] investigated the turbulence modulation in decaying turbulence by small inertial particles with
, and a reduction of the decaying rate of the turbulent kinetic energy (TKE) was found. Ferrante and Elghobashi [Citation11] systematically investigated the dependence of turbulence modulation by particles on St and found that there existed 'ghost particles' which did not modify the decaying rate of turbulent energy. A classification of turbulence modulation by small point particles using single parameter St can be found in Elgobashi [Citation12]. But this classification method was limited to a small range of particle volume fraction (
) and Stokes number (
), the particle diameter was also limited (
).
However, particles with diameter larger than the Kolmogorov length scale are unavoidably encountered in natural environment and industrial applications. The addition of finite-size particles results in stronger disturbance to the carrier flow, making the modulation mechanism more complicated. Tanaka and Eaton [Citation13] used the particle image velocimetry (PIV) system to study the turbulence modulation by finite-size particles in nearly HIT, and it was found that the TKE was reduced and the viscous dissipation rate was augmented near the particle surfaces. Bellani et al. [Citation14] experimentally studied the modulation by two types of neutrally buoyant particles, spherical and ellipsoidal, with size close to the Taylor microscale in HIT. It was found that both particles led to the attenuation of turbulence, but the attenuation of ellipsoidal particles was weaker. For experiments, it is difficult to resolve the flow field in the vicinity of the finite-size particles which is important to understand the flow modulation mechanism. Different numerical simulation methods have been developed to fully resolve the no-slip boundary between the particle–fluid interface and the flow around the finite-size particle surfaces. Comprehensive reviews of the fully resolved method can be found in the review papers of Tenneti and Subramaniam [Citation15] and Maxey [Citation16], and reference therein.
The fully resolved simulation method has been applied to a variety of turbulent flows, such as turbulent channel flow [Citation17–19], homogeneous shear turbulence [Citation20–22] and HIT [Citation23–32]. Pan and Banerjee [Citation17] studied the turbulence modulation in an open-channel by about 100 finite-size particles. Two types of particles, the fixed particles and freely moving particles, are investigated in their simulation. Strong turbulence enhancement near the wall region was found when particles were fixed on the wall, and they attributed the enhancement to the vortex shedding induced by particles. The freely moving particles resulted in much smaller modulation as the relative speed between particle and fluid was much smaller. Shao et al. [Citation18] investigated the effect of particle settling in their particle-laden channel flow. It was found that the heavy particles settled more on the wall and served as wall roughness. The vortex shedding generated by the particles near the wall transported to the core region of the channel and resulted in significant increase of turbulence intensity in the core region. Peng et al. [Citation19] studied the TKE balance in the particle-laden channel flow and found that the presence of particles decreased the TKE production but served as an additional TKE input source. The finite-size particles mainly increased the TKE input in the streamwise and vertical direction. Yousefi et al. [Citation22] investigated the turbulence modulation by finite-size particles in homogeneous shear turbulence. The influence of solid volume fraction was studied in their works, and it was found that the influence of volume fraction on the TKE was non-monotonic.
In addition to the different flow types mentioned above, HIT is an idealised turbulence model which eliminates the wall effect, mean flow or mean shear of the flow. A variety of researches investigating the turbulence modulation by finite-size particles, either in decaying HIT [Citation25,Citation27,Citation28,Citation30–33] or forced HIT [Citation23,Citation24,Citation26,Citation29,Citation30] can be found.
From these research works investigating the turbulence modulation by finite-size particles in HIT, several general findings can be obtained. First, the global TKE is always reduced with the presence of finite-size particles [Citation23,Citation25,Citation29–31], when point particles may enhance the turbulence in some situation. Ten cate et al. [Citation23] studied the turbulence modulation by finite-size particles in the forced HIT. It was found that the presence of particles enhanced the turbulence at small scales while suppressed the turbulence at the large scales, and the total modulation is attenuation. It was also found that the volume fraction played an important role in turbulence modulation which was not present in the point-particle simulations. Lucci et al. [Citation25] studied the temporal evolution of energy spectrum and TKE of particle-laden decaying HIT and found that the presence of particles always suppressed the turbulence. Lucci et al. [Citation33] further studied the effects of volume fraction and mass fraction of finite-size particles on the turbulence modulation in decaying HIT and found that the Stokes number was not an important indicator for turbulence modulation prediction. But there is still little knowledge on which parameters are important to determine the degree of turbulence attenuation. While the Stokes number is not an important parameter for the particle modulation in the finite-size particle-laden turbulence, the role of particle diameter and particle–fluid density ratio on the turbulence modulation have not been systematically studied before. Second, the turbulence is typically augmented at the small scale and attenuated at the large scale, and the enhancement at small scale is a result of the disturbance flow generated by the finite-size particles [Citation23,Citation25,Citation28,Citation29]. But the influences of particle diameter and density are not well understood. Third, local region of high dissipation rate can be found near particles which contributes to the turbulence attenuation. Analysing the flow around the particles can help understand how the presence of particles modulate the turbulence. Burton and Eaton [Citation24] investigated the flow modulation near the particle surface by a fixed particle in the forced HIT, and the local dissipation was enhanced by several times near the particle surface. Lucci et al. [Citation25] studied the local dissipation in the decaying HIT and found that the local dissipation rate in front of the particles was larger than that in the back of the particles. De Motta et al. [Citation30] studied the dissipation near the moving particles in the forced HIT, and the local high dissipation region was also found. But how the size of the region influenced by the particles changes with different parameters is unknown.
In addition to the Stokes number, other parameters involved in the finite-size particle-laden flows include particle volume fraction (), the ratio of particle diameter and Kolmogorov length scale (
), particle–fluid density ratio (
), and the surface area of the particles which is inversely proportional to the particle diameter for fixed particle volume fraction. It should be noted that the Stokes number can be expressed as
, thus increasing particle diameter and density both will lead to a larger Stokes number. But particle diameter and density might play different role in turbulence modulation. In this paper, we aim to investigate how the turbulence modulation is modified by particles of different densities and diameters. For example, how the global TKE changes, how the kinetic energy spectrum changes and how the size of the local region of high strain rate changes with different parameter settings. We consider the forced HIT as the background flow as it is a simplified model with no boundary confinement. The mesoscopic method, lattice Boltzmann method (LBM) incorporating bounce-back scheme is adopted due to its flexibility in treating the boundaries between two phases [Citation19,Citation28,Citation29].
The paper is organised as follow. The method we use in the simulation is briefly introduced in Section 2. The simulation parameters and results are given in Section 3. Finally, the conclusions are provided in Section 4.
2. The numerical method
The LBM is used to simulate the flow field in this paper, and for numerical stability, the multiple relaxation time (MRT) LBM [Citation34] is selected. Instead of solving the Navier–Stokes (N–S) equations, the MRT LBM solves the evolution of mesoscopic molecular distribution functions. The evolution equation of MRT LBM model is
(1)
(1) where
is the distribution function which locates at space location
at time t,
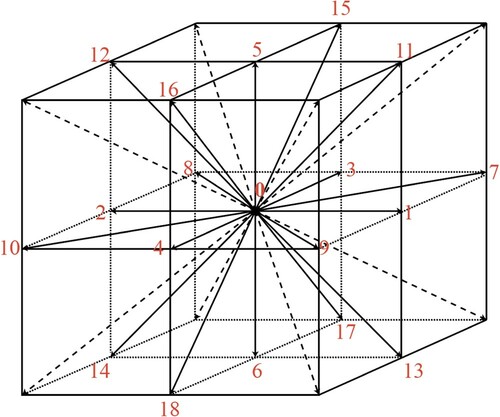
is the discrete velocity (a D3Q19, three dimension 19 discrete velocity, is used in this paper, and a sketch of the D3Q19 discrete velocity set is shown in Figure ),
is the lattice time step,
is the transformation matrix converting the distribution function f from discrete space to moment space
.
is a diagonal relaxation matrix specifies the relaxation parameters for different moments
.
is the mesoscopic forcing term which is related to the macroscopic force (
) in the N–S equations. The right-hand side of Equation (Equation1
(1)
(1) ) is known as the collision operator,
. The LBM scheme is usually divided into two steps, known as the collision step (
) and the streaming step (
).
Figure 1. A sketch of the D3Q19 velocity set.
The Navier–Stokes equations can be recovered through the Chapmann Enskog expansion of lattice Boltzmann equation (LBE). The macroscopic hydrodynamic variables such as pressure (p) and velocity () are obtained from the moments of molecular distribution functions, namely,
(2)
(2) where
is the background constant density, and
is the lattice sound speed which is equal to
.
The well-known stochastic forcing scheme of Eswaran and Pope [Citation35] is applied to drive the turbulent flow. The random forcing scheme has the advantage to obtain predictable energy input, and the average net rate of energy input which is balanced by the dissipation rate can be estimated as
(3)
(3) where
is the number of modes forced,
is the lowest wavenumber in spectral units,
and
are the forcing amplitude and timescale, respectively,
0.8 based on the lower resolution simulation of Eswaran and Pope [Citation35].
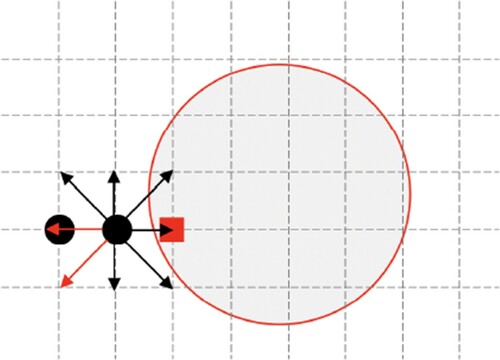
The interpolated bounce-back scheme is used to implement the no-slip boundary at the particle–fluid interface. Figure shows a sketch of the bounce-back scheme in two-dimension, the black vectors represent the known molecular distribution functions in these velocity directions after the streaming step, and the red vectors are the unknown molecular distribution functions as the nodes where these distributions are propagated from are in the solid phase. The unknown distributions in the streaming step are obtained using the interpolated bounce-back scheme, and the no-slip boundary is enforced during the interpolated bounce-back procedure. The default interpolated bounce-back scheme used is proposed by Bouzidi et al. [Citation36] which requires two nodes on the fluid phase. When the distance between two particles is too small and only one fluid node is available, the single-point bounce-back scheme proposed by Zhao and Yong [Citation37] is adopted. These two schemes both have a second-order accuracy and maintain a low numerical dissipation for the no-slip boundary condition. The hydrodynamic force and torque acting on the particles are calculated by integrating the momentum and moment of momentum exchange over the particle surface during interpolated bounce-back process. According to Newton's second law, the translational velocity and angular velocity of each particle can be updated after the hydrodynamic force and torque are obtained, and the position of each particle can be updated afterwards. A new fluid point which is occupied by the particle before the update of particle position may occur after the movement of a particle, the unknown new fluid node is refilled by the ‘equilibrium and non-equilibrium’ extrapolation scheme [Citation38]. As the current particle-laden system is far beyond the dilute limit, the particle–particle interactions must be taken into account. The lubrication force model suggested by Brändle de Motta et al. [Citation39] is selected to deal with the short range hydrodynamic interactions when the spacing between two particles is within one lattice node. When the particles are in contact, the soft-sphere collision model is used to handle the non-physical overlapping between particles [Citation39]. More details about the D3Q19 MRT LBM model incorporating interpolated bounce-back scheme can be found in the references listed above in this section and in Gao et al. [Citation28], Wang et al. [Citation29] and Peng et al. [Citation19].
Figure 2. A two-dimensional sketch of the bounce-back scheme. The circle is the particle surface, the spheres are the fluid nodes, the square is the solid node. The two vectors pointing to the left and lower left are the unknown molecular distribution functions which needs to be determined using interpolated bounce back scheme, and the other vectors are known after the streaming step.
3. Simulation setup and results
The background turbulence is the HIT in a cubic domain with dimensionless length in this study, and the boundary condition is periodic in all three directions. The initially static flow is driven by the large scale forcing, and the flow reaches the stationary state after several eddy turnover times. A grid resolution of
is used for the carrier flow in this study. The resolution requirement has been discussed previously in Wang et al. [Citation29], and the resolution we selected is capable to produce reliable flow statistics when compared with the pseudo-spectral method. The particles are introduced into the flow at around 40 large-eddy turnover times with the velocity of a given particle set to the local fluid velocity at the particle centre and the angular velocity set to zero, and it takes another several eddy turnover times for the flow to reach the stationary stage. In order to ensure that the larger scale forcing is applied to the same fluid volume, the particle volume fraction is fixed at 9%. This volume fraction is far beyond the dilute limit, and hence it is important to apply the four way coupling particle-laden simulation method. Particles with three different diameters (
, 13.33 and 17.77, which correspond to 8, 12 and 16 lattice units) and three particle–fluid density ratios (5, 8.89 and 20) are considered, and the total particle-laden simulation cases are 9. All the particle-laden simulation cases together with single-phase simulation case (SP) are listed in Table . The particle-laden simulation cases are denoted as RxDy, where x represents the value of the particle–fluid density ratio (
) and y represents the value of the ratio of particle diameter to the lattice unit .+-+ (
) in the case name for clarity. Except for case SP, each set of three particle-laden cases has particles with the same particle–fluid density ratio but different diameters. The three cases, R5D16, R8.89D12 and R20D8 have particles with same the Stokes number (defined by Kolmogorov time scale in the single-phase flow).
Table 1. Time-averaged flow statistics in single-phase and particle-laden HIT.
We focus mainly on the turbulence modulation at the stationary stage in this study. Detailed flow statistics at the stationary stage of the single-phase turbulence and particle-laden turbulence are given in Table , including the Kolmogorov length scale, , the Taylor microscale Reynolds number,
, TKE, the normalised dissipation rate,
, the Stokes number (St ), and the final Stokes number,
, obtained using
at the stationary stage, where ν is the kinetic viscosity,
is the root-mean-square (r.m.s) component fluctuation velocity,
is the longitudinal integral length scale and ε is the dissipation rate. It should be noted that the velocity inside the particles is assumed to take the form of rigid body motion, and all the volume-averaged statistics are given in the spectral units. From Table , it can be seen that the turbulence intensity is attenuated by the presence of particles, as a decrease of Taylor microscale Reynolds number (
) and r.m.s component fluctuation velocity (
) for the particle-laden cases compared with the single-phase turbulence can be observed. The final Stokes numbers at the stationary stages are also reduced compared with the Stokes numbers defined using the
in the single-phase flow.
3.1. Global turbulence modulation
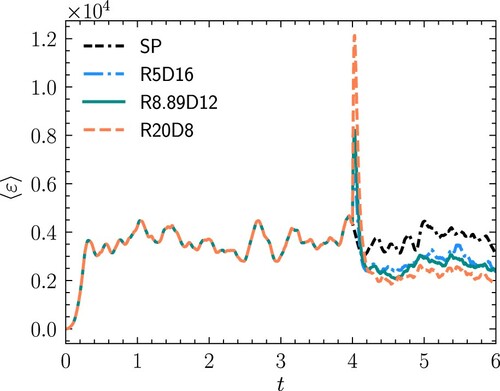
First, the global turbulence modulation by the presence of finite-size particles with the same Stokes number defined using the Kolmogorov time scale is briefly investigated. For cases R5D16, R8.89D12 and R20D8, the corresponding Stokes number is 87.79 at the instant when the particles are released, which is of the same order as in Lucci et al. [Citation25,Citation33]. Figure shows the temporal evolution of the turbulence kinetic energy for these cases. The turbulence kinetic energy decreases quickly immediately after the introduction of particles into the system and reaches the stationary stage after several eddy turnover times. The reduction of TKE increases with the increase of particle–fluid density ratio, and the turbulence kinetic energy is reduced to 58.0%, 42.8% and 21.5% of the turbulence kinetic energy in single-phase turbulence, respectively, for different cases. This reduction is also observed in literature in particle-laden forced HIT using either point-particle approach [Citation40] or resolved approach [Citation25,Citation26,Citation29,Citation33]. Figure shows the temporal evolution of the dissipation rate for three considered cases. Unlike the temporal evolution of the turbulence kinetic energy, the dissipation rate increases quickly immediately after the introduction of particles first, then drops quickly, and finally settles to the stationary stage. The quick jump and drop is due to the sharp interphase between the particle and fluid. At the stationary stage, the dissipation rate also decreases as the particle–fluid density ratio increases and is reduced to 82.9%, 77.0% and 64.8%, respectively, of the dissipation rate in single-phase flow for different cases. Thus, we can see that the Stokes number is indeed not an appropriate parameter to predict the turbulence modulation in particle-laden turbulent flow with finite-size particles as noticed by Lucci et al. [Citation33]. When the particle volume fraction is fixed, two parameters, i.e. the particle–fluid density ratio () and particle diameter (
), are important to characterise the type of the particles. The influence of these two parameters has not been studied intensively in the literature, and thus it is interesting to investigate their influence on turbulence modulation.
Figure 3. Temporal evolution of turbulence kinetic energy for cases R5D16, R8.89D12 and R20D8. At the stationary stage, the TKE decreases with the increase of particle–fluid density ratio.
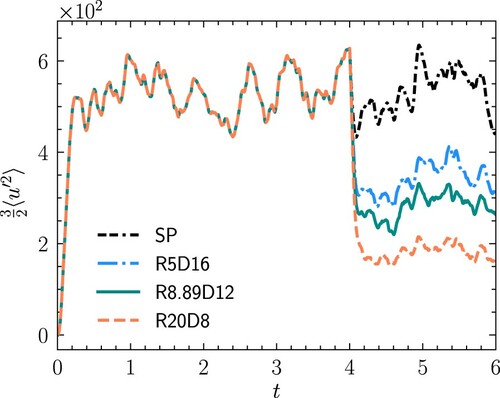
Figure 4. Temporal evolution of dissipation rate for cases R5D16, R8.89D12 and R20D8. The dissipation rate increases quickly immediately after the introduction of particles first, then drops quickly, and finally reaches the stationary stage. At the stationary stage, the dissipation rate decreases with the increase of particle–fluid density ratio.
Next, to separate the influence of diameter and particle–fluid density ratio, the turbulence attenuation by particles with a same density but different diameters and by particles with a same diameter but different particle–fluid density ratios are compared. Figure shows the TKE modulation by particles with different particle–fluid density ratios and particle diameters. It can be found that the particles with larger density would result in a stronger attenuation of TKE when the particle diameter is fixed. In contrast, particles with larger diameter would lead to a less intense attenuation of TKE when the particle–fluid density is fixed. The TKE reduction for the cases laden with particles of is similar to the result of particle-laden forced HIT in the work of Abdelsamie et al. [Citation40]. Although the point-particle approach was used in their work, the mass fraction (
) was similar to the cases with particles of particle–fluid density ratio 5 in our study (
). The corresponding TKE reduction in their study was around 35%, which is similar to the results of the cases R5D8, R5D12 and R5D16 (blue triangles in Figure ). For finite-size particle-laden decaying HIT in Lucci et al. [Citation25], the time-averaged TKE reduction was 10.85% for the case of mass fraction 0.5 in their study. The first reason for the larger reduction of TKE in forced HIT compared with decaying HIT is that the forcing is applied to a smaller portion of the computational domain with the presence of particles. Another reason is due to the negative contribution to the two-way interaction energy by the artificial forcing, which is also reported by Abdelsamie et al. [Citation40] and Wang et al. [Citation29]. For the cases with particles of different diameters, Lucci et al. [Citation25] found that the TKE reduction became smaller with increasing particle diameter (Fig. 9(c) in their study), which is consistent with the results in our study.
Figure 5. The reduction of TKE at the stationary state. The reduction of kinetic energy decreases as the particle diameter increases when the particle–fluid density ratio is fixed, and it increases with increasing particle–fluid density ratio when the particle diameter is fixed. The results in the work of Abdelsamie et al. [Citation40] for forced HIT using point-particle method (marked by plus in the left) and the results from Lucci et al. [Citation25] for finite-size particle-laden decaying HIT (marked by diamond in the bottom) are also shown in the figure.
![Figure 5. The reduction of TKE at the stationary state. The reduction of kinetic energy decreases as the particle diameter increases when the particle–fluid density ratio is fixed, and it increases with increasing particle–fluid density ratio when the particle diameter is fixed. The results in the work of Abdelsamie et al. [Citation40] for forced HIT using point-particle method (marked by plus in the left) and the results from Lucci et al. [Citation25] for finite-size particle-laden decaying HIT (marked by diamond in the bottom) are also shown in the figure.](/cms/asset/6f356158-2e86-468d-8623-1229a1769255/tjot_a_2096223_f0005_oc.jpg)
While keeping other parameters fixed, we can conclude that particles with larger density ratio tend to attenuate the turbulence more. The reason is that the particles with larger density ratio have larger inertia which would cause larger relative slip velocities and thus larger dissipation near the particle surfaces. The large dissipation in the vicinity of the particles will be discussed in Section 3.3. The mean slip velocity, , for different cases is shown in Table , where
is the particle velocity,
is the local fluid velocity seen by the particle.
is computed by an average on a given shell around the particle surface, and the width of the shell is
which is consistent with Kidanemariam et al. [Citation41]. As can be observed from Table , the slip velocity increases with increasing particle density ratio. In contrast, particles with larger diameter tend to suppress the turbulence attenuation. Larger particles would have larger particle Reynolds number, which indicates a larger probability to trigger vortex oscillation or vortex shedding, which can augment the turbulence. The particle Reynolds number is defined as
, and the mean value, standard deviation and maximum value of the particle Reynolds number for different cases are reported in the table. As can be seen from Table , the particle diameter has a significant influence on the particle Reynolds number, and the particle Reynolds number also increases with increasing particle–fluid density ratio. It is known that there is no vortex shedding downstream of the particle if
, and the vortex shedding is mostly present if
[Citation42,Citation43]. When
, the wake oscillation is regarded as the main mechanism for the TKE augmentation [Citation43]. For cases with particles of diameter
, the maximum
is always below 100, thus the TKE reduction is the largest in these cases if the density ratio is fixed. With increasing diameter, the maximum
becomes larger than 100, and the vortex shedding occasionally occurs, especially for cases with particles of diameter
, where the maximum
reaches 166.12 for case R20D16. Different particle Reynolds numbers will result in different wake structures behind the particles, and the vortical structures in cases R20D8, R20D12 and R20D16 identified by the
criterion (the imaginary part of the eigenvalue of the velocity gradient tensor) are shown in Figure . As can be seen from Figure (a), the wake structures with strong swirling strength behind the particles are not observed for case R20D8. But the double-threaded wake can be observed from Figure (b) and (c) for case R20D12 and R20D16, which is a typical vortical structure responsible for the wake oscillation (see in Zeng et al. [Citation43]). It should be noted that the double-threaded wake structure can also be observed occasionally when the particle Reynolds number is larger than 100 in cases R5D12, R5D16, R8.89D12, and R20D16. These wake structures serve as additional energy input and are responsible for the relatively less attenuation of TKE by larger particles.
Figure 6. The vortical structures identified by the criterion for different cases. The visualisations show part of the computational domains where the typical vortical structures exist. The double-threaded wake behind the particle can be observed occasionally in case R20D12 and R20D16, which is a typical structure of the wake oscillation mechanism, but it is not observed in case R20D8 when the particle Reynolds number is not large enough. (a) Case R20D8. (b) Case R20D12. (c) Case R20D16.
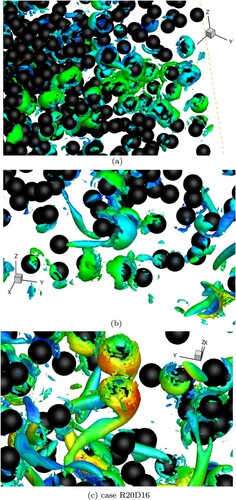
Table 2. Mean slip velocity in the spectral unit, mean particle Reynolds number (), and standard deviation and maximum value of
for different cases.
The tendency for the modulation of dissipation rate is similar to the modulation of TKE, which is illustrated in Figure . As can be seen from Figure , the dissipation rate decreases more with increasing particle–fluid density ratio when the particle diameter is fixed and the dissipation reduction decreases as the particle diameter increases when the particle density ratio is constant. It is also found that the dissipation rate is more influenced by the particle diameter compared with the density ratio. While the overall dissipation rate of particle-laden flows decreases compared with the single phase, the normalised dissipation, , is relatively larger than that of the single phase. Figure shows the normalised dissipation for different cases, and we have also included some results of normalised dissipation rate in the work of Gotoh et al. [Citation44]. It is known that the normalised dissipation becomes constant if the Taylor microscale Reynolds number (
) is larger than 200 for numerical simulations [Citation45]. With the Taylor microscale Reynolds number of the single-phase HIT in this study being 73.80, the normalised dissipation is similar to the results in Gotoh et al. [Citation44]. As shown in Figure , the normalised dissipation is significantly larger than that of the single phase with the presence of solid particles in our simulations. For cases with particles of density ratio 5, the variation of diameter does not influence the normalised dissipation much. For other cases, the normalised dissipation increases with decreasing particle diameter. In the single-phase simulations by Gotoh et al., the normalised dissipation rate increases with decreasing
. In our particle-laden simulations,
at the stationary stage becomes smaller compared to the single phase. Comparing with the normalised dissipation rate of the single phase HIT with similar
in Gotoh et al., the normalised dissipation rates in the particle-laden simulations are significantly larger, especially for the cases with particles of density ratio 20. Thus, the particle-laden cases are more dissipative than the single-phase counterpart in terms of the normalised dissipation rate, mostly due to viscous boundary layers around the many surfaces of solid particles.
Figure 7. The reduction of dissipation at the stationary state. The reduction of dissipation rate decreases as the particle diameter increases when the particle–fluid density ratio is fixed, and it increases with increasing particle–fluid density ratio when the particle diameter is fixed. In addition, the particle diameter has a stronger influence on the dissipation rate compared with particle–fluid density ratio.
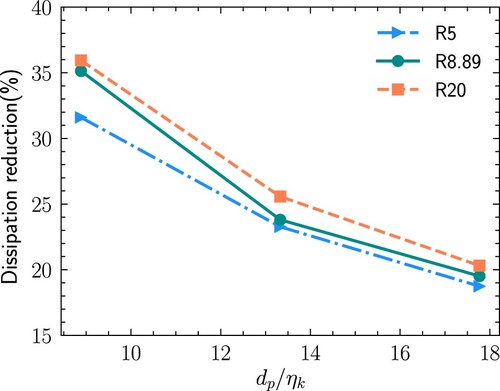
Figure 8. Normalised dissipation () versus
at the stationary stage. Some results of the normalised dissipation rate in the work of Gotoh et al. [Citation44] are also included. The normalised dissipation rate of the particle-laden cases is significantly larger than that of the single phase.
![Figure 8. Normalised dissipation (εLf/(u′)3) versus Reλ at the stationary stage. Some results of the normalised dissipation rate in the work of Gotoh et al. [Citation44] are also included. The normalised dissipation rate of the particle-laden cases is significantly larger than that of the single phase.](/cms/asset/64fefafa-1604-43bb-94cc-53f1b4cb8168/tjot_a_2096223_f0008_oc.jpg)
3.2. Modulation to the energy spectrum
As the presence of particles changes the kinetic energy of the system, the kinetic energy spectrum is given in Figure to show how particles modify the kinetic energy at different length scales. The energy spectrum is normalised using the dissipation of the single-phase case (), and the wavenumber is normalised using the Kolmogorov length scale of the single-phase case (
). Results from cases with the particles of same particle diameter,
and
, but different density ratios are similar to Figure (a), and thus is omitted here. Similarly, only results from cases with particles of constant density ratio
but with varying diameters are shown in Figure (b) for illustration. As can be seen in Figure , a reduction of the kinetic energy at small and intermediate wave number and an increment at the large wave number can be observed for different cases. The nearly periodic oscillations at the small scale are due to the discontinuities at the particle–fluid interphase which is qualitatively labelled as the boxcar effect by Lucci et al. [Citation25]. The modulation to the energy spectrum is consistent with the results from Ten Cate et al. [Citation23] in their finite-size particle laden forced HIT and the results from Abdelsamie et al. [Citation40] for particle-laden forced HIT using the point-particle method. For particle-laden decaying HIT, the attenuation of the energy spectrum at the small wavenumber are usually not observed [Citation25,Citation28,Citation40], but the energy spectrum in the work of Schneiders et al. [Citation31] at later time do show some attenuation at the smallest wavenumber (Fig. 6(b) in their paper). The augmentation of kinetic energy at the small scales is due to the enhanced velocity fluctuations of the disturbance flow induced by the solid particles. The reason of the reduction of kinetic energy at small and intermediate wavenumber is that the presence of solid particles increases the resistance to large-scale flow due to the added drag on the solid particles.
Figure 9. The energy spectrum of different cases. The energy spectrum and wavenumber are normalised using the dissipation and Kolmogorov length scale of the single-phase case, i.e. and
. (a) Cases laden with particles of same diameter (
). (b) Cases laden with particles with same particle–fluid density ratio (
).
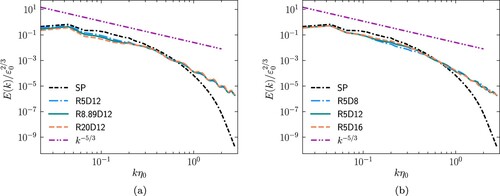
In addition to the findings mentioned above, some differences between the modulation of energy spectrum by varying particle diameters when keep density ratio constant and by varying density ratios when keeping particle diameter constant can be observed. As shown in Figure (a), for cases with particles of same diameter, the reduction of the kinetic energy at small and intermediate wavenumber increases as the particle–fluid density ratio increases as the resistance to large-scale flow is stronger for particles with larger density. Simultaneously, the increase of kinetic energy at the large wavenumber is almost identical. We can also find that the pivot wavenumber is identical for cases with particles of different density ratios when the particle diameter is fixed in this study (the results from cases with particles of another two fixed particle diameters but different density ratios are not shown). As shown in Figure (b), for cases with particles of same density ratio, the particle diameter seems to have negligible influence at the large scale () of the energy spectrum for particle-laden cases, although the energy at the large scale is attenuated with the presence of particles. The changes of particle diameter modify the energy spectrum at the intermediate and small scales. For particles with
, the kinetic energy at
increases with increasing particle diameter. The results from cases with particles of another two particle–fluid density ratios are similar. For particles with
, increasing the particle diameter increases the kinetic energy at
for particle-laden cases. For particles with
, increasing the particle diameter increases the kinetic energy at
for particle-laden cases.
3.3. Near particle dissipation rate
As mentioned in Section 3.1, particles with larger density lead to the stronger attenuation of TKE and dissipation for fixed particle diameter, but larger particles lead to the weaker attenuation of TKE and dissipation when particle–fluid density ratio is constant. Different finite-size particles have different influence on the surrounding flow, which lead to the different modulation of the carrier flow. Investigating the local turbulence dissipation around the particle surface can help understand the modulation due to the presence finite-size solid particles. The local dissipation rate in the vicinity of particles is investigated by the radial dissipation profile away from the particle surface, and the dissipation rate is gathered from a spherical shell with radius from to
, where
is the width of the detection shell. In order to not count the fluid lattice nodes repeatedly and calculate the contribution of the dissipation near the particle surface in each shell, the distance
is defined as the distance from a fluid lattice node to the surface of the nearest particle, and the distance r is the distance of the fluid node to the centre of the nearest particle in this way.
Figures and show the bin averaged dissipation rate normalised by the dissipation rate in the fluid domain () along particle surface for different cases, where
is the average dissipation rate in the fluid domain. For clarity, only cases with particles of fixed diameter
but different density ratios (Figure ) and cases with particles of fixed density ratio
but different particle diameters (Figure ) are shown. As can be seen from Figures and , the radial profile in different cases all exhibits a peak close to the particle surface. The local high dissipation rate near the particle surface is a typical phenomenon which is observed in the particle resolved simulations either with particles larger than Kolmogorov length scale [Citation24–26,Citation30] or with particles of the order of Kolmogorov length scale [Citation31]. The magnitude of peak is of the same order with results in Burton and Eaton [Citation24] and de Motta et al. [Citation30]. As shown in Figure , for cases with particles of same diameter (
), the peak value of dissipation rate increases with increasing particle–fluid density ratio. The location of the peak is approximately the thickness of the boundary layer over the particle which is approximately
. From Figure , it is found that for cases with particles of same particle–fluid density ratio, the peak value increases with increasing particle diameter, as the particles with larger diameter have larger inertia than smaller particles and thus induce larger shear rate and dissipation of the fluid near the particle surface. It should be noted that the influenced region is not the boundary layer, and length of the influence region is larger than the thickness of the boundary layer.
Figure 10. The radial profile of the normalised bin averaged dissipation rate () for cases with particles of same diameter (
). The inset shows the ratio between dissipation from first bin to ith bin and total dissipation (
), and the x axis is normalised by the value of the crossover point for clarity.
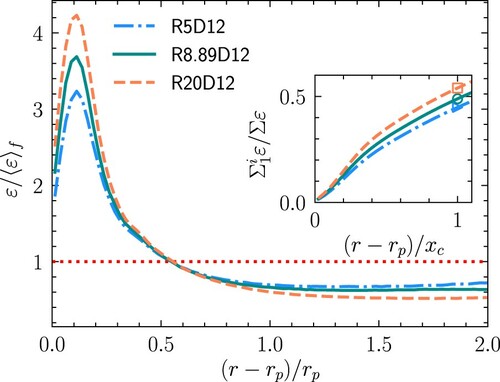
Figure 11. The radial profile of the normalised bin averaged dissipation rate () for cases with particles of same particle–fluid density ratio (
). The inset shows the ratio between dissipation from first bin to ith bin and total dissipation (
), and the x-axis is normalised by the value of the crossover point of each case. Although cases with smaller particles exhibit smaller peak values, but the regions influenced by the particles are larger. The dissipation in the influence region contributes more to the total dissipation.
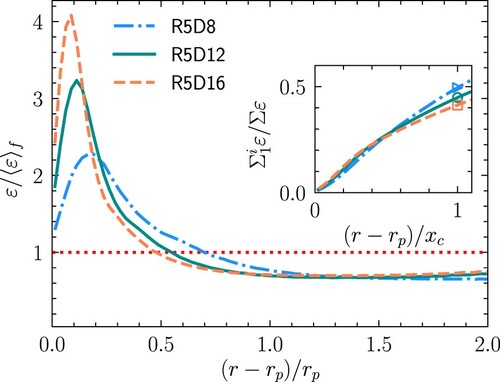
As the distance from the particle surface further increases, the normalised bin averaged dissipation rate becomes less than 1 after . The region where the normalised dissipation rate is larger than 1 can be regarded as the region influenced by the particles. As is mentioned in the work of Schneiders et al. [Citation31], this region is important in calculating the dissipation rate for point-particle model where it is usually underestimated. From Figure , we can see that for cases with particles of same diameter, the region influenced by the particles is identical for different cases. The flow laden with particles of larger density ratio has larger peak value as particles with larger density have larger inertia, and the heavier particles have a stronger influence on the local dissipation. To quantitatively study the relative contribution of the influence region, we calculate the ratio between dissipation from first bin to ith bin and the total dissipation (
). The relative contribution is shown in the inset of Figure , and the x-axis of the inset is normalised by the value of the crossover point of the influence region. The particles with larger density always lead to a larger contribution to the total dissipation when the particle diameter is fixed. The dissipation in the influence region contributes to 44.85%, 48.89% and 53.98% of the total dissipation, respectively, for case R5D12, R8.89D12 and R20D12. Figure shows that flow with particles of smaller diameter have small peak dissipation rate near the particle surface, but the influence region is larger as the region larger than one expands. The smaller influence region of larger particles is because that the probability for larger particles to have longer wake structures with strong swirling strength is higher, and thus the influence region with high dissipation rate becomes smaller. As can be seen from the inset of Figure , for particles with density ratio 5, the influence region contributes to 50.93%, 44.85% and 41.32% of the total dissipation for cases R5D8, R5D12 and R5D16. The results from cases laden with particles of another two density ratios are similar, and thus are omitted here. Although the peak value of the dissipation for smaller particles is smaller, as the smaller particles have smaller
and the thickness of the boundary layer scales as
, the boundary layers for smaller particles are thicker and thus the influence regions for the smaller particles are larger. Besides, the relative contribution of the influence region to the total dissipation is larger, suggesting the cases with smaller particles are more dissipative. We can expect that more kinetic energy is dissipated during the period of reaching steady stage, and thus smaller particles lead to stronger attenuation of the TKE.
4. Conclusion
In this paper, we use the mesoscopic LBM incorporating interpolated bounce-back scheme to investigate the turbulence modulation by finite-size particles in forced homogeneous turbulence. The Taylor microscale Reynolds number of the single-phase flow is 73.8, gravity is neglected to avoid the additional energy injection, and the particle volume fraction is fixed at 9%. The influence of particle–fluid density ratio and particle diameter on turbulence modulation is investigated. Particle resolved simulations with particles of three different diameters and three particle–fluid density ratios are performed, and the total particle-laden cases are 9. The turbulent statistics are obtained by averaging over a period of ten eddy turnover times at the stationary stage.
First, the particle–fluid density ratio has a significant influence on the turbulence attenuation. The TKE is more attenuated with increasing particle–fluid density ratio when the particle diameter is fixed. In contrast, the turbulence is less attenuated with increasing particle diameter while keeping the particle density constant. The weaker attenuation by the larger particles is due to both the reduced surface area and the increased wake instability behind the particles when the particle Reynolds number exceeds 100. The typical double-threaded vortical structures responsible for the wake fluctuation are observed in the cases laden with particles of diameter and
using
criterion, and it is not observed in cases with particles of
. The flow is more intermittent and dissipative with the introduction of particles. As far as the dissipation rate of TKE is concerned, although the overall dissipation becomes smaller, the presence of particles increase the normalised dissipation rate of the carrier flow compared to the single-phase counterpart, especially for the particles with density ratio 20. When the density ratio is fixed, the normalised dissipation increases with decreasing particle diameter.
Second, the turbulence kinetic energy is attenuated at the large scales and augmented at the small scale for all particle-laden cases. For cases laden with particles of same diameter, the energy at the high wavenumber is augmented for particle-laden cases compared with the single-phase counterpart, the increase of particle density ratio seems to have negligible effect on energy spectrum at high wavenumber, but the energy at the small and intermediate wavenumbers decreases with increasing density ratio. For cases laden with particles of same density but different particle diameters, the energy at the several smallest wave number is reduced compared with the single phase. As the particle diameter increases, the energy at intermediate wavenumber increases.
Finally, as the presence of particles can disturb the surrounding flow, the radial profile of dissipation along the particle is investigated. A local maximum of dissipation rate can be observed for different cases. The region influenced by the particle where the normalised value is larger than the mean is investigated. For cases with particle of same diameter, the region is identical with each other with different density ratios. The particles with larger density ratio have larger local maximum of dissipation rate, and the influence region contributes more to the total dissipation, which might be related to the more profound turbulence attenuation. For cases laden with particle of same density ratio, the local maximum of dissipation rate decreases with decreasing particle diameter, but the influence region increases with decreasing particle diameter. In fact, the influence region of the smaller particles contributes more to the total dissipation, and this might be why smaller particles have stronger turbulence attenuation effect. It is also found that the particle density does not affect the influence region in the parameter space in our study.
Disclosure statement
No potential conflict of interest was reported by the authors.
Data availability statement
The data that support the findings of this study are available from the corresponding author upon reasonable request.
Additional information
Funding
References
- Grabowski WW, Wang LP. Growth of cloud droplets in a turbulent environment. Annu Rev Fluid Mech. 2013;45:293–324.
- Balachandar S, Eaton JK. Turbulent dispersed multiphase flow. Annu Rev Fluid Mech. 2010;42:111–133.
- Gore R, Crowe CT. Effect of particle size on modulating turbulent intensity. Int J Multiphase Flow. 1989;15:279–285.
- Kulick JD, Fessler JR, Eaton JK. Particle response and turbulence modification in fully developed channel flow. J Fluid Mech. 1994;277:109–134.
- Paris AD. Turbulence attenuation in a particle-laden channel flow. Stanford (CA, United States): Stanford University; 2001.
- Yang T, Shy S. Two-way interaction between solid particles and homogeneous air turbulence: particle settling rate and turbulence modification measurements. J Fluid Mech. 2005;526:171–216.
- Squires KD, Eaton JK. Particle response and turbulence modification in isotropic turbulence. Phys Fluids A Fluid Dyn. 1990;2:1191–1203.
- Li Y, McLaughlin JB, Kontomaris K, et al. Numerical simulation of particle-laden turbulent channel flow. Phys Fluids. 2001;13:2957–2967.
- Elghobashi S, Truesdell G. On the two-way interaction between homogeneous turbulence and dispersed solid particles. I: turbulence modification. Phys Fluids A Fluid Dyn. 1993;5:1790–1801.
- Druzhinin O, Elghobashi S. On the decay rate of isotropic turbulence laden with microparticles. Phys Fluids. 1999;11:602–610.
- Ferrante A, Elghobashi S. On the physical mechanisms of two-way coupling in particle-laden isotropic turbulence. Phys Fluids. 2003;15:315–329.
- Elgobashi S. An updated classification map of particle-laden turbulent flows. In: Balachandar S, Prosperetti A, editors. IUTAM Symposium on Computational Approaches to Multiphase Flow. Lemont (IL, USA): Springer; 2006. p. 3–10.
- Tanaka T, Eaton JK. Sub-Kolmogorov resolution particle image velocimetry measurements of particle-laden forced turbulence. J Fluid Mech. 2010;643:177–206.
- Bellani G, Byron ML, Collignon AG, et al. Shape effects on turbulent modulation by large nearly neutrally buoyant particles. J Fluid Mech. 2012;712:41–60.
- Tenneti S, Subramaniam S. Particle-resolved direct numerical simulation for gas–solid flow model development. Annu Rev Fluid Mech. 2014;46:277–286.
- Maxey M. Simulation methods for particulate flows and concentrated suspensions. Annu Rev Fluid Mech. 2017;49:171–193.
- Pan Y, Banerjee S. Numerical investigation of the effects of large particles on wall-turbulence. Phys Fluids. 1997;9:3786–3807.
- Shao X, Wu T, Yu Z. Fully resolved numerical simulation of particle-laden turbulent flow in a horizontal channel at a low Reynolds number. J Fluid Mech. 2012;693:319–344.
- Peng C, Ayala OM, Wang LP. A direct numerical investigation of two-way interactions in a particle-laden turbulent channel flow. J Fluid Mech. 2019;875:1096–1144.
- Tanaka M, Teramoto D. Modulation of homogeneous shear turbulence laden with finite-size particles. J Turbul. 2015;16:979–1010.
- Tanaka M. Effect of gravity on the development of homogeneous shear turbulence laden with finite-size particles. J Turbul. 2017;18:1144–1179.
- Yousefi A, Ardekani MN, Brandt L. Modulation of turbulence by finite-size particles in statistically steady-state homogeneous shear turbulence. J Fluid Mech. 2020;899:A19.
- Ten Cate A, Derksen JJ, Portela LM, et al. Fully resolved simulations of colliding monodisperse spheres in forced isotropic turbulence. J Fluid Mech. 2004;519:233–271.
- Burton TM, Eaton JK. Fully resolved simulations of particle-turbulence interaction. J Fluid Mech. 2005;545:67–111.
- Lucci F, Ferrante A, Elghobashi S. Modulation of isotropic turbulence by particles of Taylor length-scale size. J Fluid Mech. 2010;650:5–55.
- Yeo K, Dong S, Climent E, et al. Modulation of homogeneous turbulence seeded with finite size bubbles or particles. Int J Multiphase Flow. 2010;36:221–233.
- Cisse M, Homann H, Bec J. Slipping motion of large neutrally buoyant particles in turbulence. J Fluid Mech. 2013;735:R1.
- Gao H, Li H, Wang LP. Lattice Boltzmann simulation of turbulent flow laden with finite-size particles. Comput Math Appl. 2013;65:194–210.
- Wang LP, Ayala O, Gao H, et al. Study of forced turbulence and its modulation by finite-size solid particles using the lattice Boltzmann approach. Comput Math Appl. 2014;67:363–380.
- de Motta JB, Estivalezes JL, Climent E, et al. Local dissipation properties and collision dynamics in a sustained homogeneous turbulent suspension composed of finite size particles. Int J Multiphase Flow. 2016;85:369–379.
- Schneiders L, Meinke M, Schröder W. Direct particle–fluid simulation of Kolmogorov-length-scale size particles in decaying isotropic turbulence. J Fluid Mech. 2017;819:188–227.
- Luo K, Wang Z, Li D, et al. Fully resolved simulations of turbulence modulation by high-inertia particles in an isotropic turbulent flow. Phys Fluids. 2017;29:113301.
- Lucci F, Ferrante A, Elghobashi S. Is Stokes number an appropriate indicator for turbulence modulation by particles of Taylor-length-scale size? Phys Fluids. 2011;23:025101.
- D'Humières D, Ginzburg I, Krafczyk M, et al. Multiple-relaxation-time lattice Boltzmann models in three dimensions. Phil Trans R Soc Lond A. 2002;360:437–451.
- Eswaran V, Pope SB. An examination of forcing in direct numerical simulations of turbulence. Comput Fluids. 1988;16:257–278.
- Bouzidi M, Firdaouss M, Lallemand P. Momentum transfer of a Boltzmann-lattice fluid with boundaries. Phys Fluids. 2001;13:3452–3459.
- Zhao W, Yong WA. Single-node second-order boundary schemes for the lattice Boltzmann method. J Comput Phys. 2017;329:1–15.
- Caiazzo A, Junk M. Boundary forces in lattice Boltzmann: analysis of momentum exchange algorithm. Comput Math Appl. 2008;55:1415–1423.
- Brändle de Motta JC, Breugem WP, Gazanion B, et al. Numerical modelling of finite-size particle collisions in a viscous fluid. Phys Fluids. 2013;25:083302.
- Abdelsamie AH, Lee C. Decaying versus stationary turbulence in particle-laden isotropic turbulence: turbulence modulation mechanism. Phys Fluids. 2012;24:015106.
- Kidanemariam AG, Chan-Braun C, Doychev T, et al. DNS of horizontal open channel flow with finite-size, heavy particles at low solid volume fraction. New J Phys. 2013;15:025031.
- Mittal R. Response of the sphere wake to freestream fluctuations. Theor Comput Fluid Dyn. 2000;13:397–419.
- Zeng L, Balachandar S, Najjar FM. Wake response of a stationary finite-sized particle in a turbulent channel flow. Int J Multiph Flow. 2010;36:406–422.
- Gotoh T, Fukayama D, Nakano T. Velocity field statistics in homogeneous steady turbulence obtained using a high-resolution direct numerical simulation. Phys Fluids. 2002;14:1065–1081.
- Ishihara T, Gotoh T, Kaneda Y. Study of high-Reynolds number isotropic turbulence by direct numerical simulation. Annu Rev Fluid Mech. 2009;41:165–180.