
 ?Mathematical formulae have been encoded as MathML and are displayed in this HTML version using MathJax in order to improve their display. Uncheck the box to turn MathJax off. This feature requires Javascript. Click on a formula to zoom.
Abstract
This work demonstrates the potential of porous BaTiO3 for piezoelectric sensor and energy-harvesting applications by manufacture of materials, detailed characterisation and application of new models. Ferroelectric macro-porous BaTiO3 ceramics for piezoelectric applications are manufactured for a range of relative densities, α = 0.30–0.95, using the burned out polymer spheres method. The piezoelectric activity and relevant parameters for specific applications are interpreted by developing two models: a model of a 3–0 composite and a ‘composite in composite’ model. The appropriate ranges of relative density for the application of these models to accurately predict piezoelectric properties are examined. The two models are extended to take into account the effect of 90° domain-wall mobility within ceramic grains on the piezoelectric coefficients . It is shown that porous ferroelectrics provide a novel route to form materials with large piezoelectric anisotropy
at 0.20 ≤ α ≤ 0.45 and achieve a high squared figure of merit
. The modelling approach allows a detailed analysis of the relationships between the properties of the monolithic and porous materials for the design of porous structures with optimum properties.
1. Introduction
Piezoelectric porous materials based on ferroelectric ceramics (FCs) are of interest not only due to piezoelectric, hydroacoustic and energy-harvesting characteristics,[Citation1–4] but also as heterogeneous ferroelectric materials with intricate microgeometry–properties interrelations.[Citation5,6] The physical properties of a porous material that exhibits electromechanical coupling due to its ferroelectric nature depends on its properties, manufacturing method, microstructure and poling conditions. Relevant aspects of the microstructure of porous ferroelectric materials include the properties of the pore-forming agents, porosity vp (volume fraction of the pores in the monolithic FC), the shape and size of the pores, their orientation with respect to the poling direction, and other microgeometric features.[Citation2,3,7,8] Among the porous materials based on the perovskite-type FCs of interest, porous lead-based PZT-type FCs (ceramic compositions based on Pb(Zr, Ti)O3) and composites [Citation1–3,6–8] have been the most commonly studied in recent decades. Although the physical properties of dense monolithic BaTiO3 FC are well known,[Citation9] the piezoelectric performance and related parameters of porous materials based on BaTiO3 [Citation4] have yet to be studied in detail. In contrast to the numerous PZT-type FCs with complicated (heterophase) compositions near the morphotropic phase boundary, the BaTiO3 FC represents a monophasic material with grains split into both 180° and 90° domains.[Citation9,10] At room temperature, the ferroelectric phase of BaTiO3 is tetragonal from the 4 mm symmetry class [Citation10] and, in our opinion, the relative simplicity of the domain structure of the FC grains and the FC microstructure can enable a detailed analysis of the relationships between the properties of the monolithic and porous FC-based materials. The aim of the present paper is to interpret the piezoelectric performance of macro-porous BaTiO3 in a wide porosity range using both experimental and modelling approaches and consider the porous material for sensor and energy-harvesting applications.
2. Manufacturing and experimental data
To manufacture the porous material [Citation4] for this study, BaTiO3 powder (Ferro, Stoke-on-Trent, UK) was ball-milled for 24 h with zirconia media and distilled water. A small amount of the polyethylene glycol (PEG, Sigma Aldrich, Market Harborough, UK) as a binder was added to the BaTiO3 powder prior to ball milling in order to facilitate uniaxial cold pressing of samples and produce crack-free green bodies. After ball-milling, the BaTiO3 powder was dried over night before sieving through a 150 μm mesh. Porous BaTiO3 samples at 0.10 ≤ vp ≤ 0.72 were produced by means of the ‘burned out polymer spheres’ (BURPS) method. The porosity of all the manufactured materials was measured via the Archimedean method. In the BURPS method, ceramic powder is mixed with varying weight fractions of a volatile polymer species. In this case the volatile polymer was PEG, which burns out during the sintering stage to leave randomly distributed pores in the structure, whilst providing good control over the final porosity of the materials. In this method, the resulting pore size and morphology are similar to those of the pore-forming agent.
After uniaxial pressing at 300 MPa to form pressed pellets (13 mm diameter) the samples were sintered in air in an Elite Thermal Systems Ltd (Gillingham, UK) furnace (Model No. BRF14/10–2416 CG) at 1300 °C for two hours. A two-hour dwell stage at 400 °C during initial heating was carried out to burn out the binder/pore-forming agent, and the ramp rate was ±60 °C/h. X-ray diffraction (XRD, Philips PW1730, Guildford, UK) analysis confirmed a fully perovskite structure in both the monolithic and high-porosity samples, see Figure (a). The pore size in samples at the lower porosity (vp = 0.1–0.3) was estimated from scanning electron microscopy (SEM, JEOL JSM6480LV, Peabody, MA, USA) images (see, for instance, Figure (b–d)), and the average size of the macro-pores was 150 μm. The size of the macro-pores can vary from 50 to 400 μm, which is thought to be due to a combination of a variation in the size of the pore-forming agent and coalescence of pore-forming agent in high porosity samples. There is also some micro-porosity that is not thought to be caused by the pore-forming agent, and the size of such pores is approximately 3–4 μm. Both types of porosity appear to be spherical.
Figure 1. (a) XRD patterns of dense (vp = 0.05) and porous (vp = 0.55) BaTiO3 after sintering, both exhibiting fully formed perovskite crystal structure; and SEM micrographs of porous BaTiO3 with (b) vp = 0.11, (c) vp = 0.19, and (d) vp = 0.28, demonstrating the increase in interconnection between macro-pores with increasing in vp. All scale bars are 200 μm in length.
To ‘pole’ the porous BaTiO3 samples, electrical corona poling was performed in air at 115 °C with a 14 kV voltage applied from a 35 mm point source. Piezoelectric strain coefficients (j = 1 and 3) were measured on the manufactured dense and porous samples by means of a Take Control Piezometer System PM25 with an adapter for measuring
. The dielectric properties of the same samples were studied using impedance spectroscopy via a Solartron 1260 and 1296 Dielectric Interface (Solartron Analytical, Farnborough, UK), and based on data, the relative permittivity of the stress-free sample
was evaluated in the wide porosity range.[Citation4]
Figure shows the experimental dependence of the piezoelectric coefficients on the relative density α = 1 – vp of the porous materials. At 0 < α < 1, the relative permittivity
increases monotonously, and its derivative is d(
)/dα ≈ 1500. Data from Figure suggest that the porous structure influences the piezoelectric effect on the poling (j = 3) and lateral (j = 1) directions in different ways, and such a response is a result of the specific arrangement of pores formed in the samples. The piezoelectric anisotropy
/
undergoes relatively small changes at higher levels of density in the range 0.50 < α < 1, but at lower densities in the range 0.20 ≤ α ≤ 0.45 a much larger degree of the piezoelectric anisotropy (i.e.
) is observed. At 0.20 ≤ α ≤ 0.45, values of the piezoelectric coefficient
(Figure ) are comparable to
of highly anisotropic PbTiO3-type FCs, however the relative permittivity
of the porous BaTiO3 samples is larger than that of the monolithic PbTiO3-type FCs.[Citation10,11] In this case we see that there is an opportunity to replace lead-containing FC materials with porous BaTiO3 materials for piezoelectric based applications [Citation12–14] such as sensors, acoustic receivers, active elements of non-destructive testing devices, and devices for medical diagnostics.
Figure 2. Piezoelectric coefficients (in pC/N) measured on poled porous BaTiO3 samples at room temperature. α is relative density of the sample.
3. Interpretation and comparison of results on the piezoelectric performance
Earlier modelling studies have focused on porous ferroelectric PZT-type materials (see e.g. [1,3,5,6,15–17]) and it is clear that different manufacturing methods, as well as various pore-forming agents and microgeometric features of the porous ferroelectrics [Citation18–21] make it difficult to use a reliable model across the whole porosity range. Recent attempts have explored composite models [Citation6,15–17] for interpreting the piezoelectric performance of the porous PZT-type medium, and this circumstance stimulated our further analysis.
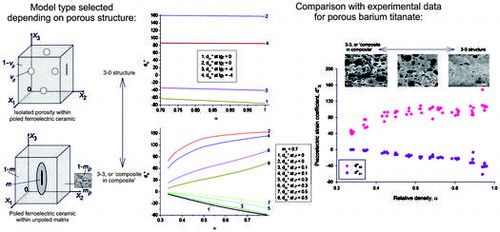
To interpret the piezoelectric properties of porous BaTiO3, we now put forward two models of the piezo-active composite. Taking into consideration the SEM images from Figure (b) and (c), at relatively low porosity levels vp, we assume that the FC matrix contains isolated spherical air inclusions, and these inclusions are regularly distributed throughout the material; see Figure (a). Such a composite is described by 3–0 connectivity in terms of work.[Citation3,12,13] The effective electromechanical (i.e. elastic, piezoelectric and dielectric) properties of the porous 3–0 composite are determined in the matrix form by using the dilute approach,[Citation5] and in this case any interaction between the inclusions can be neglected. The matrix of the effective properties of the 3–0 composite is given by:
Figure 3. Schematics of the porous structure at (a) high relative densities (3–0 composite model) and (b) low relative densities (‘composite in composite’ model). In (a) vp is the effective porosity of the sample, and its remanent polarisation vector is shown with the arrow on the right side. In (b) m is the volume fraction of the monolithic poled FC inclusion with semiaxes a1 = a2 and a3. 1 – m is the volume fraction of the unpoled porous ceramic matrix wherein mp is the volume fraction of air inclusions with semiaxes a1p = a2p and a3p. The remanent polarisation vector of the FC inclusion is shown with the arrow. The effective porosity of the sample shown in (b) is vp = (1 – m)mp.
(1)
(1)
In Equation (Equation1(1)
(1) ) || C(1) || is the 9 × 9 matrix that describes the electromechanical properties of the monolithic FC, ||I|| is the 9 × 9 identity matrix, ||S|| is the 9 × 9 matrix containing components of the Eshelby electroelastic tensor,[Citation3,22] and α is the relative density. Elements of ||S|| depend [Citation3,22] on the shape of the inclusions and on the electromechanical properties of the monolithic FC medium that surrounds the inclusions. The ||C(1)|| matrix from Equation (Equation1
(1)
(1) ) is represented as follows:
(2)
(2)
where ||c(1),E|| is the 6 × 6 matrix of elastic moduli measured at constant electric field, ||e(1)|| is the 6 × 3 matrix of piezoelectric coefficients, and ||ε(1),ξ|| is the 3 × 3 matrix of relative permittivities measured at constant mechanical strain. The superscript t in Equation (Equation2(2)
(2) ) denotes the transposition. The matrix of effective electromechanical constants ||C*|| from Equation (Equation1
(1)
(1) ) has the form shown in Equation (Equation2
(2)
(2) ). Table shows the room-temperature elastic moduli, piezoelectric coefficients and relative permittivities of the poled monolithic BaTiO3 FC used for the modelling.
Table 1. Room-temperature elastic moduli  (in 1010 Pa), piezoelectric coefficients eij (in C/m2) and relative permittivities of monolithic BaTiO3 FC.Table Footnotea[Citation9]
As the porosity level in the material increases there is an increase in the interconnection of the pores; see, for example, Figure (d). In this porosity range we therefore apply a ‘composite in composite’ model as in Figure (b) where m is the volume fraction of the monolithic poled FC inclusion, 1 – m is the volume fraction of the unpoled porous ceramic matrix and mp is the volume fraction of air inclusions. The effective porosity is therefore vp = (1 – m)mp. It is assumed that the monolithic poled FC (piezoelectric) inclusions are regularly distributed in a porous non-poled FC (piezo-passive) matrix. Our approach is to ensure the non-poled (i.e. piezo-passive) material surrounding the poled FC inclusion is consistent with model concepts [Citation23] based on the distribution of unpoled and poled regions within the FC material. The FC–air network and modelling were used to interpret the piezoelectric properties and related parameters of porous lead zirconate titanate FCs; however, the shape of poled and unpoled regions was not discussed in detail.[Citation23]
The shape of the poled FC inclusion in our model (Figure (b)) is described by the equation (x1/a1)2 + (x2/a1)2 + (x3/a3)2 = 1 relative to the axes of the rectangular co-ordinate system (X1X2X3), where semiaxes of the spheroid are a1 = a2 and a3, and ρ = a1/a3 is the aspect ratio. In a limiting case, ρ = 0, the inclusion has the form of a circular cylinder. The spheroidal air inclusions are uniformly distributed in the unpoled FC matrix (see inset in Figure (b)), and the shape of the air inclusions are characterised by the aspect ratio ρp = a1p/a3p, where a1p = a2p and a3p are semiaxes of the air inclusion. We also assume that the radius of each air inclusion is much smaller than the length of each semiaxis aj of the FC inclusion. The composite shown in Figure (b) is characterised by 0–3–0 connectivity at ρ > 0 or by 1–3–0 connectivity at ρ = 0.
In the present model of the ‘composite in composite’, the electromechanical interaction between the poled FC inclusions is considered. The effective properties of the composite are determined by means of the effective field method.[Citation3,5] Following this method, we represent the ||C*|| matrix of effective properties as:
(3)
(3)
In Equation (Equation3(3)
(3) ) the matrices of the electromechanical properties ||C(1)|| (poled FC inclusions) and ||C(2)|| (porous FC matrix) have the form shown in Equation (Equation2
(2)
(2) ), m is the volume fraction of the poled FC inclusions, ||I|| is the identity matrix, and ||S|| is the matrix that contains components of the Eshelby electroelastic tensor.[Citation3,5] The ||C(2)|| matrix is written by analogy with the || C* || matrix from Equation (Equation1
(1)
(1) ):
(4)
(4)
In Equation (Equation4(4)
(4) ) ||C(FC)|| characterises the properties of the non-poled FC medium surrounding the air inclusions, and mp is their volume fraction (Figure (b)). In this work we consider the aspect ratio of the air inclusion ρp >> 1. The presence of oblate-shaped air inclusions in the FC matrix strongly influences the lateral piezoelectric effect, and increasing the volume fraction of these inclusions mp at ρp = const leads to a decrease of the |
| of the composite as a whole.
Absolute values of the piezoelectric coefficients of the monolithic poled FC (if we extrapolate experimental data from Figure to α = 1) are smaller than those from Table . A decrease of |
| may be the result of a restricted mobility of domain walls in FC grains, and this effect was studied by Aleshin.[Citation24] Following the model concept,[Citation24] we assume that during poling of the FC sample, the 180° domains are removed. As a result, each grain is assumed to be split into the 90° domains that are separated by planar walls, and the 90° domain-wall displacements are caused by an external field, either electric or stress. The electromechanical properties of the monolithic poled FC depend on lg(γ) that characterises the mobility of the 90° domain walls, where γ = (Hc)−1.10−6 Pa, H is the average width of the domain, and c links the domain-wall displacement x and thermodynamic pressure f in accordance with the relation [Citation24] f = cx. A dependence of the piezoelectric properties of the monolithic FC on the mobility of the 90° domain walls is graphically represented in Figure .
Figure 4. Piezoelectric coefficients (in pC/N) of the poled monolithic BaTiO3 FC vs. the mobility of 90° domain walls in grains (calculations based on formulae [Citation24]).
![Figure 4. Piezoelectric coefficients d3j* (in pC/N) of the poled monolithic BaTiO3 FC vs. the mobility of 90° domain walls in grains (calculations based on formulae [Citation24]).](/cms/asset/38cfa222-50ca-441f-a554-0d541c60102c/tsta_a_1245578_f0004_oc.gif)
Comparing data from Figures and , we state that the model of the 3–0 composite shown in Figure (a) can be effectively applied to interpret the piezoelectric performance of the studied porous material at a relative density range of 0.7 < α < 1 as there is a limited change in and only a small decrease in the magnitude of
with a decrease in density in this range for both model and experiment. In this case the mobility of the 90° domain walls in FC grains is characterised by –4 ≤ lg(γ) ≤ 0.
Figure 5. Piezoelectric coefficients (in pC/N) of the poled porous BaTiO3 material (3–0 connectivity, see the model in Figure (a)) at the fixed mobility of 90° domain walls in FC grains. Calculations were performed using full sets of electromechanical constants [Citation24] of the poled monolithic BaTiO3 FC at either lg(γ) = 0 (curves 1 and 2, moderate mobility of 90° domain walls) or lg(γ) = –4 (curves 3 and 4, low mobility of 90° domain walls).
![Figure 5. Piezoelectric coefficients d3j* (in pC/N) of the poled porous BaTiO3 material (3–0 connectivity, see the model in Figure 3(a)) at the fixed mobility of 90° domain walls in FC grains. Calculations were performed using full sets of electromechanical constants [Citation24] of the poled monolithic BaTiO3 FC at either lg(γ) = 0 (curves 1 and 2, moderate mobility of 90° domain walls) or lg(γ) = –4 (curves 3 and 4, low mobility of 90° domain walls).](/cms/asset/e0db197b-e3f5-42a1-bf7c-cad60838fd76/tsta_a_1245578_f0005_oc.gif)
At lower relative densities, where α < 0.7, we apply the model of the ‘composite in composite’ at the porosity of the FC matrix mp = 0.6–0.7, and the results of our calculations are shown in Figure . In the presence of the continuous cylinder-shaped (ρ = 0) or isolated spheroidal (ρ = 0.1–0.5) poled FC inclusions, the predicted piezoelectric performance (Figure ) is in agreement with experimental data of Figure at 0.3 < α < 0.8. It should be added that replacing the non-poled porous FC matrix with the poled porous FC matrix leads to overestimated values of due to the considerable electromechanical coupling in the composite with two piezoelectric components.
Figure 6. Piezoelectric coefficients (in pC/N) of porous BaTiO3 at the fixed aspect ratio ρ of the poled FC inclusions in the porous non-poled FC matrix with oblate spheroidal air inclusions (ρp = 100, see the ‘composite in composite’ model in Figure (b)). The domain-wall mobility in FC grains of the poled FC inclusions is characterised by lg(γ) = 0. The volume fraction of the air inclusions in the porous matrix is either mp = 0.7 (a) or mp = 0.6 (b).
Replacing the prolate FC inclusions with oblate ones at ρ >> 1 leads to a significant decrease of the piezoelectric activity of the porous sample. Our evaluations carried out within the framework of the ‘composite in composite’ model (see Figure (b)) at ρ = 10 lead to the following values:
= 3.59 pC/N (m = 0.7 and mp = 0.7),
= 2.32 pC/N (m = 0.6 and mp = 0.7),
= 4.21 pC/N (m = 0.7 and mp = 0.6), and
= 2.75 pC/N (m = 0.6 and mp = 0.6). Oblate shaped FC inclusions do not facilitate reliable poling of the sample due to the influence of depolarisation effects, and increasing the applied electric field to achieve improved poling may lead to electric breakdown of the material. In our opinion, the presence of low piezoelectric activity, or piezo-passive, interlayers, that are formed in the porous sample during manufacture leads to an additional decrease of the piezoelectric activity and domain-wall mobility in a wide α range.
To compare the properties of porous BaTiO3 with porous lead-based ferroelectric ceramics, we now compare the normalised piezoelectric coefficients of the BaTiO3 reported in this work with ZTS-19, which is a Pb(Zr, Ti)O3-based ferroelectric composition near the morphotropic phase boundary.[Citation6,8] According to formulae:[Citation8]
(5)
(5)
In Equation (Equation5(5)
(5) ) X(1) is a property of the monolithic poled FC, and Ap, Bp, Cp, Gp, and Hp are coefficients calculated using the least-square method to characterise the porous material. These coefficients are Ap = –10.239, Bp = 2.0, Cp = –2.429, and Gp = 6.128 for X = d31, Ap = –0.206, Bp = 1.0, Cp = 0.047, and Gp = 1.202 for X = d33, and Ap = –5.316, Bp = –0.95, Cp = 0.625, and Gp = –4.531 for X = g33.[Citation8] The relatively small difference between X*(vp) calculated using + Hp and X*(vp) calculated using at –Hp from Equation (Equation5
(5)
(5) ) enables us to assume Hp = 0 [Citation6].
The data in Table suggest that the porous BaTiO3 is associated with smaller ratios of /
; however, the
/
ratio is almost equal for the two porous ferroelectric materials, BaTiO3 and ZTS-19. This can be explained by the restricted domain-wall mobility, and therefore the lower relative permittivity, in the BaTiO3 FC grains in comparison to the ZTS-19 FC grains. The smaller relative permittivity
of porous BaTiO3 leads to larger values of the piezoelectric coefficient
=
/
in comparison to ZTS-19. However, the values of
of porous BaTiO3 are smaller than
of porous ZTS-19 and lead to a decrease of
for porous BaTiO3 at high porosity levels. As a result, the
/
ratio undergoes relatively minor changes with porosity at α ≥ 0.7 (Table ) for both BaTiO3 FC and ZTS-19 FC. The difference between the
/
ratios of the two porous materials for α = 0.5 (see Table ) may be a result of the microgeometric distinctions between highly porous ZTS-19 and BaTiO3 samples.
Table 2. Comparison of normalised piezoelectric coefficients X*(vp)/X(1) calculated using experimental data on poled porous materials.
Of additional interest is to examine experimental data of the squared figure of merit ()2 =
(Table ) in comparison to the monolithic BaTiO3 in work.[Citation9] The parameter (
)2 is used [Citation2,4,6] to characterise the signal–noise ratio on the longitudinal direction or performance for piezoelectric energy harvesting in longitudinal direction off-resonance. The data from Table suggest that the larger values of the normalised squared figure of merit (
)2/(
) are achieved at lower relative densities (α ≈ 0.7) where a lower piezoelectric coefficient
is measured, and this behaviour is particular to the porous BaTiO3 material presented in this work. The larger value of
[Citation9] leads to a larger value of
of the FC and to a decrease in (
)2/(
). The values of (
)2 ≈ 3 · 10−12 Pa−1 and (
)2/(
) ≈ 1.1–1.2 are achieved near max[(
)2] for the porous BaTiO3, and max[(
)2] is strongly linked with max
. We note for comparison that for the monolithic BaTiO3 FC from [Citation9], the value of
is approximately 2.4 · 10−12 Pa−1, and for monolithic PZT FC from [Citation25],
= 1.2 · 10−12 Pa−1. According to experimental results [Citation25] on a lattice 3–3 PZT FC/epoxy composite with a regular arrangement of components, (
)2/(
) = 1.18 at α = 0.3, and (
)2/(
) = 4.37 at α = 0.5. These values of (
)2/(
) are larger than those related to porous BaTiO3 due to the higher piezoelectric activity of PZT and to the regular composite structure [Citation25] that promotes a better poling of the composite sample.
Table 3. Normalised experimental squared figures of merit ()2/() of poled porous BaTiO3 in comparison to the monolithic BaTiO3 FC.Table Footnotea
4. Conclusions
Based on both experimental and modelling methods, we have investigated in detail the piezoelectric properties of porous ferroelectric BaTiO3 prepared by the BURPS method. The piezoelectric performance of the prepared samples has been analysed in the wide range of the relative densities (0.3 < α < 1), and two models of FC–air composites have been developed; see Figure . At a high density level (α ≥ 0.7) the model of the 3–0 composite with spherical air inclusions (Figure (a)) accurately describes the behaviour of the piezoelectric coefficients . At a low relative density in the range 0.3 < α < 0.7 the ‘composite in composite’ model (Figure (b)) is more applicable to simulate the considerable changes in
with density for porous BaTiO3. It has been shown that the non-poled porous FC matrix plays an important role in the material properties, especially at forming the lateral piezoelectric response. In addition, the restricted mobility of 90° domain walls in FC grains has been taken into account in both models and the domain-wall mobility remains low (–4 ≤ lg(γ) ≤ 0 in terms of Aleshin’s work [Citation24]) and strongly influences the piezoelectric coefficients
in the whole range of densities.
Figure 7. Relative density (α) ranges wherein models of porous BaTiO3 are applicable to interpret the experimental (α) dependence. Experimental values of the piezoelectric coefficients
in pC/N, and dotted lines are given for the benefit of the reader.
A comparison of porous lead-based ZTS-19 [Citation6] and porous BaTiO3 enables us to conclude that distinctions in microgeometry of the materials and in the mobility of domain walls in their grains lead to differences in their piezoelectric properties. Such distinctions are observed in a wide relative density range for the porous media. It is shown that the properties of poled porous BaTiO3 are similar to those observed in porous lead-based ZTS-19 and make it a novel lead-free material for piezoelectric sensor and energy-harvesting applications; of particular note is the large piezoelectric anisotropy at 0.20 ≤ α ≤ 0.45. This means there is potential to exploit the longitudinal oscillation mode that is important for acoustic and transducer devices. Moreover, the models enable us to take into account the domain-wall mobility, and its changes by formation of a macro-porous structure, to be taken into account in a wide porosity range. The modelling approach allows an in-depth analysis of the relationships between the properties of the monolithic and porous materials for the design of porous ferroelectrics with optimum porosity level and geometry for transducer and piezoelectric applications.
Funding
This work was supported by Engineering and Physical Sciences Research Council; European Research Council [grant number 320963]; Souther Federal University [grant number 11.1302.2014/K].
Acknowledgements
The authors would like to thank Prof. Dr A.A. Nesterov and Prof. Dr I.A. Parinov (Southern Federal University, Russia) for their research interest in the piezoelectric performance of advanced ceramic and composite materials. Prof. Dr C.R. Bowen acknowledges funding from the European Research Council under the European Union’s Seventh Framework Programme (FP/2007-2013)/ERC Grant Agreement no. 320963 on Novel Energy Materials, Engineering Science and Integrated Systems (NEMESIS). Mr J.I. Roscow acknowledges funding from Engineering and Physical Sciences Research Council (EPSRC), UK. In the present paper, the results on the research work number 11.1302.2014/K have been represented within the framework of the project part of the state task in the scientific activity area at the Southern Federal University (Russia).
Disclosure statement
No potential conflict of interest was reported by the authors.
References
- Wersing W, Lubitz K, Mohaupt J. Dielectric, elastic and piezoelectric properties of porous pzt ceramics. Ferroelectrics. 1986;68:77–97.10.1080/00150198608238739
- Kara H, Ramesh R, Stevens R, et al. Porous PZT ceramics for receiving transducers. IEEE Trans Ultrason Ferroelec A Freq Contr. 2003;50:289–296.10.1109/TUFFC.2003.1193622
- Topolov, VY, Bowen CR. Electromechanical properties in composites based on ferroelectrics. Springer: London; 2009.
- Roscow JI, Taylor J, Bowen CR. Manufacture and characterization of porous ferroelectrics for piezoelectric energy harvesting applications. Ferroelectrics. 2016;498:40–46.10.1080/00150193.2016.1169154
- Dunn ML, Taya M. Electromechanical properties of porous piezoelectric ceramics. J Am Cer Soc. 1993;76:1697–1706.10.1111/jace.1993.76.issue-7
- Filippov SE, Vorontsov AA, Brill OE, et al. Microgeometry, piezoelectric sensitivity and anisotropy of properties in porous materials based on Pb(Zr, Ti)O3. Funct Mater Lett. 2014;7:1450029.
- Kahn M. Acoustic and elastic properties of PZT ceramics with anisotropic pores. J Am Cer Soc. 1985;68:623–628.10.1111/jace.1985.68.issue-11
- Lopatin SS, Lupeiko TG. Properties of the porous piezoelectric ceramic of the lead zirconate-titanate type. Neorg Mater. 1991;27:1948–1951. (in Russian).
- Berlincourt DA, Cerran DR, Jaffe H. Piezoelectric and piezomagnetic materials and their function in transducers. In: Mason W, editor. Physical acoustics. Principles and methods, Vol 1. Methods and devices. Pt A. New York, NY: Academic Press;1964. p. 169.
- Xu Y. Ferroelectric materials and their applications. Amsterdam, London, New York, Toronto: North-Holland; 1991.
- Ikegami S, Ueda I, Nagata T. Electromechanical properties of PbTiO3 ceramics containing La and Mn. J Acoust Soc Am. 1971;50:1060–1066.10.1121/1.1912729
- Uchino K. Ferroelectric devices. New York, NY: Marcel Dekker Inc.; 2000.
- Damjanovic D. L Lead-based piezoelectric materials. In: Safari A, Akdoğan EK, editors. Piezoelectric and acoustic materials for transducer applications. New York, NY: Springer; 2008. p. 59.10.1007/978-0-387-76540-2
- Levassort F, Holc J, Ringgaard E, et al. Fabrication, modelling and use of porous ceramics for ultrasonic transducer applications. J Electrocer. 2007;19:127–139.10.1007/s10832-007-9117-3
- Kar-Gupta R, Venkatesh TA. Electromechanical response of porous piezoelectric materials: effects of porosity distribution. Appl Phys Lett. 2007;91:062904.10.1063/1.2766960
- Kar-Gupta R, Venkatesh TA. Electromechanical response of piezoelectric composites: effects of geometric connectivity and grain size. Acta Mater. 2008;56:3810–3823.10.1016/j.actamat.2008.04.031
- Bosse PW, Challagulla KS, Venkatesh TA. Effects of foam shape and porosity aspect ratio on the electromechanical properties of 3–3 piezoelectric foams. Acta Mater. 2012;60:6464-6475.10.1016/j.actamat.2012.07.051
- Praveen Kumar B, Kumar HH, Kharat DK. Study on pore-forming agents in processing of porous piezoceramics. J Mater Sci Mater Electron. 2005;16:681–686.
- Praveenkumar B, Kumar HH, Kharat DK. Study on microstructure, piezoelectric and dielectric properties of 3–3 porous PZT composites. J Mater Sci Mater Electron. 2006;17:515–518.
- Lupeiko TG, Lopatin SS. Old and new problems in piezoelectric materials research and materials with high hydrostatic sensitivity. Inorganic Mater. 2004; Suppl. 1:S19–S32.10.1023/B:INMA.0000036326.98414.3c
- Liu W, Xu J, Lv R, et al. Effects of sintering behavior on piezoelectric properties of porous PZT ceramics. Ceram Internat. 2014;40:2005–2010.10.1016/j.ceramint.2013.07.110
- Huang JH, Kuo W-S. Micromechanics determination of the effective properties of piezoelectric composites containing spatially oriented short fibers. Acta Mater. 1996;44:4889–4898.10.1016/S1359-6454(96)00090-0
- Lewis RWC, Dent ACE, Stevens R, et al. Microstructural modelling of the polarization and properties of porous ferroelectrics. Smart Mater Struct. 2011;20:085002.10.1088/0964-1726/20/8/085002
- Aleshin VI. Domain-orientation contribution into constants of ferroelectric polydomain single crystal and piezo-ceramics. Zh Tekh Fiz. 1990;60:179–183 (in Russian).
- Smay JE, Tuttle B, III J. Robocasting of three-dimensional piezoelectric structures. In: Safari A, Akdoğan EK, editors. Piezoelectric and acoustic materials for transducer applications. New York, NY: Springer; 2008. p. 305.10.1007/978-0-387-76540-2