
 ?Mathematical formulae have been encoded as MathML and are displayed in this HTML version using MathJax in order to improve their display. Uncheck the box to turn MathJax off. This feature requires Javascript. Click on a formula to zoom.
ABSTRACT
While the performance of some emerging solar cell technologies is rocketing, there are other important parameters that also need to be considered for industrialization, including aesthetics, payback time or long-term stability. More specifically, aesthetical features of the solar cells play a very important role in the path towards the integration of these semi-transparent technologies into the buildings and windows of the future. In this work, we have implemented a theoretical methodology to study in depth colour tuning in polymer-based organic photovoltaic cells that uses experimentally complex refractive indices. We compare quantitatively basic interference effects (through active layer thickness), binaries with different donors and different acceptors, and ternary systems where the third component is either active or a simple dye. For hybrid perovskite solar cells, we compare the colour tuning capability of blending and alloying. Additionally, we show that the same theoretical framework can be employed for the so-called inverse problem, i.e. determining the best solar cell parameters (specific materials, donor:acceptor ratio and photoactive film thickness) that can reproduce a desired set of chromaticity coordinates.
Graphical Abstract
1. Introduction
Emerging solar cells exhibiting colour tunability or certain degree of transparency are potential candidates to become key elements on green buildings. These technologies include organic solar cells (OSCs), dye-sensitized solar cells and perovskite solar cells (PSCs) [Citation1,Citation2]. Typically, these technologies can be solution processed and therefore are often compatible with large-scale printing or coating techniques.
Besides semi-transparency, devices with a wide range of colour gamut are desirable to satisfy aesthetic purposes. The majority of publications dealing with emerging photovoltaic technologies focus on improving the power conversion efficiency [Citation3] and stability [Citation4], with much less attention paid, however, to their appearance and shape [Citation5]. A detailed study of the appearance of thin film solar cells requires to use the theory of chromaticity. Application of this theory to solar cells involves considering the contribution of four terms: illuminant, chemical structure of the active layer, device structure (and concomitant photonic effects) and eye detection. In the following, we describe these terms giving specific examples extracted from the field of organic and PSCs:
Illuminant. It corresponds to the theoretical lighting source of visible light defined by its spectral power distribution. The illuminant is typically a fixed variable for a given application. Among illuminant sources, standard daylight illuminant D65 is often chosen as model light for indoor conditions, while AM1.5G solar spectrum is the common choice as sunlight reference for colour determination. Although illuminants have different spectra, the colour appreciation tends to be very similar to a typical healthy human eye response. The corresponding International Commission on Illumination (CIE) coordinates for these illuminants are (x,y) AM1.5G = (0.3322,0.3443) and (x,y) D65 = (0.3129,0.3295).
Optical properties of the active layer materials. The chemical structure of the materials in the active layer determines their absorption spectrum. Varying the absorption characteristics of the active layer is an efficient approach to modify the cell colour. It requires either the synthesis of specifically designed photoactive materials or the combination of existing materials with different optical properties. For instance in the field of OSCs, Wong et al. have recently published a work using poly(3-hexylthiophene) (P3HT), poly [N-900-hepta-dec- anyl-2,7-carbazole-alt-5,5-(40,70-di-2-thienyl- 20,10,30-benzo-thiadiazole)] (PCDTBT), 2,6-Bis(trimethyltin)-4,8-bis(5-(2-ethylhexyl)thiophen-2-yl)benzo[1,2-b:4,5-b’]dithiophene (PBDTTT-C-T) and poly[4,8-bis(5-(2-ethylhexyl)thiophen-2-yl) benzo[1,2-b;4,5-b0]dithiophene-2,6-diyl-alt-(4-(2-ethylhexyl)-3-fluorothieno[3,4-b]thiophene-)-2-carboxylate-2–6-diyl) (PBDTTT-EFT) as donors and 6,6-phenyl C61-butyric acid methyl ester (PC61BM) and 6,6-phenyl C71-butyric acid methyl ester (PC71BM) as acceptors where distinct colour appearance is achieved through donor–acceptor combinations [Citation6]. Alternatively, the addition of small amounts of a coloured-dye compound (e.g. doping) [Citation7] to the photoactive materials blend can be used to fine-tune the cell appearance. As an example, the colour of the ternary spanned from blue-green to purple-red, chosen by controlling dye loading of photoactive dye molecule 2,4-bis-[(N,N-diisobutylamino)-2,6-dihydroxyphenyl]-4-(4-diphenyliminio) squaraine (ASSQ) within PCE10:N2200 binary system [Citation8]. In the field of PSCs, colour can be tuned by changing the halide ion, typically Br, Cl or I. In fact, the colour changes observed are attributed to band gap modifications due to structural distortion in the perovskite cage by the different size of the ions. For example, by engineering the Br/I ratio, perovskite thin films turn from red (I) to yellow (Br) [Citation9–Citation11]. Dyes can also be used in PSCs, within the photoactive layer or alternatively in other layers like in the hole transporting layer. More specifically, spiro-OMeTAD was modified with the addition of dye D102, making the device rose-tinted [Citation12].
Device structure/photonics. The device structure defines the distribution of the electric field within the different layers. Optical interference effects critically depend on the exact thicknesses of the layer stack and complex refractive indices of the materials thus can be exploited to modify the device appearance. There are two main approaches commonly followed to tune colour, namely varying the thickness of each layer or adding a multilayer stack. Metal-dielectric multilayers allow manipulating light by tuning the optical cavity resonances generated by variations in dielectric properties of films between thin metal layers [Citation13]. Dielectric multilayers with photonic crystal properties can also be used for this purpose. This approach has been implemented in different solar cell technologies, such as OSCs [Citation6,Citation14–Citation17], PSCs [Citation18–Citation20] or quantum dots [Citation21]. It is worth noting that OSC colour appearance can be modified by varying the thickness of the back contact electrode [Citation17,Citation22]. Upama et al. studied the colour appearance using CIE coordinates on OSCs based on a non-fullerene acceptor (NFA) and PBDB-T upon active layer thickness changes [Citation23]. In the case of PSCs, Lee et al. demonstrated highly performing coloured-perovskite devices showing blue, green and red appearance [Citation24]. Furthermore, perovskite colour can be tuned by using a methodology based on dielectric mirrors [Citation25]. This approach requires precise control of the dielectric film thickness, and thus colour tuning based on photonic structures might be challenging to implement in large-scale roll to roll process from solution.
Eye perception. This term refers to human eye colour perception, considered fixed, and is obtained by averaging the typical human eye response. Mathematically, the human eye colour perception is represented by the CIE XYZ tristimulus values [Citation26], which are analogous to the human eye sensibility to the main three colours (blue, green and red). Additionally, the Y value is also related to the brightness perception and is typically normalized between 0 for the darkest and 1 for the brightest. XZ values are related to the chromaticity. For simplicity, colours are often represented in 2D CIE space (x,y) by normalizing the sum of X, Y, Z.
To the best of our knowledge, only a few studies have been published regarding the theoretical design of colour appearance in solar cells assisted with fitting algorithms. A recent example is the work of Arinze et al. who optimized the degree of transparency, colour and photocurrent by means of a multi-objective algorithm. This study is based on the transfer matrix method (TMM) adjusting reflection and interference within quantum dot solar cells [Citation21].
In this manuscript, we theoretically evaluate the potential of different strategies to tune colour in organic and perovskite thin film solar cells. Specifically, for the case of OSC, we evaluate the potential of varying active layer thickness, photoactive materials composition ratio, the use of fullerene or NFAs, and ternary mixing. And for PSC, we compare simple blending with alloying. The implemented methodology is based on the TMM, and uses as input parameters the material/blend complex refractive index (CRI) (refractive index, n, and extinction coefficient, k) and the thickness of each layer. Interestingly, our methodology enables also to address the inverse problem, in which the materials and geometry that produce a targeted colour are obtained by a fitting routine. We demonstrate this by deducing device structures that can reproduce naturally occurring stone colours. The present study focuses on the optical properties within reasonable parameter bounds for non-negligible device performance. Full modelling of the electronic steps in the energy production goes, however, beyond the scope of this work.
2. Experimental details
2.1. Samples fabrication
Thin film samples of organic materials on top of glass substrates were manufactured in order to measure the optical constants and to validate the model. The donor materials used were P3HT, PCDTBT, PCPDTBT, PffBT4T-2OD (PCE-11), PTB7-Th, and as acceptors, we have looked at commonly employed fullerene derivatives PC61BM and PC71BM. The organic material solution was prepared with a concentration of 20 mg/mL in chlorobenzene:dichlorobenzene (1:1, volume ratio) and stirred overnight at 80 ºC. Subsequently, 60 μL of solution was knife coated over a glass substrate. The substrate was kept at 100 ºC during the deposition. The blade velocity was set to 40 mm/s and the substrate-blade gap fixed to 200 μm. Moreover, semi-transparent P3HT:PC61BM flexible samples were manufactured in Eurecat by slot die roll-to-roll technique. In the latter case, a pre-patterned ITO-coated on PET substrate was coated with P3HT:PC61BM (1:0.8, volume ratio) chlorobenzene solution at 54 mg/mL. The web speed was set to 1.4 m/min and the flow rate of the slot-die at 3 mL/min. After deposition, samples were dried in the oven at 140 ºC for 2 min. As P3HT:(PC61BM/PC71BM) is the most commonly R2R processed system in OPV, we have placed a special focus on the possibility of varying the colour of this system using the different strategies. The three pieces of stones used for the inverse problem were collected on the beach of Cambrils (Spain) in July 2017.
2.2. Sample characterization
The film thickness was measured by a mechanical profilometer P16+ from KLA Tencor. The thicknesses of mono-component organic materials varied from 50 to 165 nm which are the typical optimum thickness value of the photoactive layer that leads to high efficiencies. Transmittance spectra were measured with a Fourier-transform spectrophotometer (Bruker Vertex 70). Complex refractive indices were measured with a variable angle spectroscopic ellipsometer from Semilab Sopra GES5E. Modelling of the ellipsometry data was performed using the Winelli II software package from SOPRALAB.
2.3 Optical simulations
Optical simulations were based on TMM [Citation27] approach applied to three layers (optically thick glass, photoactive layer and air) implemented in MATLAB software. As illuminant source for colour perception, AM1.5G was selected. For the inverse problem, a fitting method based on genetic algorithms (GAs) was adapted from X. Blasco’s PhD Thesis [Citation28]. The GA starts with a first generation population of randomly generated pair of candidates (thickness and composition) of the active layer. Each thickness/composition pair corresponds to certain CIE coordinates which are calculated through the direct method described above. Typical size of each generation is 10 pairs. We have found that this number is often more critical than the number of generations for the algorithm to converge, 10 being a good compromise in terms of computing time. Then, the goodness of these candidates is evaluated by an error function defined as the Euclidean distance between each of the generated CIE coordinates and the target CIE coordinates (desired colour). The best 5 candidates of each generation are used as seed for the next generation of 10 new candidates, generated by the main three genetic operators selection, crossover (0.9 probability) and mutation (0.1 probability). In all cases, we found good convergence after 8 generations.
3. Results and discussion
We first describe the direct problem, in which thickness, volume concentration and specific materials are correlated with their corresponding CIE coordinates. This tool is helpful to explore and compare the colour possibilities offered by different approaches such as multicomponent mixing or interference effects. We then use the same mathematical framework to describe the inverse problem, in which the volume fraction and thicknesses that lead to the desired colour (defined by the CIE coordinates (x,y)) are deduced through an iterative fitting process. In order to solve the fitting problem, a GA is employed. This method reduces the possibilities of ending up on a local minimum of the multidimensional function by introducing new potential candidates based on the weighted genetic operators: selection, crossover and mutation.
3.1. Direct problem for OSCs
The direct problem establishes the relationship between the real parameters of the solar cell and its CIE colour coordinates. The device parameters selected for this study are film thickness and composition of the photoactive layer.
Colour CIE coordinates are calculated by convoluting three terms: a light source (illuminant, first term), reflectance or transmittance spectrum (absorption and photonic terms, second and third terms, respectively) and eye perception model (fourth term) (). The reflectance and transmittance spectra can be measured experimentally or simulated theoretically by TMM. To simplify the representation of chromaticity XYZ CIE coordinates, (x,y) coordinates are calculated by normalizing the sum of X, Y, Z CIE coordinates. Finally, calculated colour coordinates (x,y) are plotted in the CIE 1931 xy chromaticity diagram which is specially designed for the colours perceived by the human eye.
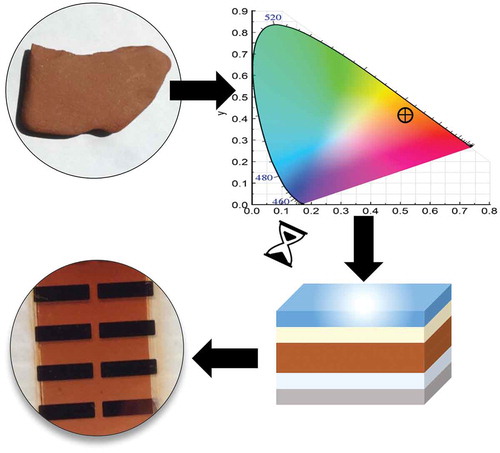
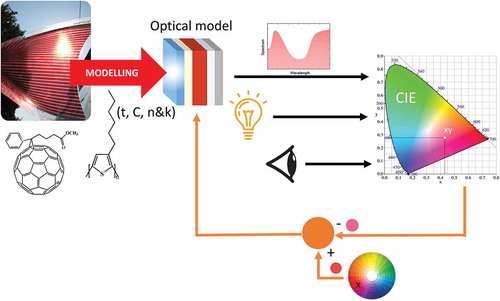
Figure 1. Schematic diagram of the colour solar cell prediction tool. TMM is employed to calculate the transmission and reflection of a given stack using as input parameters the complex refractive indices and thicknesses of all layers. These spectra are then convoluted with the light source and eye perception to define the corresponding CIE colour coordinates (x,y). The bottom part illustrates the inverse problem, which is a procedure to find solar cell parameters that yield a desired colour set point in (x,y) CIE coordinates.
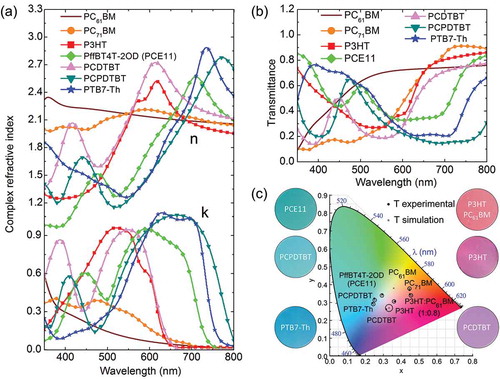
The input parameter needed to predict the colour of the solar cell is the CRI which is here extracted from ellipsometry. ) shows CRI spectra of the organic materials (donors and acceptors) used in the optical simulations. In particular, the donors P3HT, PCDTBT, PCPDTBT, PffBT4T-2OD (PCE-11) and PTB7-Th were selected because they yield efficiencies from 3% up to 11% when combined with acceptor materials and exhibit wide range of absorption peak positions (from 500 to 800 nm). As acceptors, the widely employed fullerenes in OSC were selected, namely PC61BM and PC71BM.
Figure 2. (a) Complex refractive index of the materials employed in the optical simulations obtained by ellipsometry PC61BM, PC71BM, P3HT, PCE11, PCDTBT, PCPDTBT and PTB7-Th. (b) Simulated transmittance spectra of the aforementioned materials. (c) CIE plot comparing CIE coordinates from simulated and measured transmittance spectra for the aforementioned materials. The error circle radius is 1% and 2% (PCPDTBT) around simulated CIE coordinates.
The next step is to simulate the transmission and reflection spectra. The former describes semi-transparent cells, whereas the latter is more appropriate in the case of opaque cells. To simplify the discussion, we have focussed on transmission, since roll to roll devices are normally semi-transparent as the opaque electrode (metallic grids) does not fully cover the active area of the device and hence could be employed in both, walls and windows (see, e.g. ). We note that interference effects would be much more pronounced in opaque cells observed in reflection.
) shows TMM simulated transmittance spectra of the organic materials whose CRIs are shown in ). These transmittance spectra are then used to compute the colour coordinates and compare them with the measured values obtained from experimental transmission data (see ) and ). The theoretical and experimental CIE coordinates for the photovoltaic materials match within 1% of error (defined as the Euclidean distance between theoretical and experimental CIE coordinates) which is lower than the human eye sensitivity for two similar colours. PCDTBT has, however, an error in CIE coordinates of 2% due to the transmittance sensitivity with film thickness. Predicted CIE coordinates also match the colour of the samples as observed in photographs taken with a digital camera.
Table 1. Thickness and error of CIE coordinates deduced from the measured and simulated transmittance spectra of the organic materials shown in ).
Thinner films (less than 100 nm) are generally located closer to white light point coordinate (x = 0.33, y = 0.33) in the CIE plot. Note that the neutral colour for CIE chromaticity diagram is given by its illuminant source. For all simulations, the AM1.5G spectrum was employed whose CIE coordinates are (x,y) = (0.33,0.34). The colour coordinates of thin films (less than 100 nm) of P3HT and PCE11 are located in the low colourfulness area in the CIE chromaticity diagram. This fact causes a lack of chromatic or neutral colour sensation when looking through these films. Thicker films tend, however, to be located close to the edges of the CIE plot which implies higher colour saturation, as expected (see also ).
Figure 3. (a) CIE coordinates sensitivity as function of volume ratio and thickness (50–400 nm) for P3HT:PC71BM. (b) Complex refractive index of the binary blend for different ratio between donor (P3HT) and acceptor (PC71BM). (c) Colour of binary blends based on PC71BM as acceptor (1:1, in volume) for APFO-Green, P3HT, PCDTBT, PTB7, PCPDTBT and DPPTTT. (d) Simulated complex refractive indices (Kramers–Kronig consistent) for two hypothetical dyes with different absorption maxima (at 450 nm for the black curve and at 600 nm for the red one).
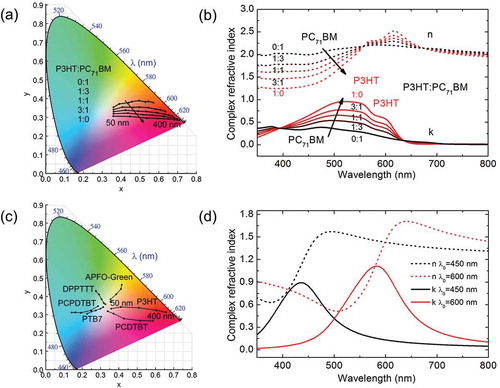
Once the method has been validated, we next analyse the potential of different parameters within the solar cell to vary the device colour. Please, note that throughout this section we span the parameter range as wide as possible in order to explore the colour gamut, but the reader should be aware that some of these combinations will not result in highly performing devices. We first start by inspecting active layer thickness and volume fraction between donor and acceptor materials. ) shows the simulation of colour dependence on thickness (from 50 to 400 nm) and volume fraction of the well-known blend P3HT:PC71BM from 0:1 to 1:0. The complex refractive indices of the blends were estimated using the Bruggeman effective medium approximation (EMA) [Citation29] and are shown in ) for the P3HT:PC71BM case. We would like to note that the CIE coordinates obtained using the EMA for the indices of the blend and those determined when using available experimentally determined refractive indices for the blends agree well with each other (within 1% of Euclidian distance in the CIE plot for the P3HT:PC61BM case). Blend film thickness is usually a critical parameter to obtain efficient solar cells, being the optimum typically around the first interference maximum (ca 100 nm). The relatively good transport properties of P3HT blends result in a rather wide operating thickness window, which can be varied from 100 to 300 nm without a significant drop in efficiency. For pristine PC71BM (P3HT) films, the appearance goes from light-brown (light reddish) to dark-brown (dark-red) as the thickness increases from to 50 to 400 nm. For thinner films, the colour coordinates of the blend are located close to the centre of the CIE plot and as the film becomes thicker, the corresponding colour saturates in a straight line towards the outer area of the CIE plot. For this system, the variation of the volume fraction results in a relatively smaller variation in colour compared to thickness (see )).
The relatively neutral colour of the studied fullerenes indicates that the choice of donor material determines the cell colour. ) shows the CIE coordinates for binary mixtures based on PC71BM and DPPTTT, APFO-Green, P3HT, PCDTBT, PTB7 and PCPDTBT as donors. We assumed a typical 1:1 donor:acceptor ratio and scanned film thicknesses between 50 and 400 nm. As shown in ), each donor offers a significantly different transmitted colour, ranging from yellow (APFO-Green), red/orange (P3HT), pink (PCDTBT), blue (PTB7), green/blue (PCPDTBT) to green (DPPTTT).
Next, we evaluate the potential of ternary mixing in widening the colour gamut in solar cells. Let us start with a teaser: a ternary of P3HT, PC71BM and the NFA IDTBR. The CIE coordinates as a function of composition for 50 and 100 nm thick films are shown in Figure SI 1. These ternaries would enable to tune the colour from reddish to almost blue.
In order to evaluate ternaries in a more systematic manner, we introduce a hypothetical dye with a single absorption peak in the visible range of the spectrum whose position is scanned. Mathematically, the dielectric function of the dye is parameterised using a Cauchy law to account for the contribution of UV resonances in the visible, and one Lorentzian peak defined by its wavelength position (λ), broadening and amplitude. This Kramers–Kronig consistent model has the benefit of its mathematical simplicity and, moreover, it allows testing several coloured-dye candidates by simply changing the Lorentzian peak position without changing the overall oscillator strength. The maximum extinction coefficient has been set to 1, as this is a very general value for organic semiconductors [Citation30]. Two examples of different hypothetical dyes are shown in ) for λ = 450 and 600 nm.
The model is employed to analyse the influence of the third component (dye) on the colour of the mixture based on several donors (P3HT, PCDTBT, PCE11) and PC71BM. The theoretical dye absorption peak centre was set to range from 380 to 750 nm. The dye is considered as a second acceptor and therefore the general formula used for the blend is donor:acceptor [Donor]:[PC71BMc + dye1−c]0.8, where c is the volume fraction between the PC71BM and dye varying from 0 to 1 ()). c = 0 corresponds to the binary blend made of donor:dye (1:0.8) and c = 1 is the donor:PC71BM (1:0.8) binary blend. Setting c = 0 is then an effective way of describing an ideal set of NFAs.
From –) it is clear that fixing the donor and varying the acceptor (e.g. NFA) would also strongly vary the blend colour. Thus, replacing neutral coloured fullerenes by strongly absorbing NFA has a strong potential for colour tuning. Ternary mixing, on the other hand, could potentially be a good approach for fine-tuning the colour or performance of the solar cells. As the composition of the ternary is varied from fullerene rich to NFA rich, the CIE coordinates strongly vary as one might expect due to the increasing contribution that the strong NFA absorption has on the overall active layer absorption. Since NFAs typically exhibit lower electron mobilities compared to fullerenes, adding the third component may disrupt the electrical properties of the active layer. Therefore, it would be useful to evaluate the amount of dye/NFA that is required to produce significant colour changes. For this, we chose three representative points in terms of colour in the CIE graph and quantified the volume fraction of dye needed to achieve the desired colour. These three colours represent blends with orange, pink and blue appearance. ) correlates the Euclidean distance in CIE coordinates for dye loading in the ternary blend systems based on (P3HT, PCDTBT and PCE11):(PC71BM:Dye).
Figure 4. Variation of composition of the CIE plot for ternary blends of donor 1:0.8 [PC71BM:dye] using as donor P3HT (a), PCDTBT (b) and PCE11 (c). The thickness is fixed to 100 nm. The plot represents the resulting CIE coordinates obtained by varying the dye wavelength position and volume ratio, c, between dye (c = 0) and acceptor PC71BM (c = 1). (d) Euclidean distance in CIE coordinates for pure 100 nm-dye at three wavelengths (450, 540 and 650 nm) as function of the volume fraction, c.
![Figure 4. Variation of composition of the CIE plot for ternary blends of donor 1:0.8 [PC71BM:dye] using as donor P3HT (a), PCDTBT (b) and PCE11 (c). The thickness is fixed to 100 nm. The plot represents the resulting CIE coordinates obtained by varying the dye wavelength position and volume ratio, c, between dye (c = 0) and acceptor PC71BM (c = 1). (d) Euclidean distance in CIE coordinates for pure 100 nm-dye at three wavelengths (450, 540 and 650 nm) as function of the volume fraction, c.](/cms/asset/3f036abc-aad4-42a2-aa79-4dca743fd9db/tsta_a_1530050_f0004_oc.jpg)
For the dye with maximum extinction at λ = 450 nm (orange coloured), a shift of 0.08 in CIE diagram requires 40%, 60% and 90% of dye loading for PCE11, PCDTBT and P3HT blends, respectively. In the case of the pink dye at λ = 540 nm, the PCE11 blends cannot achieve error below 0.06. This is because PCE11 exhibits neutral colour and by adding this dye a saturated pink on the basis of PCE11 cannot be obtained. On the other hand, blends based on PCDTBT are insensitive to the amount of dye and the error is always below 0.03. In contrast, for a P3HT-blend the error is reduced with an increasing amount of dye. Apparently, for the binary blend P3HT:dye the error is virtually the same which is found for PCDTBT:dye blends. This coincidence can be explained because blended P3HT and PCDTBT with PC71BM result in very close CIE coordinates for the blends. Finally, for the dye at λ = 650 nm (blue) PCE11 and PCDTBT again exhibit the same values of error. However, for P3HT blends it is easier to reach the bluish part of the CIE graph. In general, the colour change by the addition of a ternary compound to the binary blend is linear in the graph; moreover, to produce a sensitive colour variation, more than 20% of dye (or NFA) is required in the blend. For completeness, we have also looked at ternaries composed of a donor:PC71BM (1:0.8) blended with an insulating colour dye (see Supplementary information Figure S1). Reassuringly, this concept would also allow for large colour tuning. However, since the large fractions of insulating material needed to change colour are likely to disrupt transport properties, using a non-active dye to tune colour is probably discouraged by our simulations unless a material with a very high oscillator strength can be synthetized.
We define colour tuning effectiveness as the range of available colour possibilities that a material can present within a certain illumination plane. We determine it by calculating the covered area of CIE chromaticity diagram (). These values allow to quantify and compare different colour tuning strategies, namely, (1) modify the volume ratio and thickness for a given D:A pair; (2) change the donor material keeping the same acceptor; and (3) ternary blending. The simulations shown in were done setting a film thickness between 50 and 100 nm for easy comparison. Furthermore, we predict the covered area for binary blends as function of the cylindrical coordinates centred in the illuminant. Equation (1) represents a geometrical approximation for the CIE covered area as function of the angle (θD and θA) and distance (ρD and ρA) of the pristine donor and acceptor materials with the illuminant, respectively (see calculations on Table S1 and Figure S3 for an illustration of these parameters).
Table 2. Evaluation of covered area in CIE chromaticity diagram of the different strategies to tune the colour in thin film solar cells. Thicknesses were varied from 50 to 100 nm and from 50 to 400 nm (marked by an asterisk) and volume fraction from 0 to 1. The analysed strategies were thickness and volume ratio ()), changing donors ()), dye addition () and perovskite alloy ()).
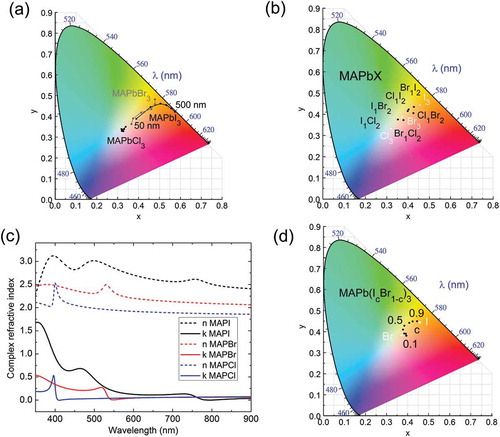
Figure 5. Perovskite colour-simulation based on methylammonium (MA) lead trihalide with different halogen anions such as iodide (I), bromide (Br) and chloride (Cl). (a) CIE diagram of pure perovskite type with thicknesses from 50 to 500 nm. (b) CIE diagram of 100 nm film of Bruggeman mixtures MAPbX3 (X = I, Cl, Br). Pure perovskite phase is plotted in filled white squares and mixtures in filled black circles. (c) Complex refractive indices of perovskite used for optical simulations. (d) CIE chromaticity diagram for 100 nm mixtures films approximated by parametric interpolation of the dielectric function of MAPbI3 and MAPbBr3 according to MAPb(Ic Br1−c)3 where c is the concentration of each phase. Colour coordinates for pure perovskite phase are plotted in filled white squares and shifted perovskite curve are plotted in filled black circles.
Notice that blends based on P3HT:PC71BM with varying film thickness and volume ratio have less colour variability compared to blends employing different donors with the same acceptor (PC71BM) and volume ratio (1:1). This can be explained by the limited chromaticity of P3HT compared with the wide gamut afforded by the different donor materials (such as PTB7 or PCDTBT). We observe that changing the donor for a fixed donor:PC71BM ratio is more effective in terms of colour tuning effectiveness than changing the volume ratio (as observed in the case of P3HT:PC71BM). Changing the ratio might only be effective when donor and acceptor have strong and complementary colours (and far from the centre of the CIE diagram). According to the results shown in , changing the donor material covers twice the area in the CIE chromaticity diagram compared to changing donor:acceptor ratio. Substitution of PC71BM by NFAs (as represented here by the dye), can also strongly increase the colour tuning capability. For instance, the binary blend of P3HT:NFA (dye, λ = 450 nm) is the most suitable combination to tune the colour of P3HT.
By adding a third coloured-component (dye) the range of colours covered increases twofold compared to a binary blend approach based on fullerene. Moreover, this enhancement in the covered area of CIE diagram appears on all ternary blends based on P3HT, PCDTBT and PCE11 with PC71BM as one of the acceptor materials. According to these results, ternary blends based on dyes are the most promising approach to modify colour in solar cells. Nevertheless, this last approach entails the addition of a third component which must be compatible with the energy levels and miscible with the initial pair of donor and acceptor materials. In fact, the performance of the potential devices cannot be predicted with the optical simulations.
3.2. Direct problem for PSCs
The introduced colour tuning methodology can also be applied to other solar cell technologies such as those based on hybrid perovskite active layers.
For hybrid organic–inorganic halide perovskite (CH3NH3PbX3) simulations, three inorganic anions (X = Br, Cl and I) were used. The previously published [Citation31] complex refractive indices for three types of perovskites are plotted in ). Depending on the chosen halide element, the onset of absorption shifts from 780 nm to 530 nm and 400 nm for iodide, bromide and chloride, respectively. To investigate the colour-thickness dependence, optical simulations from 50 to 500 nm were performed with these three types of perovskites ()). Iodide and bromide perovskites have the same colour trend as organic materials. For thin films (below 100 nm) associated CIE coordinates are located close to the central non-coloured point whilst for thicker films they tend to more saturated colours. In contrast, chloride-based perovskite simulated colours are located around the central point of the graph. This is due to the fact that this material is almost transparent in the visible according to our measured dielectric function.
) depicts CIE chromaticity diagram for perovskite mixtures assuming Bruggeman approximation and 100 nm thick layers. Mixtures based on methylammonium (MA) lead trihalide were chosen to test the applicability of this method to other solar cell technologies apart from organic materials. As it was expected, CIE coordinates of mixtures are located between those of pure perovskite phases. Different perovskite anion mixtures based on Bruggeman approximation can be only applied to predict the effective dielectric function if there are still pure perovskite domains of each of the perovskite phase in the final blend. Such structure results often when the perovskite film is manufactured by gas route by sublimating perovskite precursors [Citation32]. However, solution processed perovskite mixtures result in alloys whose dielectric functions are defined by band gap shifting of the absorption onset [Citation33] and therefore Bruggeman effective medium is not applicable. For this reason, we approximate the CRI by parametric interpolation of the standard critical points to reproduce perovskite intermediate phases MAPb(IcBr1−c)3, where MA stands for methylammonium (CH3NH3), between iodide and bromide whose onsets are 780 and 550 nm, respectively. The resulting complex refractive indices are shown in Figure S2. ) depicts the colour CIE coordinates for 100 nm films obtained by the band gap interpolation approach. Two main conclusions can be drawn. First, both, blending and alloying of hybrid perovskite produces only a limited colour gamut, centred around the red part of the CIE diagram. Unless other effects, such as interference, there is not predicted easy access to blue or green cells. Secondly, alloying does change colour effectively for iodine-rich stoichiometries, having a clear non-linear colour tuning capability with Br content.
3.3 Inverse problem
The so-called direct problem described in Section 3.2 allows to explore the potential that different manufacturing strategies have on the device appearance. On the other hand, one could compute all possible geometries and material combinations from a theoretical standpoint and look for specific combinations that produce a targeted colour or photonic response, the so-called inverse problem [Citation17]. In principle, this approach has the disadvantage that the computing time may escalate rapidly with the number of variables. Alternatively, we have chosen to use a fitting algorithm to solve the inverse problem, i.e. finding the photoactive layer parameters (thickness and volume ratio) that match the desired colour. Our approach finds the best pair/pairs of thickness layer and volume ratio in an efficient way by using a GA approach. We selected GA, since it allows finding multiple solutions for highly non-linear problems. The GA explores the whole search space and finds the best candidate based on the previous results.
To prove this methodology, the inverse problem was applied to find the best OSC parameters that match a brick piece sample used as a target colour. The reflectivity of the brick was measured and then the corresponding (x,y) CIE coordinates deduced (0.4117,0.3555). Subsequently, P3HT and PC71BM were chosen as material candidates to mimic the brick colour.
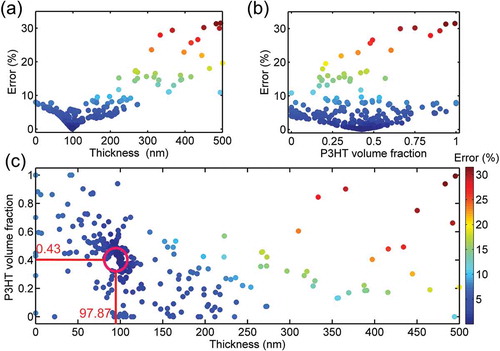
Active layer thickness is highly colour sensitive, being the best candidate around 100 nm ()), incidentally coinciding with the optimum efficiency. On the other hand, P3HT volume fraction ()) shows a smaller influence, with the optimum value being in the range between 0.4 and 0.5. Additionally, with all solutions of the GA, it is possible to establish a range of thicknesses and volume fractions where their CIE colour coordinates fall within a certain error value. This post-processing tool could be used in more complex scenarios to cluster solutions and then select the best candidates depending on efficiency or other parameters such as the amount of material used or the materials cost.
Figure 6. Summary of the inverse problem based on genetic algorithm fitting for P3HT:PC71BM binary blend and using a piece of brick as colour reference (a) error (Euclidean distance in CIE coordinates) as function of thickness. (b) Error as function of P3HT volume fraction. (c) Error mapping as function of P3HT volume fraction and thickness. Red circle highlights the solar cell parameters (volume fraction and thickness) which mimic the brick colour. The error scale for (a) and (b) is the same as (c).
We have extended the application of the developed method to three typical materials found in the construction industry, namely, brick, marble and slate. The aim is to reproduce natural occurring colours with organic material combinations available in OSC. For that, three natural stones mimicking these materials have been used as references.
For each stone colour, several combinations of donor:acceptor mixture were tested and the results shown in . shows the CIE plot with the comparison of the coordinates of coloured stones and the CIE coordinates of the solutions of the inverse problem.
Table 3. Summary of the inverse problem results for different donors and target CIE coordinates used in .
Figure 7. Inverse problem for OSC reproducing natural colours. CIE chromaticity diagram of three coloured stones set as targets. Optical simulations based on the genetic algorithm are represented as black dots (see for details).
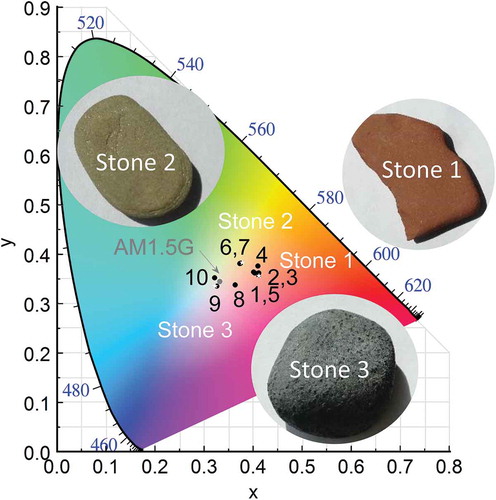
reveals that for a given material it is not possible to achieve all range of desired colours. More specifically, P3HT-based blends cannot reproduce colours of Stones 2 and 3, having errors of 3% and 4%, respectively. However, for P3HT mixtures it is easier to reproduce reddish colours (Stone 1), as observed in simulation number 2, with 100 nm of thickness and 22% of volume fraction ratio and with only 0.2% of error in CIE coordinates. Blends based on APFO-Green and DPPTTT with PC71BM can reproduce the chromaticity of Stone 2 with 100 and 194 nm, respectively. Stone 3 exhibits less vivid colour, this means that its colour coordinate is located close to the illuminant CIE coordinates (AM1.5G). For CIE target near central coordinates, 50 nm was set as a lower limit of the variable space to avoid trivial solutions (e.g. zero thickness). Therefore, the best candidates of PC71BM mixtures based on P3HT and DPPTTT correspond to the lowest available thickness. However, PTB7 blend offers different alternatives than the most trivial one which is a 170-nm film with 38% of donor concentration.
4. Conclusions
We developed a methodology to explore the potential of several strategies to change the colour of photovoltaic devices according to target colours of interest in architecture. The strategies included simple interference effects (evaluated by active layer thickness), the blend composition, blend materials (e.g. different donors or the use of NFAs), and ternary mixing. We defined two parameters to help in the comparison of strategies, namely, the percentage of dye needed to obtain a given colour in a multicomponent system, and the area covered by tuning the parameter space for a given strategy.
The methodology was satisfactorily validated by comparing (x,y) CIE coordinates deduced from experimental and calculated transmittance. Moreover, the validation was performed for pristine and blended materials.
We found that the addition of a coloured-dye as part of a ternary blend (or replacing the fullerene altogether) turned out to be the most efficient approach to change the colour as quantified in terms of covered area in the CIE chromaticity diagram. Since a relatively large amount of third component is needed (>20%) to significantly change colour, it is likely that the three materials should be active in order to maintain the electronic properties. On the other hand, when focusing on binaries, replacement of fullerenes by NFAs can lead to a larger colour gamut. Changing the donor:acceptor ratio is a relatively poor strategy to change colour for fullerene based OPVs, but could provide CIE tunability for donor and acceptor molecules with complementary absorptions if performance does not need to be the highest for the given combination. Mixing and alloying hybrid perovskite films appear to have a more limited colour tuning capability than the case of organic films unless several strategies are combined. We note, however, that semi-transparent perovskite cells have been reported recently in the literature [Citation34].
Finally, the inverse problem allows finding the best combination of thickness and blend concentration that matches a targeted colour. To demonstrate the potential of this methodology, we have evaluated a variety of materials, composition and thicknesses to achieve the colour of different stones, including representative examples of brick, marble and slate.
Supplemental Material
Download MS Word (1.4 MB)Acknowledgments
The authors thank Vera Campoy Espanol for helping to collect the stones.
Disclosure statement
No potential conflict of interest was reported by the authors.
Supplementary material
Supplementary data can be accessed here.
Additional information
Funding
Related Research Data
References
- Tai Q, Yan F. Emerging semitransparent solar cells: materials and device design. Adv Mater. 2017;29(34):1–37.
- Lee KT, Guo LJ, Park HJ. Neutral- and multi-colored semitransparent perovskite solar cells. Molecules. 2016;21(4):475.
- Janssen RA, Nelson J. Factors limiting device efficiency in organic photovoltaics. Adv Mater. 2013;25(13):1847–1858.
- Guerrero A, Garcia-Belmonte G. Recent advances to understand morphology stability of organic photovoltaics. Nano-Micro Lett. 2017;9(1).
- Valimaki M, Apilo P, Po R, et al. R2R-printed inverted OPV modules–towards arbitrary patterned designs. Nanoscale. 2015;7(21):9570–9580.
- Wong YQ, Meng H-F, Wong HY, et al. Efficient semitransparent organic solar cells with good color perception and good color rendering by blade coating. Org Electron. 2017;43:196–206.
- Sivakumar G, Pratyusha T, Gupta D, et al. Doping of hole transport layer PEDOT: PSS with pentacene for PCDTBT: PCBM based organic solar cells. Mater Today: Proc. 2017;4(7):6814–6819.
- Kong J, Mohadjer Beromi M, Mariano M, et al. Colorful polymer solar cells employing an energy transfer dye molecule. Nano Ener. 2017;38(May):36–42.
- Cui D, Yang Z, Yang D, et al. Color-tuned perovskite films prepared for efficient solar cell applications. J Phys Chem C. 2016;120(1):42–47.
- Eperon GE, Stranks SD, Menelaou C, et al. Formamidinium lead trihalide: a broadly tunable perovskite for efficient planar heterojunction solar cells. Energy & Environmental Science. 2014;7(3):982.
- Suarez B, Gonzalez-Pedro V, Ripolles TS, et al. Recombination study of combined halides (Cl, Br, I) perovskite solar cells. J Phys Chem Lett. 2014;5(10):1628–1635.
- Eperon GE, Burlakov VM, Goriely A, et al. Neutral color semitransparent microstructured perovskite solar cells. ACS Nano. 2014;8(1):591–598.
- Liu Q, Romero-Gomez P, Mantilla-Perez P, et al. A two-resonance tapping cavity for an optimal light trapping in thin-film solar cells. Adv Energy Mater. 2017;7(18):1700356.
- Wen L, Chen Q, Sun F, et al. Theoretical design of multi-colored semi-transparent organic solar cells with both efficient color filtering and light harvesting. Sci Rep. 2014;4:7036.
- Upama MB, Wright M, Elumalai NK, et al. High performance semitransparent organic solar cells with 5% PCE using non-patterned MoO3/Ag/MoO3 anode. Curr Appl Phys. 2017;17(2):298–305.
- Xu G, Shen L, Cui C, et al. High-performance colorful semitransparent polymer solar cells with ultrathin hybrid-metal electrodes and fine-tuned dielectric mirrors. Adv Funct Mater. 2017;27(15):1605908.
- Betancur R, Romero-Gomez P, Martinez-Otero A, et al. Transparent polymer solar cells employing a layered light-trapping architecture. Nat Photonics. 2013;7(12):995–1000.
- Zhang W, Anaya M, Lozano G, et al. Highly efficient perovskite solar cells with tuneable structural color. Nano Lett. 2015;15:1698–1702.
- Lu J-H, Yu Y-L, Chuang S-R, et al. High-performance, semitransparent, easily tunable vivid colorful perovskite photovoltaics featuring Ag/ITO/Ag microcavity structures. J Phys Chem C. 2016;120(8):4233–4239.
- Jiang Y, Luo B, Jiang F, et al. Efficient colorful perovskite solar cells using a top polymer electrode simultaneously as spectrally selective antireflection coating. Nano Lett. 2016;16(12):7829–7835.
- Arinze ES, Qiu B, Palmquist N, et al. Color-tuned and transparent colloidal quantum dot solar cells via optimized multilayer interference. Opt Express. 2017;25(4):A101–A112.
- Chen K-S, Salinas J-F, Yip H-L, et al. Semi-transparent polymer solar cells with 6% PCE, 25% average visible transmittance and a color rendering index close to 100 for power generating window applications. Energy & Environmental Science. 2012;5(11):9551.
- Upama MB, Wright M, Elumalai NK, et al. High-efficiency semitransparent organic solar cells with non-fullerene acceptor for window application. ACS Photonics. 2017;4(9):2327–2334.
- Lee K-T, Fukuda M, Joglekar S, et al. Colored, see-through perovskite solar cells employing an optical cavity. J Mater Chem C. 2015;3(21):5377–5382.
- Ramirez Quiroz CO, Bronnbauer C, Levchuk I, et al. Coloring semitransparent perovskite solar cells via dielectric mirrors. ACS Nano. 2016;10(5):5104–5112.
- Commission internationale de l'Eclairage proceedings, 1932. Cambridge: Cambridge University Press
- Pettersson LAA, Roman LS, Inganäs O. Modeling photocurrent action spectra of photovoltaic devices based on organic thin films. J Appl Phys. 1999;86(1):487–496.
- Blasco Ferragud FX. (1999). PhD thesis. Control predictivo basado en modelos mediante técnicas de optimización heurística. Aplicación a procesos no lineales y multivariables. Universitat Politècnica de Valéncia. Instituto Universitario de Automática e Informática Industrial. Valencia, Spain
- Bruggeman DAG. Berechnung verschiedener physikalischer Konstanten von heterogenen Substanzen. I. Dielektrizitätskonstanten und Leitfähigkeiten der Mischkörper aus isotropen Substanzen. Annalen der Physik. 1935;416(7):636–664.
- Vezie MS, Few S, Meager I, et al. Exploring the origin of high optical absorption in conjugated polymers. Nat Mater. 2016;15(7):746–753.
- Leguy AM, Azarhoosh P, Alonso MI, et al. Experimental and theoretical optical properties of methylammonium lead halide perovskites. Nanoscale. 2016;8(12):6317–6327.
- Longo G, Momblona C, La-Placa M-G, et al. Fully vacuum-processed wide band gap mixed-halide perovskite solar cells. ACS Energy Lett. 2018;3(1):214–219.
- Gil-Escrig L, Miquel-Sempere A, Sessolo M, et al. Mixed iodide-bromide methylammonium lead perovskite-based diodes for light emission and photovoltaics. J Phys Chem Lett. 2015;6(18):3743–3748.
- Liu D, Yang C, Lunt RR. Halide perovskites for selective ultraviolet-harvesting transparent photovoltaics. Joule. 2018;2(9):1827–1837.