
 ?Mathematical formulae have been encoded as MathML and are displayed in this HTML version using MathJax in order to improve their display. Uncheck the box to turn MathJax off. This feature requires Javascript. Click on a formula to zoom.
ABSTRACT
Models describing the constitutive flow behaviour of a metallic material are desired for appropriate process design and realization of defect-free components. In this study, constitutive equations based on the hyperbolic-sinusoidal Arrhenius-type model have been developed to define the hot deformation characteristics of a CoCrFeMnNi high-entropy alloy. The experimental true stress-true strain data were generated over a wide temperature (1023–1423 K) and strain rates (10−3–10 s−1) ranges. The impact of strain rate and temperature on deformation behaviour was further characterized through a temperature compensated strain rate parameter, i.e. Zener-Hollomon parameter. Additionally, a mathematical relation was employed to express the influence of various material constants on true-strain ranging from 0.2 to 0.75. Typical third order polynomial relations were found to be appropriate to fit the true-strain dependency of these material constants. The accuracy of the developed constitutive equations was evaluated by using the average absolute relative error (AARE) and correlation coefficient (R); the obtained values were 7.63% and 0.9858, respectively, suggesting reasonable predictions. These results demonstrate that the developed constitutive equations can predict the flow stress behaviour of the alloy with a good accuracy over a wide range of temperature and strain rate conditions and for large strains.
Graphical abstract

1. Introduction
In general, the conventional alloy design comprises one or two principle alloying elements and may include various other alloying elements in a required proportion in order to achieve the desired properties. In contrast, the high-entropy alloys (HEAs) are a new class of multi-metallic materials that comprise alloying of four or more principle elements in equi-atomic proportions [Citation1–Citation4]. The primary intention of HEA design is to achieve a single-phase solid solution through high configurational entropy of mixing [Citation1]. This new concept of alloy design has shifted the search space for new alloys from the corners of the phase diagrams to their centres. Additionally, there are several variants added to the new design approach including facilitation of multiphase systems, formation of intermetallic phases and/or precipitates, etc., with near and/or non equi-atomic compositions [Citation5–Citation11]. Due to the enormous space and possibilities of numerous alloy compositions, the HEAs are divided into several systems such as face-centred cubic (fcc) structure – based strong and ductile HEAs, body-centred cubic (bcc) structure – based refractory HEAs, hexagonal closed packed (hcp) structure – based HEAs, light weight HEAs and finally, precious-metal functional HEAs. The number of HEA compositions under investigation is increasing steadily due to the ever-growing interest and research efforts in this field, particularly driven by their superb properties [Citation12]. Notable among the exceptional mechanical properties are high strength at elevated temperatures, excellent cryogenic toughness [Citation13–Citation16], high wear resistance [Citation17–Citation19], good thermal stability [Citation20–Citation22], excellent fracture toughness [Citation14,Citation23,Citation24] and superior corrosion resistance [Citation25]. Thus far, CoCrFeMnNi is the most studied HEA [Citation26–Citation30] and is also called as ‘Cantor alloy’ named after Cantor et al. [Citation2] for their first studies of the alloy. CoCrFeMnNi exhibits a single-phase fcc solid solution in a wide temperature range (>1073 K) [Citation28,Citation31,Citation32] and has shown outstanding ductility at cryogenic temperatures [Citation26,Citation27].
The hot deformation studies illustrating the constitutive flow behaviour of CoCrFeMnNi HEA are limited. Jeong et al. [Citation33] have reported high-temperature hot deformation behaviour of a cast and homogenized CoCrFeMnNi HEA (average grain size 419 µm) in the temperature and strain rate regimes of 1023–1323 K and 10−3 s−1to 10 s−1, respectively, and developed processing maps. Eleti et al. [Citation34], on the other hand, have reported high-temperature deformation characteristics of a hot forged (1023 K) CoCrFeMnNi HEA compressed at different temperatures (1073 K, 1173 K and 1273 K) and strain rates (10−3 s−1, 10−2 s−1 and 1 s−1). While Jeong et al. [Citation33] determined the activation energy of deformation (Q) to be about 312 kJ/mol for CoCrFeMnNi HEA, the corresponding calculations by Eleti et al. [Citation34] based on a narrow temperature range gave a higher value of 350kJ/mol. Stepanov et al. [Citation35] and Eleti et al. [Citation34] have reported an account of the grain refinement due to the occurrence of dynamic recrystallization (DRX) during hot deformation of CoCrFeMnNi alloy. Otto et al. [Citation29] have calculated the activation energy for grain growth to be about 325kJ/mol, which happens to be closely similar to the reported activation energy of diffusion of Ni in CoCrFeMnNi HEA i.e. 317 kJ/mol [Citation36] and 321.7 kJ/mol [Citation37].
So far there existed several constitutive models that are proposed to characterize the flow behaviour of alloys [Citation38]. These models are used to establish constitutive equation to describe the flow behaviour under various hot working conditions. Among the proposed models the Johnson-cook (JC) [Citation39] model and Zerelli–Armstrong (ZA) [Citation40] model are the most pronounced models to characterize the deformation behaviour of alloys. Additionally, a hyperbolic sinusoidal Arrhenius-type equations proposed by Sellars & McTegart [Citation41] which adapted a wide range of flow stresses. Later the Zener-Holloman parameter was introduced into these Arrhenius-type equations that are used to express the relationship between the strain rate and temperature. These hyperbolic sinusoidal Arrhenius-type equations are found to predict the flow stress accurately over a wide range of hot deformation conditions [Citation42]. Eleti et al. [Citation34] and Jeong et al. [Citation33] had used the hyperbolic sinusoidal Arrhenius-type expressions to obtain the constitutive equations of CoCrFeMnNi HEA. However, the derived constitutive equations were restricted to only a select true strain (0.9 [Citation34] and 0.6 [Citation33]). Since then, there has been no attempt to establish the constitutive equations in which the influence of true strain is incorporated using the strain iterative method over a wide range of temperatures and different constant true-strain rates for CoCrFeMnNi or other HEAs.
The objective of this work is to characterize the high-temperature deformation behaviour of CoCrFeMnNi HEA through isothermal compression testing in the hot working temperature range of 1023–1423 K at different constant true-strain rates in the range 10−3–10 s−1 on a Gleeble simulator. The emphasis was essentially put on understanding the effects of processing parameters on the deformation behaviour and establishing the constitutive equations using hyperbolic-sinusoidal Arrhenius-type equations to be able to describe the flow stress behaviour of the alloy. The aim was to develop strain-compensated constitutive equations, in which the impact of true strain could be incorporated over a wide strain range.
2. Experimental methods
2.1. Materials and processing
The HEA CoCrFeMnNi containing 20 at. % of each constituent element was cast into a rectangular ingot (~140 × 40 × 40 mm), weighing ~2 kg, by drop casting in argon atmosphere at KIMAB AB, Sweden. The raw materials used were 99.9% pure elemental powders. The ingot prior to solidification was held in the liquid state for ~1 min to ensure that the entire cast is melted and to promote homogeneous mixing. Later it was homogenized at 1423 K for 12 h in argon atmosphere to increase the chemical homogeneity, followed by cooling inside the furnace to room temperature. The homogenized sample was subsequently reheated at 1273 K for 15 min and hot rolled in several passes. After every rolling pass, the alloy was held in furnace until the rolling temperature was reached. The sample was rolled to a final thickness of 11 mm along the cross-section. Cylindrical specimens of dimensions ~ ϕ 8 mm × 10 mm (aspect ratio 1.25) were extracted along the transverse-normal (T-N) direction from the hot-rolled CoCrFeMnNi HEA using a wire-cut electric discharge machine (EDM).
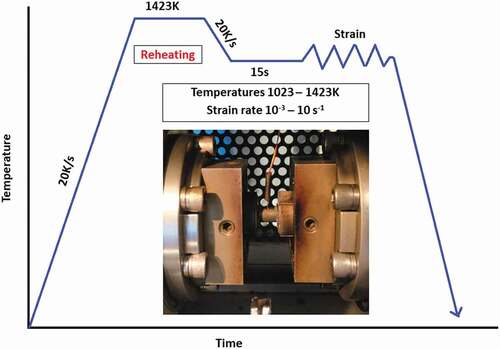
Hot compression tests were performed in a Gleeble 3800® thermomechanical simulator. illustrates the hot compression schedule, including the reheating and cooling paths. The specimens were reheated to 1423 K at 20 K/s, held for 5 min, and then cooled at 20K/s to the deformation temperature. Once the specimens reached the desired deformation temperature in the range 1023–1423 K, they were held for 15 s to even out the temperature, followed by single-hit compression tests to a true strain of ~0.8 at different constant true strain rates in the range 10−3–10 s−1. In order to monitor the temperature of the samples, thermocouples were spot welded at the centre of the samples on the curved surfaces as per the manufacturer’s recommended technique. A graphite foil was used as a lubricant on the parallel faces of the specimens to reduce friction and barrelling effects during compression. Additionally, a tantalum foil was used to reduce the friction and minimize the temperature gradient and to prevent sticking of the metal specimens to the tungsten carbide anvils during the tests. The specimens were fast cooled to room temperature using compressed air after completing the tests.
Figure 1. Schematic diagram showing the experimental procedure and simulation conditions prior to hot compression testing and cooling in air
2.2. Sample preparation and characterization
The deformed specimens were sectioned at mid-plane parallel to the compression axis and mounted and polished using standard metallographic procedure for microstructural characterization. The samples were first rough-polished using successive abrasive SiC papers followed by fine polishing with 3 and 1 µm diamond suspensions in succession. The crystal structure of the samples was characterized by X-ray diffraction (XRD) in a PANalytic Empyrean Multipurpose Diffractometer (Malvern Panalytical Ltd, Netherlands) with Co-Kα radiation, operated at 40 kV and 45 mA. The data were collected between 40-130° (2θ) with a step size of 0.013°.
For light optical microscopy, the samples were etched using Kallings II reagent. Preliminary characterization of microstructures of select samples was done in an optical microscope (Leica DM 2500, Leica microsystems CMS GmbH, Germany). Additionally, the samples were also analysed using a Zeiss ULTRAplus (Carl Zeiss AG, Germany) field emission scanning electron microscope (FESEM) equipped with Oxford Instruments X-MaxN 80 energy dispersive X-ray spectroscope (EDS) for the elemental analysis and Oxford Instruments’ Symmetry® electron back scatter diffraction (EBSD) detector for crystallographic analysis, based on the state-of-the-art complex metal–oxide–semiconductor (CMOS) technology. The samples used in EBSD measurements were polished using a colloidal silica suspension (0.04 µm) as per the recommended final step. An acceleration voltage of 20kV was used with a step size of 0.4 µm to acquire the EBSD data. A Channel 5 data analysis package was used to construct the EBSD maps using the acquisitioned data. The data evaluation was done using a Matlab® 2018a programming platform and plots were made using the Origin® 2017 software.
In the EBSD analysis, a misorientation angle of 15° was considered to delineate high-angle boundaries for the grain size determination and grains with less than 10 pixels were rejected for noise reduction. In addition, the grain boundary regions were excluded from the grain size determination.
3. Results and discussion
3.1. Initial microstructures
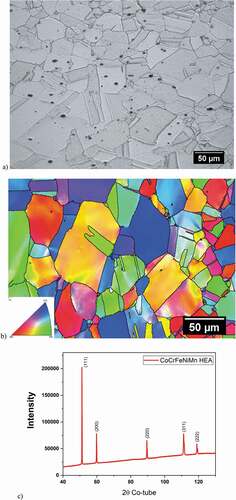
shows the chemical composition of alloy hot rolled to 11-mm thickness, the error of the mean was obtained by averaging three area EDS measurements in the visible microstructures. The hot-rolled CoCrFeMnNi HEA was evaluated in respect of microstructure and the corresponding optical micrograph, EBSD inverse pole figure (IPF) maps and XRD peaks are shown in , respectively. The average grain size evaluated from the EBSD maps was ~12.6 µm (including Σ3 twin boundaries). As expected, the EBSD analysis and XRD peaks confirm the presence of fcc phase in the material.
Table 1. Chemical composition of the hot rolled CoCrFeMnNi HEA obtained by EDS analysis (at %.)
Figure 2. (a) Optical micrograph; (b) EBSD IPF map; (c) XRD data of the hot rolled CoCrFeMnNi HEA, showing the characteristic peaks of the fcc
3.2. Flow stress behaviour
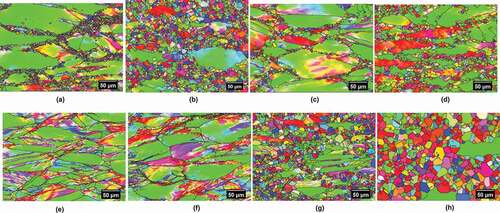
The true stress-true strain curves obtained from isothermal compression tests at various temperatures (1023–1423 K) and strain rates (10−3s−1–10s−1) are shown in . From the plots, it is clear that the flow stress is strongly dependent on the imposed experimental variables, i.e. strain rate and the deformation temperature. In the initial strains (up to ~0.25) at 1023 K and 1073 K, the flow stress seems to be less sensitive to the strain rates. The flow stress at low strain rates (10−3, 10−2, 10−1 s−1), irrespective of test temperature, showed characteristic peak stress behaviour with flow softening typical of dynamic recrystallization (DRX), which is usually encountered during hot deformation of fcc metals and alloys with intermediate or low-stacking fault energies (SFEs). ) shows necklace-like structures composed of equiaxed grains along the grain boundaries; these equiaxed grains confirm the occurrence of DRX and thus the flow stress is observed to be softened after reaching the peak stress. Similarly, in typical peak stress behaviours can be seen, but the increase in temperature and decrease in strain rate increase the volume fraction of DRX grains. In ) for 1173K/10−3 s−1 sample, the volume and size of equiaxed grains increased in comparison to that seen in 1023K/10−3 s−1 sample.
Figure 3. True stress – true strain curve at different rates at (a) 1023 K (b) 1073 K (c) 1123 K (d) 1173 K (e) 1223 K (f) 1273 (g) 1323 K (h) 1373 K and (i) 1423 K
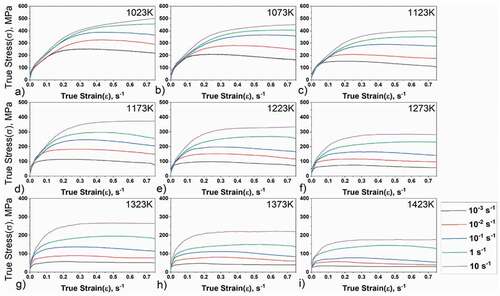
Figure 4. EBSD IPFs of the specimens showing the recrystallized regions in the hot rolled specimens, which were isothermally compressed up to 0.8ε deformed at different temperatures and strain rates: (a) 1023K/10−3s−1, (b) 1173K/10−3s−1, (c) 1223K/10−1s−1, (d) 1323K/10−1s−1, (e) 1023K/1s−1, (f) 1123K/10s−1, (g) 1323K/10s−1, and (h) 1423K/10s−1
The increase in the flow stress during the early stage of straining is due to work hardening caused by the dislocation generation and multiplication, causing an enhanced dislocation density with thick-walled sub-grain formation, until the strain exceeds the critical strain (εc). At this stage, the original grains are replaced with new grains prompting the beginning of the DRX process and the formation of nuclei is assumed to be dependent on the substructure cell size and the related cell wall density. DRX is marked by flow softening behaviour in the beginning, followed by a steady-state flow behaviour and is considered to be a dynamic process of nucleation and migration of new strain-free grains during further straining. The average DRX grain size is nearly constant containing somewhat higher dislocation density due to the formation of substructure. Therefore, it was considered reasonable to believe that DRX might be the softening mechanism with the increase in strain, as the flow stress decreased [Citation43]. This decrease in flow stress after the peak stress is discernible only at low strain rates (10−3–10−1 s−1).
At higher strain rates (10 and 1 s−1), the flow stress increased with increase in strain at temperatures ≤1123 K essentially due to enhanced strain hardening with deformation. shows the presence of elongated grains which depict that the material was strain hardened. There are less or almost no equiaxed grains in ) and very small quantity in ). At higher strains (~0.75), the flow stress tends to become uniform. However, at higher temperatures ≥1173 K, the flow stress reaches a maximum value, beyond which it remains nearly constant presumably due to a dynamic balance between work hardening and dynamic recovery and maintains a steady flow stress with the increase in strain. It is seen in that an increase in temperature at high strain rate (10 s−1) increases the volume and size of the equiaxed grains, which probably renders the flow stress behaviour uniform, because the flow curves at the respective test conditions are practically steady-state and do not show softening behaviour typical of DRX (as shown in ). However, we can observe new, continuously recrystallizing grains during deformation. Additionally, the small grains that are nucleating and growing along the grain boundaries may not have a significantly different flow stress, and that is the reason the flow stress is not changing with strain.
3.3. Constitutive equations
High-temperature plastic flow in metallic materials is the primary process that governs the product quality of advanced manufacturing technologies such as hot rolling, extrusion, and welding. The ability to shape the material by the plastic flow without any failure (cracking/fracture) is known as workability. The understanding of the workability is required for developing the science-based mechanical processing. Workability study comprises of state-of-stress (SOS) workability and intrinsic workability. The SOS workability depends upon stress state of the deformed zone in which workpiece is subjected to three-dimensional stress state. The intrinsic workability of a material is influenced by initial microstructure, and applied deformation conditions (applied temperature, strain and strain rate). The material response due to deformation conditions can be represented mathematically as constitutive equations [Citation44]. The constitutive equations are useful in understanding the flow stress behaviour and estimating the activation energy of hot deformation (Q), besides determining various material constants. Using the data, the flow stress can be predicted at different temperatures, strain rate and strain within the limits of hot deformation.
3.3.1 Arrhenius type constitutive equation
The constitutive relationship describing the flow stress behaviour during hot deformation can be expressed using Arrhenius-type equation [Citation45]. The corresponding temperature and strain rate dependence of plastic deformation can be analysed using the Zener–Holloman parameter (Z), also known as temperature compensated strain rate and is especially applicable for high-temperature deformation [Citation46,Citation47]. The respective constitutive equation can be expressed as
EquationEquation (1)(1)
(1) can also be written as
Where A, α, and n are temperature independent material constants, R is the universal gas constant (8.314 J/(mol K)), T is temperature in K, and Q is the apparent activation energy of deformation (J/mol), is strain rate (s−1) and σ is true stress (MPa). EquationEquation (2)
(2)
(2) can be expressed in three different formats depending on the stress levels: power function for low stress (EquationEquation 3
(3)
(3) ); exponential function for high stress (EquationEquation 4
(4)
(4) ); and hyperbolic sine function for any stress (EquationEquation 5
(5)
(5) ).
Here A1 and A2, are material constants, and n, β, n´ are related to strain rate sensitivity index. The EquationEquations (3(3)
(3) –Equation5
(5)
(5) ) can be written as
Therefore, material constants n′ and β are the slopes of the linear fits of ln vs ln σ and ln
vs σ plots respectively, and α = β/n´. The constant n is the slope of the linear fit of ln
vs ln [sinh (ασ)] plot; β, n and n’ are slopes of linear fits in . The apparent activation energy Q for the plastic deformation can be expressed from EquationEquation (8)
(8)
(8) as
Figure 5. Plots of (a) ln vs σ; (b) ln
vs lnσ; (c) ln
vs ln[sinh(ασ)]; (d) 10,000/T vs ln[sinh(ασ)] to derive the constitutive equation for the CoCrFeMnNi at 0.6(ε) strain level
![Figure 5. Plots of (a) ln ε˙ vs σ; (b) ln ε˙ vs lnσ; (c) ln ε˙ vs ln[sinh(ασ)]; (d) 10,000/T vs ln[sinh(ασ)] to derive the constitutive equation for the CoCrFeMnNi at 0.6(ε) strain level](/cms/asset/d95195e3-77e7-4ff0-aa32-6e73a87fb715/tsta_a_1714476_f0005_oc.jpg)
where the value is the slope of linear fits in ). The value of lnA can then be evaluated by the intercept of the linear fit on the y-axis () [Citation46]. EquationEquation (1)
(1)
(1) can be expressed as EquationEquation (10)
(10)
(10) by taking logarithm of either sides describing the relation between the flow stress σ and Zener-Holloman parameter Z.
Figure 6. Plot of ln Z vs ln [sinh(ασ)] to evaluate ln A
![Figure 6. Plot of ln Z vs ln [sinh(ασ)] to evaluate ln A](/cms/asset/50b4d3bb-9993-4113-b8c7-52cd897a9f95/tsta_a_1714476_f0006_oc.jpg)
Using the material constants (n′, β, α, n, Q) in the constitutive equation, the flow stress can be defined as a function of Zener-Holloman parameter considering the EquationEquations (1)(1)
(1) and (Equation5
(5)
(5) ) as follows:
The n-values vary with the temperature and strain rate. To evaluate the activation energy (Q) at ε = 0.6, the value of n is considered as the mean value of slopes for ) that is = 4.714 and the mean value of slopes from ) is
= 0.78. Thus, the Q value at 0.6 true strain obtained substituting these values in EquationEquation 9
(9)
(9) is approximately 305,400 J.mol−1. Additionally, the Q value can also be obtained by substituting ε = 0.6 in EquationEquation (17)
(17)
(17) . After the evaluation of all the parameters explained above, the constitutive equation of CoCrFeMnNi in the form of EquationEquation 11
(11)
(11) at ε = 0.6 can be expressed as,
where the Zener Holloman parameter at ε = 0.6 can be expressed as
Additionally, by substituting the values of α, n, Q and A in EquationEquation (5)(5)
(5) , the relationship between
, T and σ can be expressed as
The above constitutive EquationEquation (14)(14)
(14) is only valid at ε = 0.6. In order to describe the flow stress behaviour of CoCrFeMnNi alloy at strains in a wide strain range, the material constants α, n, Q and A need to be calculated based on polynomial regression analysis by using the flow stress values under the true strains within a range of 0.2–0.75 (at an interval of 0.05). The relation between the material constants and strain is fitted by third degree or cubic polynomials (polynomial order = 3) as shown in . Thus, the equations of each material constants in the range of 1023 K to 1423 K are
According to the EquationEquations (15(15)
(15) –Equation18
(18)
(18) ), the material constants α, n, Q and A can be calculated under different strains, and thus the same values are substituted in EquationEquation (5)
(5)
(5) to obtain the constitutive equations at different strain rates. The corresponding stress values can be evaluated from EquationEquation (11)
(11)
(11) . Eleti et al. [Citation34] had reported that the material constant α (a temperature-independent constant in the constitutive equations) was considered as 0.0035 at a true strain (ε) of 0.9 using the reference from the Zener et al. [Citation46] work on the effect of strain rate on plastic flow of steel. Similarly, Jeong et al. [Citation33] had reported that the average α value is approximately 0.00552 at ε = 0.6 (where units of α value are converted according to current paper). In the current research work, the α-value is evaluated for a different true strain in the range of 0.2–0.75, as shown in EquationEquation (16)
(16)
(16) . It should also be noted that α = β/n´, where the values of n´ and β are given by the slopes of the plots obtained using EquationEquations (6)
(6)
(6) and (Equation7
(7)
(7) ) at different strains. For example, n´ and β are the average values of the slopes obtained from , respectively. Accordingly, α varies in a narrow range of 0.005255–0.0056 (based on the flow stress data in the range of 0.2–0.75 true strains), as shown in .
Figure 7. Fitting curves of the model parameters and true strain (a) α vs ε (b) Q vs ε (c) n vs ε and (d) lnA vs ε
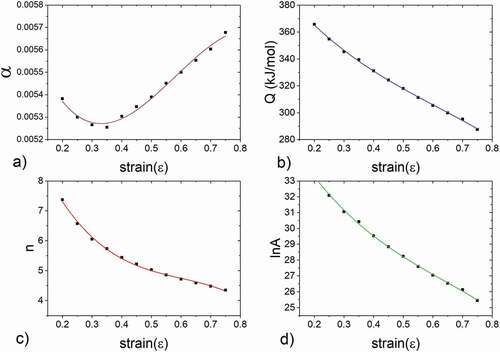
Figure 8. Predicted vs. Experimental flow-stress values at (a) 1023 K (b) 1073 K (c) 1123 K (d) 1173 K (e) 1223 K (f) 1273 (g) 1323 K (h) 1373 K and (i) 1423 K
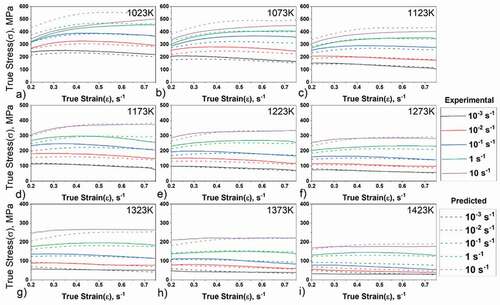
Figure 9. Comparison between predicted and experimental flow-stress values at (a) 1023 K (b) 1073 K (c) 1123 K (d) 1173 K (e) 1223 K (f) 1273 (g) 1323 K (h) 1373 K and (i) 1423 K
Additionally, the average stress exponent (n) value reported by Eleti et al. [Citation34] and Jeong et al. [Citation33] was ~5 at ε = 0.9 and 0.6, respectively. It is to be noted that n is the average of slopes of ln vs ln[sinh(ασ)] at different temperatures at a given true strain. For example, in the present case, it is found that the average n-value (i.e. average of the slopes of all test temperatures as shown in )) is 4.714 at ε = 0.6; the slopes vary from 4.12 to 5.93. Stepanov et al. [Citation35] reported that the stress exponent n ranged from ~5.18 to ~11.4 at ε = 0.2 based on the experimental data of CoCrFeMnNi HEA tested in the temperature and strain rate ranges of 1023–1323 K and 10−4 – 10−2 s−1, respectively. This shows that the stress exponent n varies with the change in temperature and strain rate at a particular true strain. Referring to ) the n values can be expressed in relation to true strain by a 3rd order polynomial as given in EquationEquation (17)
(17)
(17) , where each n-value is an average of the slopes at a constant true strain. In this study, the n values varied from 7.37 to 4.35 corresponding to true strains in the range 0.2–0.75.
Similarly, the activation energy of hot deformation (Q) is evaluated at different true strains in the range 0.2–0.75. The Q values are calculated based on EquationEquation (9)(9)
(9) at a constant true strain. For example, at ε = 0.6, the estimated value is ~305 kJ/mol. This value is closely matching the previous result, i.e. 312 kJ/mol at ε = 0.6 [Citation33]. In the current research work, the Q value varied in the range 366 kJ/mol at ε = 0.2 to 288kJ/mol at ε = 0.75. Incidentally, these Q values fall in the range of previous results, such as 291 kJ/mol at ε = 0.2 [Citation35] determined using isothermal compression testing in the range 1073–1373 K at low strain rates (10−4, 10−3 and 10−2 s−1), 330kJ/mol [Citation48] obtained on the basis of tensile testing in the range 1023 K–1123 K at low strain rates ≥10−5 s−1and, 350 kJ/mol at ε = 0.9 [Citation34]. Additionally, it is known that the activation energy for plastic deformation reflects the diffusivity of the alloys and is sensitive to the alloy compositions. The Q values at different true strains are close to the activation energy of weighted diffusion co-efficient, i.e., 284kJ/mol [Citation33]. It is observed that the activation energy of diffusion of individual alloying elements in CoCrFeMnNi HEA is also within the range or close approximation of Q values currently estimated; i.e. the activation energy of Co, Cr, Fe, Ni and Mn diffusion in CoCrFeMnNi are QCo = 270 ±22 kJ/mol, QCr = 313 ±13 kJ/mol, QFe = 309 ±11 kJ/mol, QNi = 272 ±13 kJ/mol and QMn = 304 ±9 kJ/mol, respectively [Citation49].
3.3.2 Verification of the constitutive equation
shows the comparison between the predicted and experiment values. The predictions of flow stress at different temperatures and strain rates are made by using the EquationEquations (11(11)
(11) ), for a given true strain in the range 0.2 to 0.75 at an increment of 0.05. shows a good qualitative match between the experimental results and predicted data in most of the conditions, but there are few deviations under specific conditions. At low temperatures (1023–1123 K) it is found that the flow stress at higher strain rates shows significant deviations, possibly due to poor or just average fitting of the material constants [Citation42]. This is because EquationEquations (6)
(6)
(6) & (Equation7
(7)
(7) ) apply to low and high stress levels, respectively and the approach used is to obtain values for n′ and β by evaluation slopes of the EquationEquations (6)
(6)
(6) & (Equation7
(7)
(7) ). Thus, small errors could arise due to the accuracy of least squares fits and differences in slopes at different temperatures. Such errors eventually affect the values predicted by the EquationEquations (15
(15)
(15) –Equation18
(18)
(18) ) and the values evaluated.
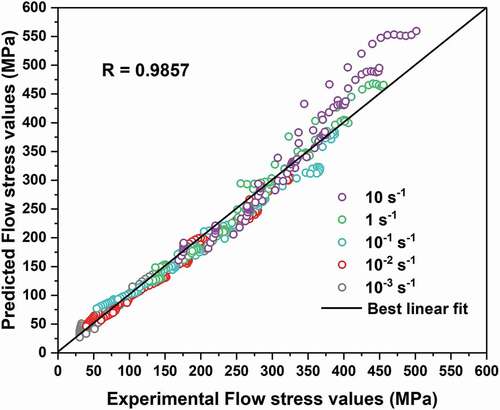
To evaluate the degree of difference between experimental value and predicted values, the standard statistical method such as the average absolute relative error (AARE) and the correlation coefficient (R) are used.
The statistical parameters are defined as:
Where E is the experimental flow stress (true stress) data; P is the predicted flow stress data obtained from the equations; N is the number of selected data; and and
are the mean values of E and P, respectively. The cumulative AARE is 7.68% which is a good fit to experimental data. Additionally, shows the comparison of experimental and predicted slow stress values. There is a light deviation of flow stress values at higher strain rates (which is seen in at low temperatures 1023–1123 K and at high strain rate 10 s−1). The correlation coefficient (R) for the least square fit line through the data is R = 0.9857, revealing a linear relationship between experimental and predicted flow stress values.
4. Conclusions
The experimental true stress-true strain data have been obtained on a hot-rolled CoCrFeMnNi HEA via isothermal hot compression tests using a simulation test plan in Gleeble simulator, over a wide range of temperatures (1023–1423 K) and strain rates (10−3–10 s−1) to a true strain of ~0.8.
The flow curves at lower strain rates (10−3–10−1 s−1) showed peak stress behaviours, with peak stress followed by flow softening, which implies the occurrence of DRX. The occurrence of DRX was confirmed by microstructural observations in the select samples. At high strain rates (1 and 10 s−1) and low temperatures (≤1123 K) the flow stress is increased with increase in strain due to enhanced strain hardening with deformation.
An Arrhenius type constitutive equation for hot deformation was established for true strain in a range of 0.2–0.75 that is valid for temperatures (1023–1423 K) and strain rates (10−3, 10−2, 10−2, 1, 10 s−1). The material constants α and n are the average values of all slope values obtained from all the testing temperatures at a constant strain. In this constitutive model, the material constants (A, α and n) and activation energy of plastic deformation (Q) are introduced as strain-dependent. The influence of strain on the material constants is represented in 3rd – order polynomial equations. The evaluation of Q and A values depends on the material constants α and n.
An activation energy of 305 kJ was measured for plastic deformation at ε = 0.6 with stress component n = 4.714. This energy decreases from 368 to 288 kJ/mol with increase in true strain (ε) from 0.2 to 0.75.
The activation energies for plastic deformation (Q) at different strains are close to the activation energy of weighted diffusion co-efficient with weight contribution of each element in CoCrFeMnNi (284kJ/mol). Additionally, it is observed that activation energy of diffusion of individual alloying elements in CoCrFeMnNi HEA is also within the range of the current estimated activation energies for plastic deformation at different strains.
A comparison of the experimental and predicted flow stress data suggests that the constitutive equations developed in this study give the values for AARE and R of 7.68% and 0.9857, respectively. These comparisons confirm that the constitutive model adequately describes the hot deformation behaviour and characteristics.
Availability of Data
The raw data cannot be shared currently as there is ongoing research using the current data.
Authors Contribution
Patnamsetty Madan: Conceptualization, Methodology, Investigation, Software, Writing – Original draft. Mahesh Somani: Conceptualization, Methodology, Supervision, Validation, Writing - Review & Editing. Pasi Peura: Validation, Supervision, Resources, Funding acquisition. Ari Saastamoinen: Investigation, Software (EBSD).
Acknowledgments
This study was conducted with the support from the TUT Foundation as a part of Tampere University’s graduate school. This work made use of Tampere Microscopy Centre facilities at Tampere University. Thanks to Juha Uusitalo from University of Oulu for conducting Gleeble experiments.
Disclosure statement
No potential conflict of interest was reported by the authors.
Related Research Data
References
- Yeh JW, Chen SK, Lin SJ, et al. Nanostructured high-entropy alloys with multiple principal elements: novel alloy design concepts and outcomes. Adv Eng Mater. 2004;6:299–303+274.
- Cantor B,Chang ITH, KnightP, et al. Microstructural development in equiatomic multicomponent alloys. Mater Sci Eng A. 2004;375–377:213–218. Available from: https://doi.org/http://doi.org/10.1016/j.msea.2003.10.257.
- Ye YF, Wang Q, Lu J, et al. High-entropy alloy: challenges and prospects. Mater Today. 2016;19:349–362. [ Internet]. Available from: http://www.sciencedirect.com/science/article/pii/S1369702115004010
- Miracle DB, Senkov ON. A critical review of high entropy alloys and related concepts. Acta Materialia. 2017;122:448–511. [ Internet]. Available from: https://linkinghub.elsevier.com/retrieve/pii/S1359645416306759
- Pickering EJ, Stone HJ, Jones NG. Fine-scale precipitation in the high-entropy alloy Al0.5CrFeCoNiCu. Mater Sci Eng A. 2015;645:65–71. [ Internet].
- Jiang L, Lu Y, Dong Y, et al. Annealing effects on the microstructure and properties of bulk high-entropy CoCrFeNiTi0.5 alloy casting ingot. Intermetallics. 2014;44:37–43. [ Internet]. DOI:https://doi.org/10.1016/j.intermet.2013.08.016
- Wang W-R, Wang W-L, Wang S-C, et al. Effects of Al addition on the microstructure and mechanical property of AlxCoCrFeNi high-entropy alloys. Intermetallics. 2012;26:44–51. [ Internet]. Available from: https://linkinghub.elsevier.com/retrieve/pii/S096697951200088X
- Li Z, Pradeep KG, Deng Y, et al. Metastable high-entropy dual-phase alloys overcome the strength-ductility trade-off. Nature. 2016;534:227–230. [ Internet]. Available from: http://www.nature.com/articles/nature17981
- Luo H, Li Z, Raabe D. Hydrogen enhances strength and ductility of an equiatomic high-entropy alloy. Sci Rep. 2017;7:9892. [ Internet]. Available from: http://www.nature.com/articles/s41598-017-10774-4
- Seol JB, Bae JW, Li Z, et al. Boron doped ultrastrong and ductile high-entropy alloys. Acta Materialia. 2018;151:366–376. [ Internet]. Available from: https://linkinghub.elsevier.com/retrieve/pii/S1359645418302696
- Tsai MH, Fan AC, Wang HA. Effect of atomic size difference on the type of major intermetallic phase in arc-melted CoCrFeNiX high-entropy alloys. J Alloys Compd. 2017;695:1479–1487. [ Internet].
- Li Z, Ludwig A, Savan A, et al. Combinatorial metallurgical synthesis and processing of high-entropy alloys. J Mater Res. 2018;33:3156–3169. [ Internet]. Available from: https://www.cambridge.org/core/product/identifier/S0884291418002145/type/journal_article
- Han Z, Ren W, Yang J, et al. The deformation behavior and strain rate sensitivity of ultra-fine grained CoNiFeCrMn high-entropy alloys at temperatures ranging from 77 K to 573 K. J Alloys Compd. 2019;791:962–970. [ Internet]. Available from: https://linkinghub.elsevier.com/retrieve/pii/S0925838819312174
- Gludovatz B, Hohenwarter A, Catoor D, et al. A fracture-resistant high-entropy alloy for cryogenic applications. Science. 2014;345:1153–1158. [ Internet]. Available from: http://www.sciencemag.org/cgi/doi/10.1126/science.1254581
- Ding Q, Fu X, Chen D, et al. Real-time nanoscale observation of deformation mechanisms in CrCoNi-based medium- to high-entropy alloys at cryogenic temperatures. Mater Today. 2019;25:21–27. [ Internet]. Available from: https://linkinghub.elsevier.com/retrieve/pii/S1369702118313592
- Tong Y, Chen D, Han B, et al. Outstanding tensile properties of a precipitation-strengthened FeCoNiCrTi0.2 high-entropy alloy at room and cryogenic temperatures. Acta Materialia. 2019;165:228–240. [ Internet]. Available from: https://linkinghub.elsevier.com/retrieve/pii/S135964541830925X
- Joseph J, Haghdadi N, Shamlaye K, et al. The sliding wear behaviour of CoCrFeMnNi and AlxCoCrFeNi high entropy alloys at elevated temperatures. Wear. 2019;428–429:32–44. [ Internet]. Available from: https://linkinghub.elsevier.com/retrieve/pii/S0043164818315047
- Verma A, Tarate P, Abhyankar AC, et al. High temperature wear in CoCrFeNiCux high entropy alloys: the role of Cu. Scr Mater. 2019;161:28–31. [ Internet]. Available from: https://linkinghub.elsevier.com/retrieve/pii/S135964621830616X
- Haghdadi N, Guo T, Ghaderi A, et al. The scratch behaviour of AlXCoCrFeNi (x = 0.3 and 1.0) high entropy alloys. Wear. 2019;428–429:293–301. [ Internet]. Available from: https://linkinghub.elsevier.com/retrieve/pii/S0043164818315953
- Karati A, Guruvidyathri K, Hariharan VS, et al. Thermal stability of AlCoFeMnNi high-entropy alloy. Scr Mater. 2019;162:465–467. [ Internet]. Available from: https://linkinghub.elsevier.com/retrieve/pii/S1359646218307516
- Zhang H, He Y-Z, Pan Y, et al. Thermally stable laser cladded CoCrCuFeNi high-entropy alloy coating with low stacking fault energy. J Alloys Compd. 2014;600:210–214. [ Internet]. Available from: https://linkinghub.elsevier.com/retrieve/pii/S0925838814004915
- Vaidya M, Guruvidyathri K, Murty BS. Phase formation and thermal stability of CoCrFeNi and CoCrFeMnNi equiatomic high entropy alloys. J Alloys Compd. 2019;774:856–864. [ Internet]. Available from: https://linkinghub.elsevier.com/retrieve/pii/S0925838818336004
- Zhang KB, Fu ZY, Zhang JY, et al. Microstructure and mechanical properties of CoCrFeNiTiAlx high-entropy alloys. Mater Sci Eng A. 2009;508(214–219). [ Internet]. [cited 2019 May 14]. Available from: https://www.sciencedirect.com/science/article/pii/S0921509309000021
- Zhang H, He Y, Pan Y. Enhanced hardness and fracture toughness of the laser-solidified FeCoNiCrCuTiMoAlSiB0.5 high-entropy alloy by martensite strengthening. Scr Mater. 2013;69:342–345. [ Internet]. Available from: https://linkinghub.elsevier.com/retrieve/pii/S1359646213002686
- Zhang Y, Zuo TT, Tang Z, et al. Microstructures and properties of high-entropy alloys. Pro Mater Sci. 2014;61:1–93. [ Internet].
- Bhattacharjee PP, Sathiaraj GD, Zaid M, et al. Microstructure and texture evolution during annealing of equiatomic CoCrFeMnNi high-entropy alloy. J Alloys Compd. 2014;587:544–552. [ Internet].
- Otto F, Dlouhý A, Somsen C, et al. The influences of temperature and microstructure on the tensile properties of a CoCrFeMnNi high-entropy alloy. Acta Materialia. 2013;61:5743–5755. [ Internet]. Available from: https://linkinghub.elsevier.com/retrieve/pii/S1359645413004503
- Vaidya M, Karati A, Marshal A, et al. Phase evolution and stability of nanocrystalline CoCrFeNi and CoCrFeMnNi high entropy alloys. J Alloys Compd. 2019;770:1004–1015. [ Internet]. Available from: https://linkinghub.elsevier.com/retrieve/pii/S0925838818330822
- Otto F, Hanold NL, George EP. Intermetallics Microstructural evolution after thermomechanical processing in an equiatomic, single-phase CoCrFeMnNi high-entropy alloy with special focus on twin boundaries. Intermetallics. 2014;54:39–48. [ Internet].
- Zaddach AJ, Scattergood RO, Koch CC. Tensile properties of low-stacking fault energy high-entropy alloys. Mater Sci Eng A. 2015;636:373–378. [ Internet]. Available from: https://linkinghub.elsevier.com/retrieve/pii/S092150931500369X
- Otto F, Dlouhý A, Pradeep KG, et al. Decomposition of the single-phase high-entropy alloy CrMnFeCoNi after prolonged anneals at intermediate temperatures. Acta Materialia. 2016;112:40–52. [ Internet]. Available from: https://linkinghub.elsevier.com/retrieve/pii/S1359645416302610
- Ma D, Yao M, Pradeep KG, et al. Phase stability of non-equiatomic CoCrFeMnNi high entropy alloys. Acta Materialia. 2015;98:288–296. [ Internet]. Available from: https://linkinghub.elsevier.com/retrieve/pii/S1359645415005017
- Jeong HT, Park HK, Park K, et al. High-temperature deformation mechanisms and processing maps of equiatomic CoCrFeMnNi high-entropy alloy. Mater Sci Eng A. 2019;756:528–537. [ Internet]. [cited 2019 May 14]. Available from: https://www.sciencedirect.com/science/article/pii/S0921509319305210#bib24
- Eleti RR, Bhattacharjee T, Zhao L, et al. Hot deformation behavior of CoCrFeMnNi FCC high entropy alloy. Mater Chem Phys. 2018;210:176–186. [ Internet]. Available from: https://linkinghub.elsevier.com/retrieve/pii/S0254058417305047
- Stepanov ND, Shaysultanov DG, Yurchenko NY, et al. High temperature deformation behavior and dynamic recrystallization in CoCrFeNiMn high entropy alloy. Mater Sci Eng A. 2015;636:188–195. [ Internet].
- Tsai KY, Tsai MH, Yeh JW. Sluggish diffusion in Co-Cr-Fe-Mn-Ni high-entropy alloys. Acta Materialia. 2013;61:4887–4897. [ Internet].
- Liu WH, Wu Y, He JY, et al. Grain growth and the Hall–Petch relationship in a high-entropy FeCrNiCoMn alloy. Scr Mater. 2013;68:526–529. [ Internet]. [cited 2016 Nov 1]. Available from: https://linkinghub.elsevier.com/retrieve/pii/S1359646212007737
- Liu J, Zeng W, Lai Y, et al. Constitutive model of Ti17 titanium alloy with lamellar-type initial microstructure during hot deformation based on orthogonal analysis. Mater Sci Eng A. 2014;597:387–394. [ Internet]. Available from: https://linkinghub.elsevier.com/retrieve/pii/S0921509313014597
- Johnson GR, Cook WH. Fracture characteristics of three metals subjected to various strains, strain rates, temperatures and pressures. Eng Fract Mech. 1985;21:31–48. [ Internet]. Available from: https://linkinghub.elsevier.com/retrieve/pii/0013794485900529
- Zerilli FJ, Armstrong RW. Dislocation‐mechanics‐based constitutive relations for material dynamics calculations. J Appl Phys. 1987;61:1816–1825. [ Internet]. Available from: http://aip.scitation.org/doi/10.1063/1.338024
- Sellars CM, McTegart WJ. On the mechanism of hot deformation. Acta Metall. 1966;14:1136–1138. [ Internet]. Available from: https://linkinghub.elsevier.com/retrieve/pii/0001616066902070
- Ge G, Zhang L, Xin J, et al. Constitutive modeling of high temperature flow behavior in a Ti-45Al-8Nb-2Cr-2Mn-0.2Y alloy. Sci Rep. 2018;8:5453. [ Internet]. Available from: http://www.nature.com/articles/s41598-018-23617-7
- Wen D-X, Lin YC, Li H-B, et al. Hot deformation behavior and processing map of a typical Ni-based superalloy. Mater Sci Eng A. 2014;591:183–192. [ Internet]. Available from: https://linkinghub.elsevier.com/retrieve/pii/S0921509313010253
- ASM International Edited by Prasad, YVRK, Rao KP, Sasidhar S. Hot Working guide: a compendium of processing maps. 2nd ed. Google Books; ASM International; 2015.
- Liu J, Wang X, Liu J, et al. Hot deformation and dynamic recrystallization behavior of Cu-3Ti-3Ni-0.5Si alloy. J Alloys Compd. 2019;782:224–234. [ Internet]. Available from: https://linkinghub.elsevier.com/retrieve/pii/S0925838818347686
- Zener C, Hollomon JH. Effect of Strain Rate Upon Plastic Flow of Steel. J Appl Phys. 1944;15:22–32. [ Internet]. Available from: http://aip.scitation.org/doi/10.1063/1.1707363
- Rastegari H, Rakhshkhorshid M, Somani MC, et al. Constitutive modeling of warm deformation flow curves of an eutectoid steel. J Mater Eng Perform. 2017;26:2170–2178. [ Internet].
- He JY, Zhu C, Zhou DQ, et al. Steady state flow of the FeCoNiCrMn high entropy alloy at elevated temperatures. Intermetallics. 2014;55:9–14. [ Internet]. Available from: https://linkinghub.elsevier.com/retrieve/pii/S0966979514001964
- Vaidya M, Pradeep KG, Murty BS, et al. Bulk tracer diffusion in CoCrFeNi and CoCrFeMnNi high entropy alloys. Acta Materialia. 2018;146:211–224. [ Internet]. Available from: https://linkinghub.elsevier.com/retrieve/pii/S1359645418300089