
 ?Mathematical formulae have been encoded as MathML and are displayed in this HTML version using MathJax in order to improve their display. Uncheck the box to turn MathJax off. This feature requires Javascript. Click on a formula to zoom.
ABSTRACT
Corrosion-control coatings which can enhance bone formation and be completely replaced by bone are attractive for biodegradable Mg alloys. Carbonate apatite (CAp) and hydroxyapatite (HAp) coatings were formed on Mg-4 wt% Y-3 wt% rare earth (WE43) alloy as a corrosion-control and bioabsorbable coating in the coating solution with various concentrations of NaHCO3. The incorporation of carbonate group in apatite structure was examined using X-ray diffraction and Fourier transform infrared spectroscopy. Rat osteoclast precursor and MC3T3-E1 osteoblast cells were cultured on the CAp- and HAp-coated WE43 to examine the osteoclastic resorption and the alkaline phosphatase (ALP) activity, respectively. Mg ions in the used medium were quantified to examine the corrosion-control ability. The NaHCO3 addition in the solution resulted in the formation of B-type CAp in which the phosphate group of apatite structure was substituted with the carbonate group. The osteoclastic resorption was observed only for the CAp coatings as the cracking of the coatings and the corrosion of substrate WE43 strongly localized under osteoclast cell bodies. The CAp and HAp coatings significantly enhanced the ALP activity of osteoblasts. The CAp-coated WE43 specimens showed 1/5 smaller amount of Mg ion release than the uncoated WE43 on the first day of culturing osteoblasts. For the subsequent 22 days, the Mg ion release was reduced to 1/2 by the CAp coatings. In the presence of osteoclasts, the CAp coatings showed slightly lower corrosion protectiveness than the HAp coating. It was demonstrated that the CAp coatings can be a bioabsorbable and corrosion-control coating for biodegradable Mg alloys.

1. Introduction
Magnesium/Mg alloys have been examined as a biodegradable metallic implant material for bone fixation devices, tissue engineering scaffolds and cardiovascular stents, and various biomedical Mg/Mg alloys and surface modifications have been developed [Citation1–Citation6]. It was reported that a rapid corrosion of bare Mg/Mg alloys caused an early deterioration of mechanical integrity and a rapid hydrogen (H2) gas evolution which may suffer the healing of the affected body part by forming a gas cavity [Citation7–Citation9]. Corrosion control of Mg/Mg alloys is thus a crucial issue to keep enough strength to support the affected part and to moderate the H2 gas evolution through the degradation of Mg alloys. In addition to moderate the corrosion, the surface of medical devices is required to show proper biocompatibility depending on the part of body: the bone conductivity for bone fixation devices and the anti-thrombotic property and endothelial cell adhesion promotion property for cardiovascular stents. Surface modifications are an effective clue to moderate the corrosion of the substrate alloys and to improve the surface biocompatibility simultaneously [Citation10,Citation11].
We developed hydroxyapatite (HAp) and octacalcium phosphate (OCP) coatings [Citation12–Citation15] because HAp coatings are practically used for Ti alloy implants to enhance the bone formation on the surface [Citation16]. The HAp and OCP coatings retarded the corrosion rate of Mg-3 wt% Al-1 wt% Zn (AZ31) alloy in the subcutaneous tissue of mice for 16 weeks and prevented the formation of gas cavity [Citation13]. In the subcutaneous tissue, the corrosion of AZ31 substrate proceeded under the HAp coating, while only a small portion of HAp coating degraded after 16 weeks of implantation. HAp is originally stable in physiological environments and especially sintered HAp is hardly replaced with bone through osteoclastic resorption. The degradation of HAp artificial bone takes several years [Citation17]. These facts indicate that the HAp coatings remain in the body for several years after the degradation of substrate Mg alloy. Since the corrosion of substrate Mg alloy proceeds under the HAp coating, the remaining of HAp coating may cause the loosening of devices. In the case of biodegradable poly-L-lactic acid (PLLA), it was reported that the chronic inflammation was induced by the fragmented PLLA particles and the acidity of the degradation product [Citation18]. It is suggested that the degradation of the entire material is desirable to avoid chronic inflammation.
Bone apatite contains carbonate groups substituting phosphate and/or hydroxyl groups of apatite structure, so that the chemical structure of bone apatite could be expressed as Ca10-a(PO4)6-b(CO3)c(OH)2-d if trace elements with the content of less than 1 wt % are neglected [Citation19]. Aiming to replace the artificial bone with new bone, carbonate apatite (CAp) (alternate name: carbonate-substituted hydroxyapatite, carbonate-substituted apatite) artificial bone was developed and showed the degradation in bone by osteoclast cells (bone resorption) [Citation17,Citation19–Citation21]. On the other hand, the chemical solubility of CAp is not significantly higher than that of HAp at pH 7.5 [Citation21]. The low solubility and osteoclastic resorption property of CAp should be advantageous for CAp coatings to achieve both good corrosion-control ability and resorption by osteoclast cells. One thing to be concerned is that osteoclastic activity may be decreased on Mg alloy surface because alkaline environments and Mg ions suppressed osteoclastic activities [Citation22] and the number of osteoclasts in peri-implant tissue decreased around the Mg(OH)2 cylinder implanted in rabbit femur [Citation23]. The effect of Mg ions on osteoclasts and osteoblasts depended on the concentration of Mg ions and the coexisting substances like receptor activator of NF-κB ligand (RANKL) and vitamin D3 [Citation24,Citation25].
The objective of this study was to develop CAp coatings on an Mg alloy and to examine whether the CAp coatings can be absorbed by osteoclastic resorption and whether the CAp coatings can enhance bone formation. CAp and HAp coatings with various carbonate content rates were formed on Mg-4 wt% Y-3 wt% rare earth (WE43) alloy. The morphological change of the coatings was observed under culturing osteoclast cells, and the ALP activity of osteoblast cells cultured on the coated surfaces was examined.
2. Materials and methods
2.1. CAp and HAp coating procedure
WE43 alloy discs with a diameter of 16 mm and a thickness of 1–2 mm were prepared from extruded rods (Magnesium Electron, UK) with the composition shown in . The surface of discs was ground with SiC papers up to #1200 and rinsed ultrasonically in acetone. The ground WE43 discs were named uncoated WE43.
Table 1. Composition of WE43 extruded. [mass%].
Coating treatment solutions with various concentrations of sodium hydrogen carbonate (NaHCO3,) were prepared from ethylenediaminetetraacetic acid (EDTA) calcium disodium salt hydrate (C10H12CaN2Na2O8, Ca-EDTA, Fluka, USA), potassium dihydrogen phosphate (KH2PO4, Wako Pure Chemical), sodium hydroxide (NaOH, Wako Pure Chemical), and NaHCO3 (Wako Pure Chemical, Japan). The concentration of NaHCO3 varied 0, 0.4, 1.1 and 1.9 mol/L. The composition of solutions and specimen name treated in each solution are summarized in . Uncoated WE43 discs were immersed in the treatment solution at 363 K for 1 h for coating. X-ray diffraction (XRD: Bruker, D2 Phaser) and diffuse reflectance Fourier transform infrared spectroscopy (FTIR: Shimazu, IRTracer-100) measurements were carried out to analyze the crystal structure and the incorporation of carbonate group in the crystal structure of the coatings. The substitution of phosphate and/or hydroxide groups of apatite structure with carbonate group was examined by the shift of XRD peaks originating from (002)Ap and (300)Ap planes. Surface and cross-sectional morphology of the coatings was observed using a scanning electron microscope (FEI, Quanta FEG 250).
Table 2. Coating solution composition for hydroxyapatite and carbonate apatite coatings. [mol/L].
2.2. Osteoclast cell culture on CAp- and HAp-coated WE43 specimens
Rat osteoclast precursors (OSC11, Cosmo Bio, Tokyo, Japan) were used to examine the resorption of CAp coatings by osteoclast cells. Round-shaped glass discs with a diameter of 20 mm (Matsunami glass, Osaka, Japan) were used as a reference. Uncoated, HAp-, CAp0.4M-, CAp1.1M-, CAp1.9M-WE43 and glass discs were dipped in acetone for 10 s for sterilization and dried in air. The discs were placed in 12-well plates by putting one disc in one well with 2 mL of α-minimum essential medium (α-MEM; Thermo Fisher Scientific, Waltham, Massachusetts, USA) supplemented with 10% fetal bovine serum (FBS; Sigma-Aldrich, St Louis, Missouri, USA) and kept at 310 K for 24 h in a 5% CO2 incubator. On Day 1, the medium was removed from each well, and osteoclast precursor cells were seeded at 4 × 10⁴ cells/well with 4 mL of osteoclast culture medium (OSCMR, Cosmo Bio) containing 50 ng/mL macrophage colony stimulating factor (M-CSF) and 15 ng/mL receptor activator of NF-κB ligand (RANKL). The cells were cultured for 14 days (up to Day 15) with a refreshment of differentiation medium on Day 8.
On Days 4, 8 and 15, tartrate-resistant acid phosphate (TRAP) in osteoclasts was stained using TRAP staining kit (AK04F, Cosmo Bio) and observed using an optical microscope (VHX-5000, Keyence, Japan) to confirm the differentiation of precursor cells to osteoclast cells. On Day 15, the cells were dehydrated and fixed with methanol and then the cell bodies were stained with Giemsa (Muto Pure Chemicals, Japan). The surface morphology and topography of the coating layers of Giemsa-stained discs were observed using scanning electron microscopy (SEM; FEI, Quanta FEG 250) and one-shot 3D microscope (VR-3000, Keyence, Japan), respectively. The osteoclast culture test for 15 days was repeated for TRAP staining to check the reproducibility. The ratio of the total surface area occupied with TRAP-positive cells to the entire surface area of the disc specimens and the apparent number of TRAP-positive cells were measured using NIH ImageJ. The apparent mean cell size was calculated by dividing the total surface area occupied with the TRAP-positive cells by the apparent number of the cells. For TRAP-stained specimens on Day 15, a cross section containing a cell body and the underneath coating was formed using focused ion beam (FIB) technique, and the cross section was observed using SEM equipped with energy-dispersive X-ray spectroscopy (EDS: TEAM EDS, EDAX, USA). Carbon was deposited on the surface as a protective layer before FIB milling.
Magnesium and Ca ions in the used medium collected on Days 1, 4, 8 and 15 were quantified by a colorimetric method using Magnesium B-test Wako (Wako Pure Chemical, Osaka, Japan) and Calcium E-HA test Wako (Wako Pure Chemical), respectively.
Three samples from each specimen were used for the cell culture for 15 days and for the quantification of Mg and Ca ions. One sample from each specimen was used for TRAP and Giemsa staining, respectively. One sample from each specimen was used for the cell culture for 4 and 8 days for TRAP staining.
2.3. Osteoblast cell culture on CAp- and HAp-coated WE43 specimens
Mouse MC3T3-E1 pre-osteoblasts (RIKEN BioResource Center, Tsukuba, Japan) were used to examine the bone formation ability of CAp-coated WE43 specimens. Plastic discs (Thermanox plastic coverslips, Thermo Fisher Scientific, Waltham, Massachusetts, USA) were used as a reference. Uncoated, HAp-, CAp0.4M- and CAp1.1M-WE43, and plastic discs were sterilized in acetone. The discs were placed in 12-well plates by putting one disc in one well. MC3T3-E1 cells were seeded at 5 × 10³ cells per well with 2 mL of α-MEM+FBS supplemented with 100 U/mL penicillin and 100 µg/mL streptomycin (Invitrogen, USA) and incubated at 310 K for 24 h in a 5% CO2 incubator. On Day 1, the discs with cells were each transferred into a plastic tube and 20 mL of culture medium was added to buffer the effects of Mg corrosion on the pH and Mg ion concentration of the medium. The cells were cultured for 22 days in total with a refreshment of the medium on Days 8 and 15.
On Days 8, 15 and 22, the activity of intracellular ALP and the concentration of protein were measured. The discs with cells were transferred to a new 12-well plate, and 300 µL of 1% NP-40 saline was added in each well. The well plate was shaken at room temperature for 30 min, and then the cell extract solution was collected. Subsequently, the concentration of ALP and proteins was measured using a LabAssay ALP (Wako Pure Chemical) and BCA Protein Assay Kit (Thermo Fisher Scientific), respectively, according to the instruction of the kit. The ALP activity was calculated by normalizing the ALP concentration by protein concentration. Magnesium ions in the used medium were quantified using Magnesium B-test Wako. Three samples from each specimen were used for the ALP and protein assay and the quantification of Mg ions. The results of ALP assay were compared using a repeated measure analysis of variance (ANOVA) using Statcel4 on Excel for Office 365. Tukey–Kramer test was carried out as a post-hoc test. The results of Mg quantification were compared using one-way ANOVA. A significant difference between specimens was indicated; therefore, Turkey–Kramer test was carried out as a post-hoc test.
3. Results
3.1. CAp coating
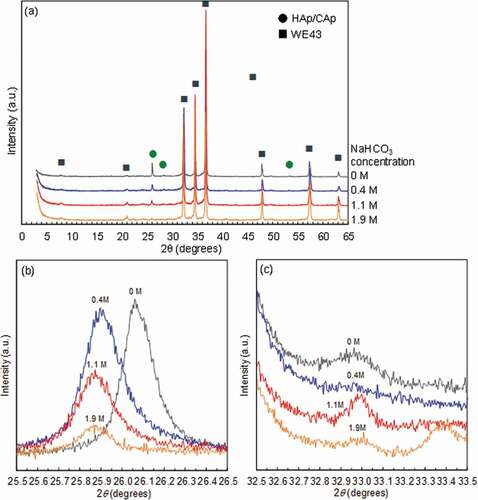
) shows the XRD patterns of the disc surfaces treated with various NaHCO3 concentrations from 0 to 1.9 mol/L (M). In addition to the peaks originating from WE43 substrate, the small peaks originating from the apatite structure were observed. ) and (c) show XRD peaks of (002)Ap and (300)Ap planes of apatite (Ap) structure, respectively. The peak position of (300)Ap plane did not change with NaHCO3. The intensity of (002)Ap peak decreased and the full width at half maximum (FWHM) of (002)Ap peak slightly increased with an increase of NaHCO3 concentration, indicating that the deposition amount and crystal size of CAp decreased. The (002)Ap peak position shifted to the lower angle by the addition of NaHCO3, which corresponds to the substitution of phosphate group with a carbonate group [Citation26–Citation28]. It was demonstrated that CAp was formed on the WE43 substrate. The (002)Ap peak position with 1.1 and 1.9 mol/L NaHCO3 was at a lower angle than that with 0.4 mol/L NaHCO3, while no significant difference in (002)Ap peak position was observed between 1.1 mol/L and 1.9 mol/L NaHCO3 concentrations. It was indicated that the carbonate substitution ratio increased with an increase of NaHCO3 concentration up to 1.1 mol/L and became almost constant thereafter. Then, the specimens coated with 0, 0.4, 1.1 and 1.9 mol/L NaHCO3 concentrations were named HAp-, CAp0.4M-, CAp1.1M- and CAp1.9M-WE43, respectively.
Figure 1. XRD patterns of WE43 specimens treated in solutions with NaHCO3 concentrations of 0, 0.4, 1.1 and 1.9 mol/L. (a) Wide range and (b) narrow range for (002)Ap plane (c-plane) and (c) narrow range for (300)Ap plane (a-plane).
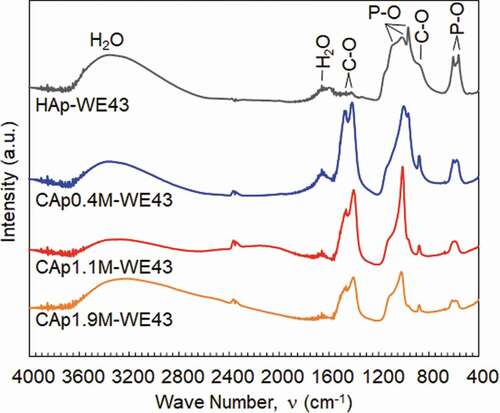
shows the FTIR spectra of the CAp and HAp coatings prepared with various NaHCO3 concentrations. HAp-WE43 exhibits a typical IR spectrum of HAp [Citation27,Citation29]: the absorption bands at 550, 600, 870, 950, 1000 and 1150 cm−1 are derived from PO43-, and those at 1650 and 3400 cm−1 are derived from adsorbed H2O and OH−, respectively. In addition, trace level bands at 870, 1410 and 1455 cm−1 derived from CO32- are observed on HAp-WE43, while the peak at 870 cm−1 is shared by HPO42- and CO32- [Citation29]. This indicated that a trace amount of carbonate group was incorporated in the apatite structure of the HAp coating from the air. The absorption bands derived from CO32- increased significantly with the addition of NaHCO3. This result confirms the incorporation of carbonate group in the apatite structure of the CAp0.4M, CAp1.1M and CAp1.9M coatings.
Figure 2. FTIR absorption spectra of WE43 specimens treated in coating treatment solutions with NaHCO3 concentrations of 0, 0.4, 1.1 and 1.9 mol/L. Spectra are vertically offset for clarity.
shows surface and cross-sectional SEM images of the uncoated and HAp- and CAp-coated WE43 specimens. As reported previously, HAp coating showed a two-layer structure of the inner continuous layer with a thickness of ca. 1 µm and the outer porous layer consisting of rod-like HAp crystals [Citation14]. The CAp0.4M-, CAp1.1M- and CAp1.9M-WE43 surfaces were uniformly covered with agglomerated cauliflower-like particles which formed a continuous layer. The thickness of CAp0.4M coating was about 1.5 µm. The thickness of the CAp coatings decreased with an increase of NaHCO3 concentration.
Figure 3. (a)–(e) Surface and (f)–(i) cross-sectional SEM images of W43 specimens (a) uncoated and those treated with NaHCO3 concentrations of (b, f) 0 mol/L (HAp), (c, g) 0.4 mol/L (CAp0.4M), (d, h) 1.1 mol/L (CAp1.1M) and (e, i) 1.9 mol/L (CAp1.9M).
3.2. Osteoclast response to CAp-coated WE43
-1)–(e-4) shows optical images of various specimens with TRAP- and Giemsa-stained rat osteoclast cells cultured for 4, 8 and 15 days. TRAP is a specific bone matrix degrading enzyme expressed in differentiated osteoclasts. HAp, CAp, and Mg alloy are not stained by TRAP staining, and only cells that express TRAP (differentiated osteoclasts) are stained in red. -5)–(e-5) shows the whole surface images of HAp- and CAp-coated specimens and glass with Giemsa-stained cells on Day 15. All cells including both differentiated and non-differentiated cells were stained in blue by Giemsa staining. The whole surface and magnified surface images of the specimens with TRAP-stained cells on Days 4–15 are shown in supplementary Figs. S1 and S2. shows the ratio of the total surface area occupied with TRAP-positive cells to the entire surface area of the disc specimens, the apparent number of TRAP-positive cells and the apparent mean cell size, which were measured using the images shown in Fig. S1. On Day 4, almost all the TRAP-positive cells were mononuclear osteoclasts with a size smaller than 50 µm. Typical mononuclear osteoclasts are indicated by arrow heads in -1)–(e-1). On Day 8, multinucleated osteoclasts with a size larger than 100 µm were expressed on the HAp- and CAp-coated surfaces. Typical multinucleated osteoclasts are indicated by arrows in -2)–(e-2). Expression frequency of large-sized multinucleated osteoclasts on the CAp-coated surfaces appeared to be higher than that on the HAp-coated surface. These results are supported by the increase of the cell-occupied area ratio and the mean cell size from Day 4 to Day 8 except for CAp0.4 M-WE43 on which the mean cell area did not change significantly (). On the glass surface, mononuclear osteoclasts were observed; however, multinucleated osteoclasts were scarcely observed on Days 8 and 15. It was indicated that the HAp and CAp coatings enhanced the differentiation of osteoclast precursors to matured multinucleated osteoclasts.
Figure 4. Optical surface images of (a-1)–(a-5) HAp-WE43, (b-1)–(b-5) CAp0.4M-WE43, (c-1)–(c-5) CAp1.1M-WE43, (d-1)–(d-5) CAp1.9M-WE43 and (e-1)–(e-5) Glass with (a-1)–(e-3) TRAP-stained osteoclasts and (a-4)–(e-5) Giemsa-stained osteoclasts. Images on (a-1)–(e-1) Day 4, (a-2)–-(e-2) Day 8, (a-3)–(e-3) Day 15 with TRAP-stained cells. (a-4)–(e-4) images on Day 15 with Giemsa-stained cells. (a-5)–(e-5) whole surface images on Day15 with Giemsa-stained cells. Arrowheads and arrows indicate typical mononuclear and multinuclear osteoclasts, respectively.
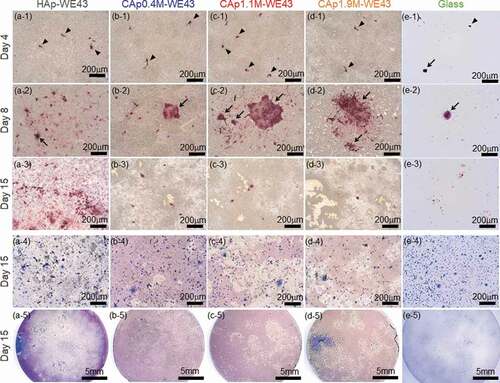
Figure 5. (a) Ratio of the total surface area occupied with TRAP-positive cells to the entire surface area of disc specimens, (b) apparent number of TRAP-positive cells and (c) apparent mean cell size. n = 1 on Days 4 and 8 and n = 2 on Day 15. The bar graphs on Day 15 show the mean values of two samples indicated by plots. The areas of the entire disc surface of WE43 and glass discs were 201 mm2 and 314 mm2, respectively.
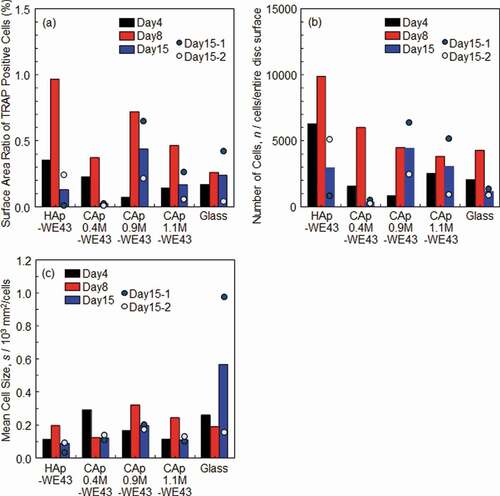
The number of TRAP-positive cells increased with an increase of culture period until Day 8 and decreased thereafter as shown in and ), while discolored regions (light color regions) appeared on the CAp-coated specimens as shown in and in the whole surface images in Fig. S1. Especially on the CAp1.1M- and CAp1.9M-coated specimens, TRAP-positive cells were obvious on Day 8 as shown in -2) and (d-2), while TRAP-positive cells were scarcely observed on Day 15 as shown in -3)-(d-3), S1 and S2. The total area of the discolored regions apparently increased with an increase of carbonate content rate as shown in -3)–(d-3), S1 and S2.
shows optical and topographic images of the TRAP-stained surface and SEM images of the Giemsa-stained surfaces of the HAp- and CAp1.1M-WE43 specimens. The optical and topographic images were taken with the same field of view. On the optical image of the CAp1.1M-WE43, many discolored regions were observed as indicated by arrows, while such a discolored region was seldom observed on the HAp-WE43. The shape and size of the discolored regions on the optical image corresponded to those of the light-blue recessed regions on the topographic image, and the SEM observation revealed that the CAp coating showed local cracking as indicated by white arrows (). The CAp0.4M- and CAp1.9M-WE43 surfaces showed similar morphology. It was suggested that the discolored regions corresponded to the cell-detached regions. The HAp coating showed no obvious cracking under SEM observation. It was revealed that multinucleated osteoclasts formed the cracks in the CAp coatings and the surface recessions, although they did not degrade the HAp coating.
Figure 6. (a, b) Optical images and (c, d) corresponding topographic images and (e, f) SEM surface images of (a, c, e) HAp-WE43 and (b, d, f) CAp1.1M-WE43 with TRAP-stained osteoclasts on Day 15. (a, b) optical images and (c, d) topographic images show the same field of view on HAp-WE43 and CAp1.1M-WE43, respectively. SEM images show different fields of view from optical images. Arrows in (a) and (b) indicate typical discolored regions and arrows in (c) and (d) indicate the corresponding dent regions, respectively. White arrows in (e) and (f) indicate typical local cracking.
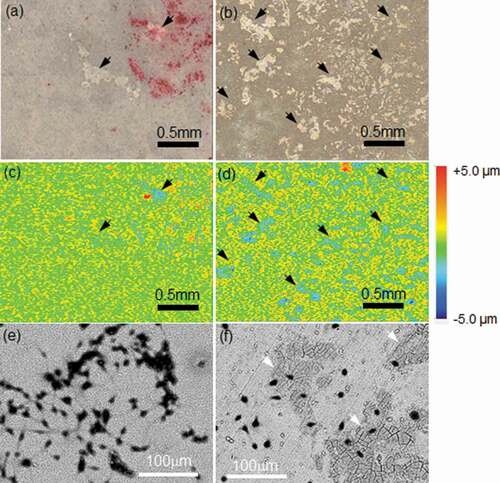
Cross-sectional SEM images of the coating and substrate underneath a multinucleated osteoclast cell body are shown in for the HAp- and CAp1.1M-WE43 specimens. The cross section was observed with an inclination angle of 45º. Since the images were observed with back-scattered electron, cell bodies, CAp and HAp coatings and substrate WE43 were observed in dark (black), bright (white) and mediate (light grey) contrast, respectively. In the case of HAp-WE43, neither degradation nor corrosion was observed in the HAp coating layer and WE43 substrate, respectively, under a multinucleated osteoclast cell body as well as outside of the cell body. Interestingly for the CAp1.1M coating, cracks and corrosion pits were formed in the CAp coating and substrate WE43, respectively, under a cell body, while such degradation was not observed outside of the cell body. The cracking of the CAp coating and the corrosion pits under cell bodies were also observed for the CAp0.4M- and CAp1.1M-WE43 specimens. It was confirmed that the multinucleated osteoclasts caused the degradation of the CAp coatings and substrate WE43 but did not degrade the HAp coating.
) shows an accumulated amount of Mg ions released from various specimens. No significant difference was observed in Mg ion release between HAp- and CAp-WE43 specimens, while the CAp-WE43 specimens showed a slightly larger Mg ion release than the HAp-WE43.
) shows an accumulated amount of Ca ions released from or deposited on specimens. Although Ca ion release was expected for the CAp-WE43 specimens due to the degradation of the CAp coatings by osteoclasts, Ca ion deposition from medium suppressed Ca ion release from the CAp0.4M and CAp1.1M coatings. In the case of CAp1.9M-WE43, Ca ion release and deposition were balanced. The HAp-WE43 showed clear Ca ion deposition. The glass showed a clear Ca ion release.
The corrosion of substrate WE43 should have induced pH increase which caused Ca ion deposition. Then, the relationship between Mg and Ca ion concentrations of medium taken on Days 8 and 15 was examined as shown in ). A very weak correlation with a correlation coefficient (r) of ca. 0.6 was obtained between Ca and Mg ion concentrations. A decrease of Ca ions with an increase of Mg ions indicated that the Ca ions deposited partly as a result of substrate WE43 corrosion. Therefore, the resorption of the CAp coatings by osteoclasts could not be examined by the change of Ca ion concentration in the case that the CAp coatings are formed on Mg/Mg alloy substrate.
3.3. Osteoblast response to CAp-coated WE43
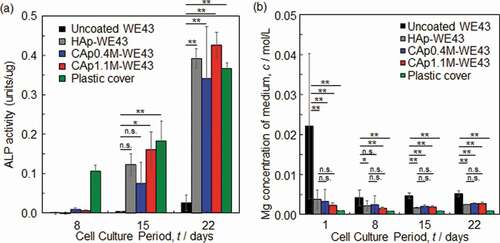
shows ALP activity and Mg ion concentration of medium as a function of the culture period. The surface optical and SEM images of the specimens with Giemsa-stained MC3T3-E1 osteoblasts cultured for 8–22 days are shown in Figs. S4-S6. ALP activity of MC3T3-E1 osteoblasts cultured on the CAp- and HAp-coated surfaces was expressed after Day 8 and increased with an increase of culture period, while that on the uncoated WE43 expressed slightly only after Day 15. The difference in ALP activity between uncoated and coated specimens was statistically significant after Day 15. No statistically significant difference was observed in ALP activity between HAp- and CAp-coated specimens. This indicated that the CAp and HAp coatings enhanced the osteoblast differentiation of MC3T3-E1 cells.
Magnesium ion concentration of medium decreased with the CAp and HAp coatings especially on Day 1. The CAp-coated specimens showed comparable Mg ion concentration to the HAp-WE43 for 22 days regardless of the carbonate content rate.
4. Discussion
4.1. Formation of CAp coatings
The formation of uniform CAp coatings on WE43 alloy was succeeded by the addition of NaHCO3 in the previously developed HAp coating solution [Citation12] as demonstrated by the position shift of (002)Ap peak to the lower angle and the significant increase of FTIR bands derived from CO32-. The position shift of (300)Ap peak to the higher angle and (002)Ap peak to the lower angle corresponds to the substitution of carbonate at hydroxyl site (A-site) and phosphate site (B-site), respectively [Citation26–Citation28]. The formed CAp was thus B-type and bone apatite is mainly B-type [Citation19]. The formation of B-type CAp coatings was reported for titanium by adding urea as a carbon dioxide source in the hydrothermal condition [Citation30]. The addition of carbonate ions in the solution for HAp synthesis is efficient to make apatite structure incorporate carbonate group.
The carbonate substitution ratio of CAp is generally evaluated from the relative IR absorption intensity ratio of CO32- band between HAp and CAp; however, the substance concentration and the IR absorption intensity often do not show a linear relationship in the diffuse reflectance method [Citation31] used in this study. In this study, the carbonate content rate, instead of carbonate substitution ratio, was estimated from the shift of (002)Ap peak using an Equationequation (1)(1)
(1) [Citation32].
where lc is the length of c-axis (Å) and xco3 is carbonate content rate (wt%). Assuming that the carbonate content rate of the HAp coating of HAp-WE43 was 0 wt%, the carbonate content rate of the CAp coatings of CAp0.4M-, CAp1.1M- and CAp1.9M-WE43 was ca. 17, 29 and 23 wt%, respectively. The carbon content rate of the CAp coatings was saturated over 1.1 mol/L of NaHCO3 concentration. It was revealed that the carbon content (carbonate substitution ratio) can be controlled by the NaHCO3 concentration of the coating solution. Also, the CAp coatings formed in this study were expected to be absorbed by osteoclast cells and enhance bone formation because bone apatite contains carbonate group with a comparable content rate of 10–20 wt% [Citation32].
The coating morphology changed by the carbonate substitution in the apatite structure. Rod-like particles formed in the HAp coating disappeared and the cauliflower-like morphology which was similar to the inner layer of the HAp coating was formed for the CAp coatings. The rod-like particles of the HAp coating were highly crystallized HAp crystal which preferentially grew along the c-axis of apatite structure [Citation14]. This type of morphological change and the decrease in crystallinity with carbonate substitution were observed for HAp and CAp coatings formed by hydrothermal method [Citation30]. The broadening and intensity decrease of (002)Ap peaks with carbonate substitution was observed as well as the disappearance of rod-like particles in this study. These results indicated that the crystallinity of apatite decrease with an increase of carbonate substitution.
4.2. Osteoclastic resorption of CAp coatings and its effect on CAp-coated WE43
The surface and cross-sectional observations in and revealed that the CAp coatings and the substrate WE43 showed cracking and corrosion pits, respectively, which was localized under the multinucleated osteoclast cell bodies. Such localized cracking and corrosion pits were not observed in the HAp coating and its substrate, respectively. In the bone resorption mechanism, the differentiated osteoclasts acidify a microenvironment under the cell body up to pH 4.5 by means of a proton pump, and subsequently, Cl− ions are secreted to the microenvironment to maintain the intracellular pH [Citation33]. The degradation of the CAp coatings in the acidified microenvironment formed by osteoclasts should have allowed the access of acidified fluid to substrate WE43, leading to the corrosion localized under the cell bodies. Since HAp shows much lower solubility than CAp at pH 3–5 [Citation21], the dissolution of the HAp coating did not occur under the cell bodies. It is thus demonstrated that the CAp coatings formed on WE43 can be degraded by microenvironmental acidification in the osteoclastic resorption mechanism.
Figure 7. (a, b) Low magnification and (c, d) high magnification cross-sectional SEM images of the region containing a multinucleated osteoclast cell body and substrate of (a, c) HAp-, (b, d) CAp1.1M-WE43 specimens on Day 15.
Meanwhile, Kim et al. reported that osteoclastic activities were suppressed in alkaline environments containing Mg ions which were created by the corrosion of Mg/Mg alloys [Citation22]. Janning et al. reported that the number of osteoclasts decreased during the first 4 weeks in the tissue around Mg(OH)2 cylinders implanted in rabbit femur condyle [Citation23]. Maradze et al. indicated that the effect of Mg corrosion products on osteoclasts depended on the concentration and the high concentration negatively affected osteoclast precursor cell number and mature osteoclast cell function [Citation24]. The HAp and CAp coatings moderated the corrosion speed of substrate Mg alloys from the beginning as shown in . These facts suggest the possibility that the CAp coatings can moderate the corrosion of WE43 enough to not disturb osteoclasts from resorbing CAp.
On Day 15, many osteoclasts detached from CAp-coated surfaces. The acid (HCl) secreted by osteoclasts enhances the corrosion under the cell body. In the corrosion reaction of Mg alloys as described by EquationEquations (2)(2)
(2) and (Equation3
(3)
(3) ), H2 gas generates and pH of the surrounding environment increases.
The increase in surrounding pH causes the denaturation of proteins including cell adhesion proteins and the cell death. Additionally, H2 gas generation can lift the cell body. The local cell death due to the local corrosion of Mg alloy substrate was reported for HAp- and OCP-coated AZ31 on which MG63 osteoblasts were cultured [Citation34]. These environment changes led to the detachment of osteoclasts thereafter. The cell detached regions (discolored regions) on the CAp-coated surfaces increased with an increase of carbonate content rate on Day 15 (, S1 and S2). The thickness of CAp coatings decreased with an increase of carbonate content rate (), indicating the decrease in the corrosion protectiveness. As a result, the cell detachment was enhanced with an increase of the carbonate content rate. Since the osteoclast behavior depended on the concentration of Mg ions, pH and coexisting substances which varied depending on the corrosion speed of and the distance from the implanted Mg materials [Citation23–Citation25], further examination is necessary to understand the entire degradation of the CAp-coated Mg alloy accompanying osteoclastic resorption.
Differentiation of precursor cells to multinucleated osteoclasts was enhanced by the CAp and HAp coatings comparing to that on the glass as revealed by the larger number of multinucleated cells on the CAp and Hap coatings than that on the glass shown in , , S1 and S2. Differentiation of precursors to multinucleated osteoclasts was enhanced on CAp block than that on sintered HAp block [Citation35]. The CAp coatings in this study are presumably able to enhance the differentiation of precursors to multinucleated osteoclasts according to the slightly higher expression frequency of large-sized multinucleated cells on the CAp-coated surfaces than that on the HAp-coated surface (, S1 and S2).
4.3. Effect of CAp coating on bone formation ability of osteoblasts
The CAp coatings enhanced the ALP expression level from osteoblast cells comparable to the HAp coating as shown in ). An increase of ALP expression of osteoblast cells is generally accompanied by an increase of the expression of osteoblastic differentiation markers such as type I collagen, osteopontin and osteocalcin on CAp, sintered HAp, Ti and zirconia surfaces [Citation21,Citation36,Citation37]. With an increase of culture period, calcium phosphate particles with a diameter of several micrometers increased on the CAp- and HAp-coated surfaces (Fig. S6). The enhancement of bone formation on the CAp-coated Mg alloy is thus expected. On the other hand, human bone marrow cells cultured on low crystalline CAp blocks fabricated by a dissolution-precipitation method showed higher expression of the osteoblastic differentiation markers than those cultured on sintered HAp blocks [Citation35]. Two reasons are considered for comparable ALP activity between HAp- and CAp-WE43 specimens in this study: coating morphology and effect of Mg ions. Micromorphology of HAp and OCP coatings influenced the adhesion and proliferation of MG63 cells: the sparse structure of the coating caused the sparse formation of focal contacts which retarded the cell proliferation [Citation34]. The formation of focal contacts was limited on the tips of rod-like crystals in the case of HAp coating [Citation34]. Since the surface of the CAp coatings was smoother than that of the HAp coating as shown in , MC3T3-E1 osteoblasts could adhere to the CAp coatings with denser focal contacts than those to the HAp coating. It was reported that Mg ions promoted ALP expression of MC3T3-E1 cells and enhance bone bonding of Ti surface in vivo [Citation38]. The Mg ion concentration of medium with the HAp- and CAp-WE43 specimens was equivalent as shown in ). It is readily suggested that the effect of Mg ions on the ALP activity was comparable between HAp- and CAp-WE43 specimens.
4.4. Effect of CAp coating on corrosion of substrate WE43
Under culturing osteoclasts and osteoblasts, the amount of Mg ions released from the CAp-W43 specimens was equivalent to that of the HAp-WE43 for 15 or 22 days as shown in ) and (b), respectively. This fact demonstrates that the initial corrosion protectiveness of the CAp coatings is equivalent to that of the HAp coating although the CAp coatings were thinner than the HAp coating. The HAp- and CAp-WE43 specimens after 15 or 22 days of cell culture tests did not show obvious corrosion. The HAp coating moderated the corrosion of AZ31 alloy and prevented the formation of gas cavity in the subcutaneous tissue of mice for 16 weeks [Citation13]. It is thus expected that the CAp coatings can moderate the in vivo corrosion of WE43 without the formation of a gas cavity at least for 2–3 weeks. However, 2–3 weeks are shorter than the bone healing period of 3–6 weeks for upper limb and finger bones. Further investigation is necessary to understand the degradation behavior of the CAp-coated Mg alloys: the effect of carbonate substitution ratio on osteoclastic resorption behavior and the long-term degradation behavior in the presence of osteoclastic cells.
Figure 8. Accumulated amount of (a) Mg ions and (b) Ca ions released from or deposited on various specimens under culturing osteoclasts. (c) Relationship between Mg and Ca ion concentration of medium in which osteoclasts were cultured on various specimens. The osteoclast precursors were seeded on the specimen surfaces after the pre-immersion in the medium for 1 day.
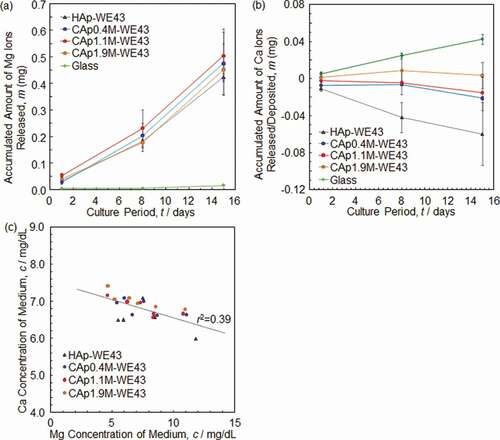
Figure 9. (a) ALP activity on various specimens and (b) Mg ion concentration of medium in which osteoblasts were cultured on various specimens. Osteoblasts were seeded on the specimen surfaces on Day 0. n.s.: not significant, *: p < 0.05, **: p < 0.01.
5. Conclusions
The B-type CAp coatings with various carbonate content rates were formed on WE43 alloy using the previously developed HAp coating solution with the addition of 0.4, 1.1 and 1.9 mol/L NaHCO3. The carbonate content rate increased with an increase of NaHCO3 concentration up to 1.1 mol/L and then it was saturated. The CAp and HAp coatings enhanced the differentiation of osteoclast precursors to multinucleated osteoclasts in comparison with a glass surface. Only CAp coatings showed the degradation by multinucleated osteoclasts, and the cracking of CAp coatings and the corrosion pits of substrate WE43 were strongly localized under the cell bodies. The ALP activity of osteoblasts was enhanced with the CAp coatings comparable to that with the HAp coating. The corrosion protectiveness of the CAp coatings was equivalent to that of the HAp coating. The Mg ion release from the CAp-coated specimens was 1/5 of that from the uncoated WE43 on the first day of culturing osteoblasts. For the subsequent 22 days with osteoblasts, the Mg ion release from the CAp-coated specimens was 1/2 of that from the uncoated WE43. The developed CAp coating is highly potential as a bioabsorbable and corrosion-control coating. A further investigation like a long-term degradation test of the CAp-coated Mg alloys is necessary.
tsta_a_1761237_sm2312.pdf
Download PDF (3.9 MB)Disclosure statement
No potential conflict of interest was reported by the authors.
Supplementary material
Supplemental data for this article can be accessed here.
Additional information
Funding
References
- Witte F. The history of biodegradable magnesium implants: A review. Acta Biomater. 2010;6(5):1680–1692.
- Zeng RC, Dietzel W, Witte F, et al. Progress and challenge for magnesium alloys as biomaterials. Adv Biomater. 2008;10(8):B3–B14.
- Zhao DW, Witte F, Lu FQ, et al. Current status on clinical applications of magnesium-based orthopaedic implants: A review from clinical translational perspective. Biomaterials. 2017;112:287–302.
- Al-Abdullat Y, Tsutsumi S, Nakajima N, et al. Surface modification of magnesium by NaHCO3 and corrosion behavior in Hank’s solution for new biomaterial applications. Mater Trans. 2001;42(8):777–1780.
- Kuwahara H, Al-Abdullat Y, Mazaki N, et al. Precipitation of magnesium apatite on pure magnesium surface during immersing in Hank’s solution. Mater Trans. 2001;42(7):1317–1321.
- Hornberger H, Virtanen S, Boccaccini AR. Biomedical coatings on magnesium alloys - A review. Acta Biomater. 2012;8(7):2442–2455.
- Plaass C, Ettingerx S, Sonnow L, et al. Early results using a biodegradable magnesium screw for modified chevron osteotomies. J Orthop Res. 2016;34(12):2207–2214.
- Joner M, Ruppelt P, Zumstein P, et al. Preclinical evaluation of degradation kinetics and elemental mapping of first and second generation bioresorbable magnesium scaffolds. EuroIntervention. 2018. DOI:https://doi.org/10.4244/EIJ-D-17-00708.
- Waksman R, Zumstein P, Pritsch M, et al. Second-generation magnesium scaffold Magmaris: device design and preclinical evaluation in a porcine coronary artery model. EuroIntervention. 2017;13(4):440–449.
- Kamrani S, Fleck C. Biodegradable magnesium alloys as temporary orthopaedic implants: a review. Biometals. 2019;32(2):185–193.
- Li L, Zhang M, Li Y, et al. Corrosion and biocompatibility improvement of magnesium-based alloys as bone implant materials: a review. Regen Biomater. 2017;4(2):129–137.
- Hiromoto S. High corrosion resistance of magnesium coated with hydroxyapatite directly synthesized in an aqueous solution. Electrochim Acta. 2009;54(27):7085–7093.
- Hiromoto S, Inoue M, Taguchi T, et al. In vitro and in vivo biocompatibility and corrosion behaviour of a bioabsorbable magnesium alloy coated with octacalcium phosphate and hydroxyapatite. Acta Biomater. 2015;11:520–530.
- Tomozawa M, Hiromoto S. Microstructure of hydroxyapatite- and octacalcium phosphate-coatings formed on magnesium by a hydrothermal treatment at various pH values. Acta Mater. 2011;59(1):355–363.
- Tomozawa M, Hiromoto S, Harada Y. Microstructure of hydroxyapatite-coated magnesium prepared in aqueous solution. Surf Coat Tech. 2010;204(20):3243–3247.
- Kasuga T. Coatings for metallic biomaterials. In: Niinomi M, editor. Metals for biomedical devices. Camridge(UK): Woodhead Publishing Limited; 2010. p. 260–282.
- Kanazawa M, Tsuru K, Fukuda N, et al. Evaluation of carbonate apatite blocks fabricated from dicalcium phosphate dihydrate blocks for reconstruction of rabbit femoral and tibial defects. J Mater Sci Mater Med. 2017;28(6):85.
- Mano T, Morotomi A, Mori Y, et al. Late foreign body reaction to a biodegradable mini-plate in orthognathic surgery. J Jaw Deform. 2007;17(4):272–275.
- Ishikawa K. Bone substitute fabrication based on dissolution-precipitation reactions. Materials. 2010;3(2):1138–1155.
- Doi Y, Shibutani T, Moriwaki Y, et al. Sintered carbonate apatite as bioresorbable bone substitutes. J Biomed Mater Res. 1998;39(4):603–610.
- Ishikawa K. Carbonate apatite bone replacement: learn from the bone. J Ceram Soc Jpn. 2019;127(9):595–601.
- Kim HK, Han HS, Lee KS, et al. Comprehensive study on the roles of released ions from biodegradable Mg-5 wt% Ca-1 wt% Zn alloy in bone regeneration. J Tissue Eng Regen Med. 2017;11(10):2710–2724.
- Janning C, Willbold E, Vogt C, et al. Magnesium hydroxide temporarily enhancing osteoblast activity and decreasing the osteoclast number in peri-implant bone remodeling. Acta Biomater. 2010;6(5):1861–1868.
- Maradze D, Musson D, Zheng Y, et al. High magnesium corrosion rate has an effect on osteoclast and mesenchymal stem cell role during bone remodelling. Sci Rep. 2018;8(1):10003.
- Mammoli F, Castiglioni S, Parenti S, et al. Magnesium is a key regulator of the balance between osteoclast and osteoblast differentiation in the presence of Vitamin D3. Int J Mol Sci. 2019;20:385.
- Zapanta-LeGeros R. Effect of carbonate on the lattice parameters of apatite. Nature. 1965;206(982):403–404.
- LeGeros RZ, Tung MS. Chemical stability of carbonate- and fluoride-containing apatite. Caries Res. 1983;17(5):419–429.
- Suetsugu Y. Carbonate group in apatite structure. J Soc Inorg Mater Jpn. 1996;3(1):48–54.
- Cao X, Harris W. Carbonate and magnesium interactive effect on calcium phosphate precipitation. Environ Sci Technol. 2008;42(2):436–442.
- Wei X, Fu C, Savino K. Carbonated hydroxyapatite coatings with aligned crystal domains. Cryst Growth Des. 2012;12(7):3474–3480.
- Ochiai S. Diffuse reflection measurements. In: Tasumi M, editor. Experimental infrared spectroscopy - fundamentals and practical methods. Tokyo: S.T. Japan Inc.; 2012. p. 79–83.
- Ohtsuka M, Matsuda Y. Physicochemical properties of synthetic apatite and its application study as biomaterials. J Assoc Mater Eng Res. 1991;4(2):128–141.
- Teitelbaum SL. Bone resorption by osteoclasts. Science. 2000;289(5484):1504–1508.
- Hiromoto S, Yamazaki T. Micromorphological effect of calcium phosphate coating on compatibility of magnesium alloy with osteoblast. Sci Tech Adv Mater. 2017;18(1):96–109.
- Nagai H, Kobayashi-Fujioka M, Fujisawa K, et al. Effects of low crystalline carbonate apatite on proliferation and osteoblastic differentiation of human bone marrow cells. J Mater Sci Mater Med. 2015;26(2):99.
- Yoshida E, Yoshimura Y, Uo M, et al. Influence of nanometer smoothness and fibronectin immobilization of titanium surface on MC3T3-E1 cell behavior. J Biomed Mater Res A. 2012;100(6):1556–1564.
- Ito H, Sasaki H, Saito K, et al. Response of osteoblast-like cells to zirconia with different surface topography. Dent Mater J. 2013;32(1):122–129.
- Okuzu Y, Fujibayashi S, Yamaguchi S, et al. Strontium and magnesium ions released from bioactive titanium metal promote early bone bonding in a rabbit implant model. Acta Biomater. 2017;63:383–392.