
 ?Mathematical formulae have been encoded as MathML and are displayed in this HTML version using MathJax in order to improve their display. Uncheck the box to turn MathJax off. This feature requires Javascript. Click on a formula to zoom.
ABSTRACT
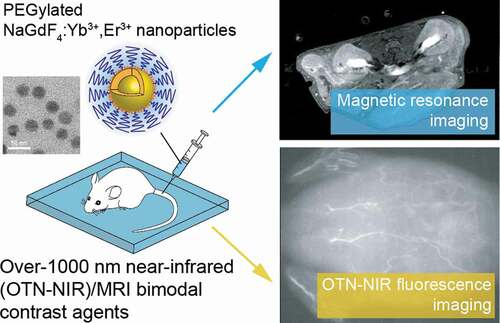
Rare-earth-doped nanoparticles (NPs), such as NaGdF4 nanocrystals doped with light-emitting rare earth ions, are promising bimodal probes that allow the integration of over 1000 nm near-infrared (OTN-NIR; NIR-II/III) fluorescence imaging and magnetic resonance imaging (MRI) of live bodies. A precise control of the particle size is the key factor for achieving a high signal-to-noise ratio in both NIR fluorescence and MR images and for regulating their function in the body. In this study, size-controlled NaGdF4:Yb3+, Er3+ NPs prepared by stepwise crystal growth were used for in vivo bimodal imaging. Hexagonal NaGdF4:Yb3+,Er3+ NPs coated with poly(ethylene glycol)-poly(acrylic acid) block copolymer, with hydrodynamic diameters of 15 and 45 nm, were prepared and evaluated as bimodal NPs for OTN-NIR fluorescence imaging and MRI. Their longitudinal (T1) and transverse (T2) relaxation rates at the static magnetic field strength of 1.0 T, as well as their cytotoxicity towards NIH3T3 cell lines, were evaluated and compared to study the effect of size. Using these particles, blood vessel visualization was achieved by MRI, with the highest relaxometric ratio (r1/r2) of 0.79 reported to date for NaGdF4-based nanoprobes (r1 = 19.78 mM−1 s−1), and by OTN-NIR fluorescence imaging. The results clearly demonstrate the potential of the size-controlled PEG-modified NaGdF4:Yb3+,Er3+ NPs as powerful ‘positive’ T1-weight contrast MRI agents and OTN-NIR fluorophores.
Graphical abstract
1. Introduction
Precise detection and diagnosis are key for the successful treatment of diverse diseases at an early stage [Citation1,Citation2]. Over the past decades, various imaging techniques, including fluorescence imaging, magnetic resonance imaging (MRI), X-ray computed tomography, positron emission tomography, and ultrasound, have been developed and combined for bimodal or multimodal imaging. These modalities have led to a rapid progress in understanding the pathophysiological phenomena in a live body [Citation3–7]. Among these modalities, MRI is one of the foremost techniques used for developing the multimodal imaging technology because it facilitates deep tissue analysis and high soft-tissue contrast, and it is also widely used in clinical studies. To improve the spatial resolution of MR images, small paramagnetic molecules, such as Gd3+-based longitudinal (T1) contrast agents, are generally used for shortening the relaxation time of water, because Gd complexes are stable, and they maintain strong paramagnetic characteristics [Citation8,Citation9]. However, the spatiotemporal resolution and sensitivity provided by these NPs should be improved further for their practical application in tumor detection.
Optical imaging using fluorescent nanomaterials that can also enhance the MRI signal is considered to be a powerful strategy, owing to high spatiotemporal resolution and high sensitivity of the nanomaterials [Citation10,Citation11]. Near-infrared (NIR) fluorescence imaging has received increased attention in molecular imaging and clinical diagnosis owing to its advantages over imaging in the visible spectral range. The low absorption and scattering of the NIR light by biological tissues enables the investigation of deep tissues down to the depth of a few centimeters [Citation12,Citation13]. According to the optical properties of the target (i.e. skin, blood, or organs) and the availability of the imaging probes, the NIR ranges of NIR-I (650–950 nm), NIR-II (1000–1350 nm) [Citation14,Citation15], and NIR-III (1500–1800 nm) are classified as biological windows [Citation16,Citation17]. A window that combines NIR-II and NIR-III is also collectively referred to as over 1000 nm wavelength near-infrared (OTN-NIR) window [Citation12,Citation18]. Various OTN-NIR probes, including NIR organic dye-loaded polymer micelles [Citation17], single-walled carbon nanotubes [Citation19–22], Ag2S-based semiconductor quantum dots (QDs) [Citation23,Citation24], and rare-earth-doped ceramic NPs (RED-CNPs) [Citation25,Citation26], have been demonstrated to be applicable in the in vivo bioimaging of deep tissues. Among these OTN-NIR nanoprobes, RED-CNPs are promising multimodal agents owing to their narrow spectral lines, high photostability, low toxicity, and long NIR luminescence lifetimes [Citation27,Citation28]. In addition, their optical properties, including their absorption and fluorescence, can be precisely tuned by co-doping different rare-earth ions in the host matrix [Citation12,Citation16,Citation29–31]. To ensure sufficient biocompatibility and dispersibility of the RED-CNPs in physiological environments, the surfaces of these NPs are often modified with biocompatible poly(ethylene glycol) (PEG)-based polymers. The PEG-modified RED-CNPs are not only suitable for visualizing blood vessels and organs in a live body, such as that of a live mouse [Citation25,Citation26], but also for nanothermometry [Citation32–34] and photodynamic therapy [Citation35–38].
From the perspective of the development of an OTN-NIR/MRI bimodal nanoprobe, Gd3+-containing NPs have been studied as bimodal or multimodal probes. Examples of such NPs include core–shell RED-CNPs [Citation39–43] and Gd3+-doped iron oxide particles conjugated with fluorescence probes [Citation44] or QDs [Citation45]. The synthesis of core–shell RED-CNPs by layer-by-layer [Citation46,Citation47] or epitaxial growth [Citation48] is a highly effective strategy for imparting them with multiple functions and controlling their size. A facile and reliable method for controlling the size of core–shell RED-CNPs is to add different amounts of the shell precursors (i.e. NaYF4 and NaGdF4) into the reaction vessel with a fixed amount of core RED-CNPs [Citation49,Citation50]. Although NaGdF4-based NPs, such as NaGdF4:Er3+,Yb3+ [Citation39], NaYF4:Er3+,Yb3+@NaGdF4 [Citation51], and NaErF4@NaGdF4@SiO2 [Citation42] have been developed for upconversion fluorescence and MR bimodal imaging, only few studies have been reported on their use for NIR-II fluorescence imaging. Such studies include the use of 30 nm NaGdF4:Nd3+@NaGdF4 NPs for NIR-II/MRI bimodal liver cancer imaging [Citation52] and the use of 50 nm NaYF4:5%Nd3+@NaGdF4 NPs for trimodal MRI, X-ray computed tomography, and OTN-NIR fluorescence imaging [Citation53]. Further, most studies on the use of such core–shell NPs as contrast agents have focused on the demonstration of their multimodality and not on the evaluation of the intrinsic MR T1-weighted contrast using the ratio of the longitudinal (r1) to transverse relaxivity (r2), that is, r1/r2. In addition, the size of the RED-CNPs affects their luminescence properties and their capability to improve the MRI contrast; the NIR luminescence intensity of the RED-CNPs decreases significantly with a decrease in the NP size, and the relaxivities of the surrounding water protons are governed by the location of Gd3+ in the NPs and the NP size. Therefore, it is essential to develop efficient and robust methods that allow precise control over the size of the RED-CNPs for realizing optimal MRI contrast and fluorescence properties.
In this paper, we report the synthesis of size-controlled OTN-NIR/MRI bimodal contrast agents based on NaGdF4:Yb3+,Er3+ NPs coated with poly(ethylene glycol)-block-poly(acrylic acid) copolymer (PEG-b-PAAc). Specifically, we prepared PEGylated NaGdF4:Yb3+,Er3+ NPs with hydrodynamic diameters of 15 nm and 45 nm and evaluated their paramagnetic properties (r1 and r2), NIR fluorescence, and cell toxicity toward NIH3T3 cells. Further, we demonstrated in vivo T1-weighted MRI and OTN-NIR fluorescence imaging of the blood vessels of mice, which was realized by the intravenous administration of the PEG-NaGdF4:Yb3+,Er3+ NPs.
2. Experimental section
2.1. Materials
All reagents were used as received without further purification. PEG-b-PAAc (Mn: 5000-b-2800 (g/mol), Mw/Mn: 1.2) was purchased from Polymer Source (Montreal, Canada). Oleic acid (OA, 90%) and nitrosyl tetrafluoroborate (NOBF4) were purchased from Sigma-Aldrich (St Louis, Missouri, US). Gadolinium(III) oxide (Gd2O3, 99.9%), ytterbium(III) oxide (Yb2O3, 99.9%), erbium(III) oxide (Er2O3, 99.99%), ethanol (99.5%), methanol (99.8%), 1-octadecene (ODE, 90.0%), cyclohexane (99.5%), trifluoroacetic acid (97.0%), sodium trifluoroacetic acid (CF3COONa, 98.0%), and N,N-dimethylformamide (DMF; 99.5%) were purchased from Wako Pure Chemical Industries (Osaka, Japan). Gadoterate meglumine (Gd-DOTA; Magnescope®) was purchased from Guerbet Japan, Inc. (Tokyo, Japan). Normal saline was purchased from Otsuka Pharmaceutical Factory, Inc. (Tokushima, Japan). Phosphate-buffered salt tablets were purchased from Takara Bio Inc. (Tokyo, Japan) to prepare phosphate-buffered saline (PBS).
2.2. Synthesis of PEGylated NaGdF4:Yb3+,Er3+ NPs
2.2.1. Synthesis of OA-capped NaGdF4:Yb3+,Er3+ NPs
OA-capped NaGdF4:Yb3+,Er3+ NPs were prepared by a thermal decomposition method, as described previously [Citation30,Citation54]. For the synthesis of the precursor, 1.25 mmol of a mixture of rare earth oxides composed of 0.975 mmol of Gd2O3, 0.25 mmol of Yb2O3, and 0.025 mmol of Er2O3 (Gd:Yb:Er = 78:20:2 mol%) was mixed with 5 mL of distilled water and 5 mL of trifluoroacetic acid in a 100 mL three-necked round-bottom flask. Then, the mixture was heated at 130°C on an oil bath under magnetic stirring until a transparent solution was obtained. During this process, residual water and trifluoroacetic acid evaporated, and a rare earth–trifluoroacetic acid complex was obtained as a solid. For the synthesis of NaGdF4 NPs co-doped with 2 mol% Er3+ and 20 mol% Yb3+, the obtained precursor solid was dissolved in a solvent mixture comprising 2.5 mmol of trifluoroacetic acid sodium and 7.5 mL of ODE and pre-heated to 110°C in an oil bath. Subsequently, 7.5 ml of OA was added to the reaction mixture, and the resulting mixture was degassed for ~30 min at 130°C under vacuum. Another reaction vessel containing 12.5 mL of degassed ODE and 12.5 mL of OA was heated to 315°C for removing residual water. The hot precursor solution was then added to the reaction vessel using a syringe and pump system at an injection rate of 1.5 mL/min under nitrogen atmosphere. Next, the reaction mixture was cooled to room temperature (25°C). The OA-capped NaGdF4:Yb3+,Er3+ NPs were purified by centrifugal washing (2.0 × 10⁴ g, 10 min × 3) with ethanol and hexane and redispersed in 10 mL of cyclohexane.
2.2.2. Stepwise crystal growth of NaGdF4:Yb3+,Er3+ NPs
The procedure for the stepwise crystal growth on the NP surfaces is based on that reported by Skripka et al. [Citation55] NaGdF4:Yb3+,Er3+ NPs dispersed in 10 mL of cyclohexane were used as the precursors. To regulate the rate of the crystal growth around the NaGdF4 NPs, the procedure described above was applied, but the amount of the NaGdF4 NPs was changed with respect to that of the precursor solution, which was maintained constant. First, different amounts (20, 40, 60, 80, and 100 mg) of the NaGdF4:Yb3+,Er3+ NPs were added to the reaction vessel containing 12.5 mL of degassed ODE and 12.5 mL of OA, and the rare earth–trifluoroacetic acid complex solution was added to the vessel. Thereafter, the mixture was heated at 315°C for 45 min under nitrogen atmosphere.
2.2.3. Preparation of PEG-NaGdF4:Yb3+,Er3+ NPs
The OA ligands on the surfaces of the NaGdF4:Yb3+,Er3+ NPs were replaced with PEG-b-PAAc by a stepwise ligand-exchange process, according to previously reported methods [Citation17,Citation56,Citation57], with slight modifications. The OA-capped NaGdF4:Yb3+,Er3+ NPs were dispersed in cyclohexane (1 mg/mL) and 50 mg of NOBF4 was dissolved in 10 mL of DMF. Then, 5 mL of the OA-capped NaGdF4:Yb3+, Er3+ NPs dispersed in cyclohexane was gradually added to the DMF solution, and the mixture was stirred for 12 h at room temperature. To remove the aggregates in the DMF solution, the BF4-modified NaGdF4:Yb3+,Er3+ NPs were purified by centrifugal washing (1.0 × 10⁴ g, 10 min), and the purified DMF suspension of the BF4-NaGdF4:Yb3+,Er3+ NPs was further purified by centrifugal washing (4.0 × 10⁴ g, 20 min) with chloroform. The collected BF4-NaGdF4:Yb3+,Er3+ NPs were then redispersed in 10 mL of DMF. To replace the BF4 ligands with PEG-b-PAAc, the BF4-NaGdF4:Yb3+,Er3+ NP suspension was slowly added to a solution of PEG-b-PAAc (25 mg) in 5 mL of DMF. The mixture was stirred for 12 h, and the PEG-NaGdF4:Yb3+,Er3+ NPs were purified using dialysis membranes (Molecular weight cut-off: 15,000) through dialysis against water for 24 h. Finally, the PEG-NaGdF4:Yb3+,Er3+ NPs were dispersed in 5 mL of pure water.
2.3. Characterization of NaGdF4:Yb3+,Er3+ NPs
The morphologies and size distributions of the PEG-NaGdF4:Yb3+,Er3+ NPs were investigated by transmission electron microscopy (TEM; HD-2300, Hitachi, Japan). The crystalline phase of the OA-capped NaGdF4:Yb3+,Er3+ NPs was identified by X-ray diffraction (XRD) (RINT-TTRIII, RIGAKU, Japan). The hydrodynamic diameters of the NPs were determined using a dynamic light scattering (DLS) particle size analyzer (LB-250, Horiba, Japan); the OA-capped NaGdF4:Yb3+,Er3+ NPs and PEG-NaGdF4:Yb3+,Er3+ NPs used for DLS were diluted with cyclohexane and water, respectively, to a particle concentration of 1.0 and 17.6 mg/mL, respectively. The Gd3+ concentration in each sample was determined from the weight of NaGdF4:Yb3+,Er3+ NPs, whose stoichiometry was confirmed by the XRD analysis. The NIR luminescence images of the PEG-NaGdF4:Yb3+,Er3+ NPs were acquired using a portable NIR fluorescence in vivo imaging system (SAI-1000, Shimadzu, Japan) [Citation31]. The colloidal stability of the PEG-NaGdF4:Yb3+,Er3+ NPs in physiological saline and pure water was investigated by measuring their absorbance at 550 nm using an ultraviolet-visible spectrophotometer (V630, JASCO, Japan).
2.4. Cytotoxicity assay
The cytotoxicity of the as-prepared PEG-NaGdF4:Yb3+,Er3+ NPs was evaluated in vitro through an MTT assay using NIH3T3 cells (ATCC). The NIH3T3 cells were seeded at a density of 104 cells/well in a 96-well plate and cultured in a minimum essential medium containing 10% fetal bovine serum and 1% penicillin–streptomycin at 37°C in a humidified atmosphere with 5% CO2. The cells were exposed to different concentrations of the PEG-NaGdF4:Yb3+,Er3+ NPs, ranging from 0.01 to 10 mM, for 24 h at 37°C. The cells were then washed with 9.6 mM PBS. A mixture of water-soluble tetrazolium salts, WST-8, and the culture medium was added to each well, and the cells were incubated for 30 min. The cell viability was evaluated by measuring the absorption of WST-8 at 450 nm in a microplate reader (Multiscan FC, Thermo Scientific, Massachusetts, US). The experiment was repeated five times.
2.5. In vitro MR properties
The longitudinal and transverse relaxation times (T1 and T2, respectively) at different Gd3+ concentrations ranging from 0 to 1 mM were determined with an MRI system at 23°C. The NaGdF4:Yb3+,Er3+ NPs were dispersed in water, and the MRI signals of the NP samples were acquired with a 1.0 T-MRI scanner (ICON, Bruker Biospin, Ettlingen, Germany) using a volume coil (35 mm inner diameter, transmission and reception, Aspect Imaging, Shoham, Israel). An aqueous solution of the contrast agent was placed in a polymerization chain reaction (PCR) tube cluster plate, and the PCR tube cluster plate was set at the center of the volume coil. The sample was maintained at room temperature (23.0 ± 0.5°C) using a gradient coil cooling system and air conditioners. Then, using the MRI scanner, horizontal single-slice T1-weighted and T2-weighted MR images were acquired with the following parameters: spin echo, repetition time (TR) = 400 ms, echo time (TE) = 10 ms, slice thickness = 2.0 mm, matrix = 256 × 256, field of view (FOV) = 38.4 × 38.4 mm, number of averages (NA) = 1, number of slices = 1. For calculating T1 and r1, horizontal single-slice inversion-recovery MRI was performed through rapid acquisition using the relaxation enhancement (RARE) sequence with the following parameters: TR = 10,000 ms; TE = 20 ms; inversion time = 52, 100, 200, 400, 800, 1600, 3200, and 6400 ms; matrix size = 128 × 128; FOV = 38.4 × 38.4 mm; slice thickness = 2.0 mm; RARE factor = 4; and NA = 1. For T2 and r2 calculation, horizontal single-slice multi-echo imaging was conducted using the following parameters: TR = 15,000 ms, TE = 12 to 768 ms (12 ms interval, 64 steps), number of echoes = 64, matrix size = 64 × 64; FOV = 38.4 × 38.4 mm; slice thickness = 3.0 mm; and NA = 1. The total acquisition time was 16 min. The r2 relaxivity maps were obtained by a non-linear least square fit analysis using the multi-echo imaging. Then, the r1 and r2 relaxivities of each CNP were calculated from the concentration-dependent plots of the measured T1 and T2 relaxation times using the following equation:
where 1/Ti(0) (s−1) denotes the longitudinal (i = 1) or transverse (i = 2) relaxation rate in the absence of paramagnetic species. [Gd3+] represents the concentration of Gd3+ in the NP suspension.
2.6. In vivo MRI
The animal care for MRI experiments was performed in accordance with the guidelines of the care and use of laboratory animals, as stated by the National Institutes for Quantum and Radiological Science and Technology (QST, Chiba, Japan) and approved by the committee for the animal experiments of QST. Male BALB/c nu/nu mice (10 weeks old, 23.8 g, Japan SLC, Japan) were inoculated subcutaneously with 100 μL of Colon-26 cells (1 × 10⁶ cells/mL), and the tumor growth was allowed until the tumor size reached 500 mm3 (~5 mm in diameter). The mice were then anesthetized with a 3% isoflurane solution; they were placed in prone position, and anesthesia was maintained at 1.5% for MRI scanning. During the experiment, warm air was flown over the animal to maintain its body temperature at 36.5°C. The subcutaneous tumor-bearing mice were intravenously injected with 15 ± 4 and 45 ± 20 nm PEG-NaGdF4:Yb3+,Er3+ NPs via the tail vein at the dose of 2 µmol of Gd3+. The signal intensities of the regions of interest (ROI) in the large vessel (blood) and muscle were analyzed using a software (Osirix, Pixmeo SARL, Switzerland), and the results were compared after normalization.
For the analysis of the subcutaneous tumors, 2D multi-slice T1-weighted MR images were obtained using a conventional SE sequence with the following parameters: TR = 400 ms, TE = 10 ms, matrix size = 256 × 256, FOV = 30.0 × 30.0 mm2, slice thickness = 1.0 mm, Fat-Sup = on, and NA = 4. Slice orientation was transverse. The images were obtained at the nominal voxel resolution of 156 × 156 × 1000 µm3. For T2-weighted MRI, a multi-slice multi-echo SE sequence (TR = 3000 ms, slice thickness = 1 mm, FOV = 30.0 × 30.0 mm, matrix = 256 × 256, slice orientation = transaxial, and NA = 1) was used with echo times ranging from 10 to 140 ms in steps of 10 ms.
2.7. In vivo OTN-NIR fluorescence imaging
The animal care and experiments were performed in accordance with the guidelines of the care and use of laboratory animals, as stated by the Tokyo University of Science. Four-week-old male ICR mice were purchased from Japan SLC, Inc., Japan. Before the imaging experiments, the mice were fed with the AIN-76A diet (Research Diets Inc., New Jersey, US) for 2 weeks to reduce the levels of body phosphorescent alfalfa. Then, the mice (6 weeks old, 32.0 g) were anesthetized, and their hair was removed to eliminate light scattering. Subsequently, 200 µL of the PEG-NaGdF4:Yb3+,Er3+ NP suspension in normal saline (9 mg/mL sodium chloride) was injected into the tail vein at an injection rate of 13.3 µL/s. The NIR fluorescence images were obtained using an SAI-1000 system.
3. Results and discussion
3.1. Synthesis and characterization of size-controlled NaGdF4:Yb3+,Er3+ NPs
In this study, size-controlled NPs were synthesized by the stepwise crystal growth around the seed NPs. The growth rate of the RED crystalline layer can be decreased by increasing the amount of the seed NPs in the reaction mixture, assuming that the crystalline layer grows uniformly on the surface of each particle. Therefore, the number density of the seed NPs in the suspension determines the thickness of the newly grown crystalline layer. displays a schematic of the synthesis process. First, the OA-capped NaGdF4:Yb3+,Er3+ NPs were synthesized by a thermal decomposition method from the rare earth ion–trifluoroacetate complex. In this study, the size of the seed NPs was controlled at 10 nm (Figure S1) using OA as the capping agent; OA also serves as a solvent in the reaction. Then, the crystalline layer composed of NaGdF4:Yb3+,Er3+ was grown around the seed NPs. The resultant NaGdF4:Yb3+,Er3+ NPs were modified with PEG-b-PAAc in DMF. Finally, the obtained PEG-NaGdF4:Yb3+,Er3+ NPs were characterized, and their properties as OTN-NIR/MRI bimodal nanoprobes were evaluated.
Figure 1. (a) Schematic illustration of the size-controlled synthesis of NaGdF4:Yb3+,Er3+ NPs by the stepwise crystal growth. (b) Particle size distribution of PEGylated and OA-capped NaGdF4:Yb3+,Er3+ NPs (DLS measurement conditions: sample concentration of 17.6 and 1.0 mg/mL, respectively, in distilled water and cyclohexane). TEM images of (c) 15 nm (NP#1) and (d) 45 nm (NP#2) PEG-NaGdF4:Yb3+,Er3+ NPs
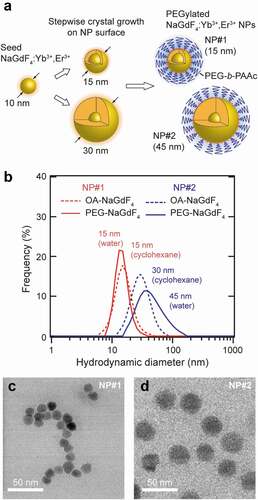
The sizes of the NaGdF4:Yb3+,Er3+ NPs (Yb3+:Er3+ = 20:2 mol%) prepared using 80 and 40 mg of the 10 nm NaGdF4:Yb3+,Er3+ NPs (referred to as NP#1 and NP#2, respectively) were determined by DLS in cyclohexane. Both these samples have a unimodal size distribution with a diameter of 15 ± 5 and 30 ± 20 nm, respectively (). Subsequent measurements with NP#1 modified with PEG-b-PAAc in water yielded a similar size as that of the original sample (). The Fourier-transform infrared spectra of the PEG-b-PAAc-modified CNPs exhibit peaks at 1116, 1730, and 2895 cm−1 corresponding to the C–O–C bond of PEG, –COOH group of PAAc, and C–H bonds of PEG and PAAc, respectively, indicating the successful PEGylation of the CNPs (Figure S2). Remarkably, the specific gravity of the CNPs, 5.612 g/cm3 for hexagonal NaGdF4 nanocrystals [Citation58], is substantially higher than that of the flanking PEG chains. Therefore, it is likely that the diffusion behavior of the PEGylated CNPs, which is an essential feature for the DLS measurement, is mostly dominated by the CNPs themselves. In addition, PEG has a negligible impact on the size determination, leading to the same size of the NP determined by DLS even with the attachment of PEG. In contrast, NP#2 showed a size increase (45 ± 20 nm) and widening of the size distribution after its PEGylation (). We assume that the increased size is due to the aggregation of a few CNPs during the PEGylation process. The 1.5-time larger DLS size allowed the estimation of an aggregation number of 3.4, because the third power of 1.5 corresponds to 3.4. The TEM images of PEGylated NP#1 and NP#2 confirm the formation of particles with average sizes of 14 ± 1 and 28 ± 2 nm, respectively (n = 30) (). These sizes are consistent with the sizes determined by DLS. Note that only CNPs are visualized in the TEM images, whereas PEG is invisible due to its considerably lower electron density.
Table 1. Comparison of the longitudinal relaxivity (r1), transverse relaxivity (r2), and r1/r2 ratio of NaGdF4-based NPs. Note: PEG-b-PAAc, poly(ethylene glycol) poly(acrylic acid) block copolymer; PVP, polyvinylpyrrolidone; DSPE-PEG, 2-distearoyl-sn-glycero-3-phosphoethanolamine-N- [methoxy(polyethyleneglycol)-2000]
To examine the precise size-controllability of the NaGdF4:Yb3+,Er3+ NPs obtained by the stepwise crystal growth, the amount of the seed NPs added for the subsequent crystal growth was varied in the range of 20–100 mg. The DLS analysis indicated that the size of the synthesized NPs increased with a decrease in the amount of the added NPs (). The crystallite size can be estimated from the XRD pattern based on Scherrer’s equation, which correlates the size of the submicron crystallites to the full-width at half-maximum of the XRD peak. Note that the powder XRD studies revealed that the NaGdF4:Yb3+,Er3+ NPs were formed in the hexagonal β-phase of NaGdF4, and all the peaks corresponded with the JCPDS data for this phase (27–0699) (). The calculated crystallite size increased with a decrease in the amount of the added seed NPs, conforming with the hydrodynamic sizes measured by DLS (). Notably, the XRD peaks were broadened for CNPs prepared with a lesser amount of the added seed NPs, which may be attributed to the formation of some smaller crystallites. These evaluations suggest that the stepwise crystal growth method allowed the precise size-control of the NaGdF4:Yb3+,Er3+ NPs in the range of 10–30 nm.
Figure 2. Particle size control based on the amount of seed NaGdF4:Yb3+,Er3+ NPs used in the reaction. (a) Particle size distribution of OA-NaGdF4:Yb3+,Er3+ NPs obtained with different amounts of seed NPs (20–100 mg), as determined by DLS (particle concentration: 1.0 mg/mL in cyclohexane). (b) XRD patterns of OA-NaGdF4:Yb3+,Er3+ NPs along with that of the reference sample, hexagonal β-NaGdF4. (c) Dependence of the particle size of NaGdF4:Yb3+,Er3+ NPs on the amount of added seed NPs. Crystallite sizes and hydrodynamic sizes were measured by XRD and DLS, respectively. (d) Cytotoxicity of the PEG-NaGdF4:Yb3+,Er3+ NPs (NP#1) against NIH3T3 cells, as determined by the MMT assay. NIH3T3 cells were exposed to different PEG-NaGdF4:Yb3+,Er3+ NPs with different Gd3+ concentrations (0.01, 0.1, 1, and 10 mM) for 6, 12, 18, and 24 h. Data are expressed as mean ± standard deviation (n = 5 for each sample). (e) Colloidal stability of 15 nm PEG-NaGdF4:Yb3+,Er3+ NPs in saline and deionized water, as evaluated by their absorbance at 550 nm
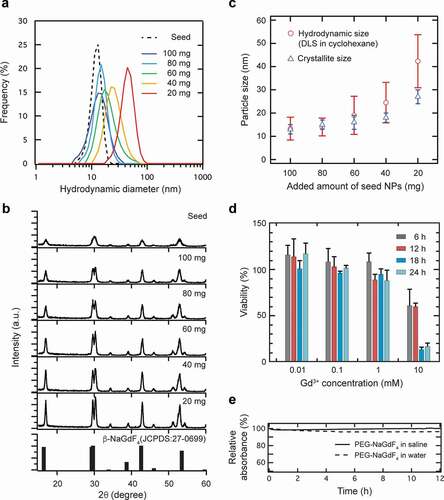
Low cytotoxicity is an essential requirement for probes used in diagnostic applications. The viability of NIH3T3 cells was investigated in vitro using the standard MTT assay after 6, 12, 18, and 24 h of incubation of NP#1. None of the PEG-NaGdF4:Yb3+,Er3+ NPs showed apparent cytotoxicity in the range of 0.01–1 mM Gd3+ concentration (). In contrast, a significant decrease in the cell viability was observed at 10 mM Gd3+ concentration. Therefore, we conclude that the PEG-NaGdF4:Yb3+,Er3+ NPs have minimal toxicity at concentrations lower than 1 mM.
As nanoprobes that simultaneously facilitate MRI contrast and fluorescence imaging in vivo, NPs developed for imaging should be stable while they circulate in the bloodstream. We evaluated the colloidal stability of the PEG-NaGdF4:Yb3+,Er3+ NPs in physiological saline and pure water by monitoring their absorbance at 550 nm. The near-constant absorbance of NP#1, that is, 15 nm PEG-NaGdF4:Yb3+,Er3+ NPs, over 12 h indicated their high colloidal stability without detectable precipitation ().
3.2. In vitro relaxivity measurement of PEG-NaGdF4:Yb3+,Er3+ NPs
The performance of the PEG-NaGdF4:Yb3+,Er3+ NPs as MRI contrast agents was evaluated using a preclinical 1.0 T MRI scanner at room temperature (23°C). The experimentally determined longitudinal and transverse relaxation rates (1/T1 and 1/T2) of water protons are plotted against the molar concentration of Gd3+, along with the results of Gd-DOTA used as a reference. show the T1-weighted and T2-weighted images obtained with different concentrations of NP#1, NP#2, and Gd-DOTA. Both NP#1 and NP#2 show higher T1 and T2 contrast enhancement than that of Gd-DOTA (). Whereas the r1 value of Gd-DOTA is 3.44 mM−1 s−1, the r1 value of NP#1 increased nearly four times to 14.46 mM−1 s−1 and that of NP#2 increased nearly six times to 19.78 mM−1 s−1.
Figure 3. MR enhancement effects of 15 and 45 nm PEG-NaGdF4:Yb3+,Er3+ NPs. (a) T1-weighted and (b) T2-weighted MR images of the PEG-NaGdF4:Yb3+,Er3+ NP solution at the magnetic field strength of 1 T. (c, d) T1 and T2 relaxation rates of PEG-NaGdF4:Yb3+,Er3+ NPs determined with a 1.0 T-MRI scanner. T1 and T2 relaxation rates of Gd-DOTA, which was used as a reference, are also displayed in Figure 3(c,d)
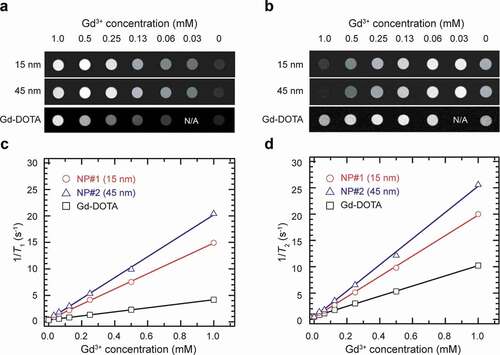
The intrinsic ability of ‘positive’ T1 contrast agents to enhance an MR signal is dominated by the ratio of their longitudinal relaxivity (r1) to transverse relaxivity (r2), that is, the r1/r2 ratio. A high r1 with a low r2 provides high signal enhancement in the T1-weighted image, and thus a high r1/r2 ratio is considered to be ideal. For NaGdF4 NP-based probes, most of the previous reports only presented the r1 and omitted the r2, despite its major impact on their performance as a ‘positive’ contrast agent. The r1 values of the NP#1 and NP#2 are significantly higher than those reported for NaGdF4-based probes [Citation52,Citation53,Citation59–64], as summarized in . Most importantly, the r1/r2 values of both NP#1 (0.744) and NP#2 (0.794) are higher than those of others, including Gd-DOTA, indicating that both NPs can be assumed to have suitable ‘positive’ contrast properties. The relaxivity is affected by multiple factors, including the difference in the applied magnetic field, accessibility of water to the particle surface, location of paramagnetic ions in the NP, and NP size. Among them, NP size is one of the important factors to be considered in the design of MRI–NIR bimodal probes. The contribution of the particle size to r1 varies with the size range of NPs. It has been reported that small particles (<10 nm in size) show high r1 owing to the high ratio of the surface-to-core ions [Citation59,Citation60], while Gd3+ at the surface of larger particles (>10 nm diameter) makes a larger contribution to r1/r2 than the surface Gd3+ on ultrasmall particles (3 nm diameter) [Citation65]. However, the high r1/r2 ratios of NP#1 and NP#2 are due to lesser changes in r2 with an increase in the particle size. In the case of ferromagnetic contrast agents, such as iron oxides (e.g. Fe2O3), larger NPs show noticeably higher r2 values [Citation66], because of which they show negative contrast enhancement. Paramagnetic NaGdF4 NPs, however, show relatively constant r2 values, regardless of the NP size. Thus, the NPs prepared in this work retain their ability to show positive contrast enhancement at larger particle sizes. This feature is favorable when large MRI–NIR bimodal probes are required. Notably, the fluorescence intensity of the RED-CNPs decreases remarkably with a decrease in the NP size [Citation67]. Therefore, it is necessary to explore the optimum particle size for balancing the ability of the NP to facilitate effective T1-weighted contrast and fluorescence imaging at the same time.
3.3. In vivo MRI of a mouse body using PEG-NaGdF4:Yb3+,Er3+ NPs
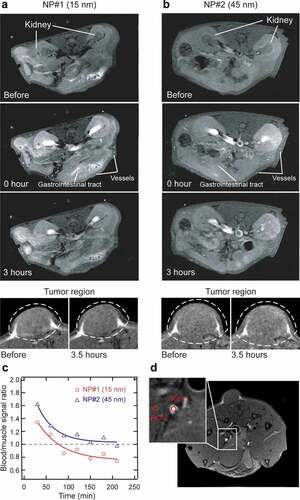
The suspensions of 15 and 45 nm PEG-NaGdF4 NPs (NP#1 and NP#2, respectively) in saline water were used for in vivo MRI. show the T1-weighted images of the transaxial slice of the mouse body (upper) and the region around the tumor site (bottom) obtained before and immediately after the administration of NP#1 and NP#2 into the tumor-bearing mouse and after 3.5 h following the NP injection, as obtained with a 1.0 T MRI scanner. Compared with the images obtained before the NP injection, the images of the renal pelvis, renal cortex, pancreas, blood vessels, and gastrointestinal tract are clearly enhanced after the administration of both NP#1 and NP#2. Horizontal slices that feature the pancreas are shown in Figure S3. The signal enhancement due to the accumulation of the NPs on the surface of the tumor is not clearly observed after 3.5 h of the NP administration because the NPs are not designed for tumor targeting. The visualization of the blood vessels was enhanced significantly both by NP#1 and NP#2, and the visualization was better with NP#2 than with NP#1 because initial blood-to-muscle contrast ratio of NP#2 was 20% higher than that of NP#1 (). The blood-to-muscle contrast ratio was normalized with the blood signal obtained immediately after the injection, and ROI used for blood and muscle signals are displayed in . Both NP#1 and NP#2 showed a similar half-life in blood (approximately 60–120 min). Nevertheless, NP#2 facilitated a relatively better blood vessel enhancement than NP#1 did, possibly due to its passive accumulation in the tumor region through the enhanced permeability and retention effect owing to endothelial leakages in the tumor neovascularization and the reduced lymphatic circulation in the tumor microenvironment [Citation68]. In terms of safety, a long blood half-life of the NPs is potentially risky owing to the possibility of the permanent accumulation of Gd3+ and systemic toxicity, which can cause conditions, such as fibrosis. Therefore, the relatively rapid clearance of the PEG-NaGdF4:Yb3+,Er3+ NPs is beneficial for ensuring safety in future clinical applications.
Figure 4. In vivo MRI results of Colon-26 subcutaneous tumor-bearing Balb/c nude mice following the tail-vein injection of PEGylated NaGdF4:Yb3+,Er3+ NPs as contrast agents. Representative transaxial slice of the T1-weighted images of the Balb/c nude mouse body (upper) and around the tumor site (bottom) contrasted by (a) 15 nm PEG-NaGdF4:Yb3+,Er3+ NPs and (b) 45 nm PEG-NaGdF4:Yb3+,Er3+ NPs. The kidney, blood vessels, and gastrointestinal tract are indicated by white arrows. (c) Blood-to-muscle contrast ratio at each time point, up to 210 min after the NP injection. (d) Transverse MR image of the tumor-bearing mouse used for calculating the blood-to-muscle contrast ratio. Regions of interest (ROI) for the blood and muscle are indicated by red circles as ROI 1 and ROI 2, respectively
3.4. In vivo OTN-NIR fluorescence imaging of mouse blood vessels
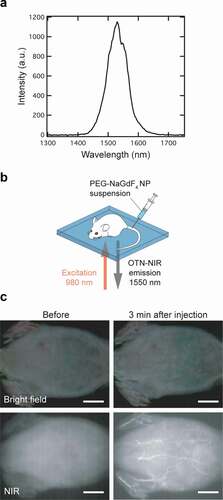
NaGdF4:Yb3+,Er3+ NPs show strong NIR emission, providing a high signal-to-noise ratio and deeper penetration of biological tissues. The 15 nm PEG-NaGdF4:Yb3+,Er3+ NPs (NP#1) exhibited a distinct NIR emission under 980 nm excitation (see ). To investigate the applicability of the NPs in the OTN-NIR bioimaging, we performed in vivo OTN-NIR fluorescence imaging of live mice after the intravenous injection of the NP#1 suspension (containing 10 µmol of Gd3+); the NPs were dispersed in physiological saline before injection. The PEG-NaGdF4:Yb3+,Er3+ NPs were excited with a 980 nm laser diode (power density: 0.5 W/cm2; exposure time: 500 ms) and imaged using an NIR fluorescence imager (SAI-1000); the abdominal images of the live mouse were acquired, as schematically shown in . shows the OTN-NIR fluorescence images of the live ICR mouse before and 3 min after the injection of NP#1 via the tail vein under NIR excitation, along with the images acquired under bright-field illumination as references. Compared with the image obtained before injection, the blood vessels located in the abdominal muscle were observed more vividly after the injection of the PEG-NaGdF4:Yb3+,Er3+ NPs, demonstrating the potential of these NPs as OTN-NIR probes. These preliminary results demonstrate the feasibility of the practical application of our size-controlled NPs for visualizing the blood vessels through MRI and NIR fluorescence imaging.
Figure 5. NIR fluorescence imaging of a live mouse. (a) OTN-NIR down-conversion fluorescence spectrum of PEG-NaGdF4:Yb3+,Er3+ NPs (Spectral acquisition conditions: dispersion medium, distilled water; excitation wavelength, 980 nm; power, 0.5 mW/cm2). (b) Illustration of the NIR fluorescence imaging of a live mouse under 980 nm excitation (0.5 W/cm2) using an SAI-1000 imaging system. (c) NIR fluorescence images (lower) and images under bright-field illumination (upper) of a live mouse before (left) and after 3 min (right) of the administration of NP#1. Scale bars represent 10 mm
4. Conclusions
We demonstrated bimodal imaging contrast agents based on monodisperse β-NaGdF4:Yb3+,Er3+ NPs that are applicable to OTN-NIR fluorescence imaging and T1-weighted MRI. The size of the PEG-NaGdF4:Yb3+,Er3+ NPs was precisely controlled using a stepwise crystal growth method that allows the facile tuning of the thickness of the RED-crystalline layer, and NPs with hydrodynamic diameters of 15 and 45 nm were obtained. This was realized by controlling the number density of the seed NPs added to the reaction mixture. MRI T1 and T2 relaxivity measurements on the PEG-NaGdF4Yb3+,Er3+ NPs revealed a higher r1 than that of the clinical standard, Gd-DOTA, and the highest r1/r2 ratio, which defines the ability of ‘positive’ T1 contrast agents to enhance image contrast, was reported for NaGdF4-based NPs. The cell viability test confirmed that the NPs have low toxicity to NIH3T3 cells at <1 mM Gd3+ concentration. In vivo imaging of the blood vessels of live mice was achieved both by OTN-NIR fluorescence imaging and by MRI with the intravenous administration of the PEG-NaGdF4:Yb3+,Er3+ NPs. A short half-life of the NPs in the blood can ensure safety when applied clinically. For developing OTN-NIR/MRI bimodal contrast agents in such a size range, a precise synthesis for controlling their size is critical in terms of realizing their optimal performance as an MRI contrast agent as well as a fluorescence probe and for regulating their function in the body.
Supplemental Material
Download MS Word (1.1 MB)Acknowledgments
We are grateful to Dr. Nobuhiro Nitta, Dr. Yoshikazu Ozawa, and Dr. Sayaka Shibata from QST for technical support, Dr. Takuji Ube and Dr. Karina Nigoghossian from the Tokyo University of Science for TEM observations and the preparation of samples, and Dr. Daisuke Kokuryo from the Kobe University and Dr. Takayuki Otani from the Katayama Chemical Industries Co., Ltd. for initiating this study.
Disclosure statement
The authors declare no competing financial interests.
Supplemental data
Supplemental data for this article can be accessed here.
Additional information
Funding
References
- Weissleder R, Pittet MJ. Imaging in the era of molecular oncology. Nature. 2008;452:580–589.
- Jokerst JV, Gambhir SS. Molecular imaging with theranostic nanoparticles. Acc Chem Res. 2011;44:1050–1060.
- Kim C, Favazza C, Wang LV. In vivo photoacoustic tomography of chemicals: high-resolution functional and molecular optical imaging at new depths. Chem Rev. 2010;110:2756–2782.
- Mariani G, Bruselli L, Kuwert T, et al. A review on the clinical uses of SPECT/CT. Eur J Nucl Med Mol Imaging. 2010;37:1959–1985.
- Wadas TJ, Wong EH, Weisman GR, et al. Coordinating radiometals of copper, gallium, indium, yttrium, and zirconium for pet and SPECT imaging of disease. Chem Rev. 2010;110:2858–2902.
- Mahmoudi M, Hosseinkhani H, Hosseinkhani M, et al. Magnetic resonance imaging tracking of stem cells in vivo using iron oxide nanoparticles as a tool for the advancement of clinical regenerative medicine. Chem Rev. 2011;111:253–280.
- Hellebust A, Richards-Kortum R. Advances in molecular imaging: targeted optical contrast agents for cancer diagnostics. Nanomedicine. 2012;7:429–445.
- Loving GS, Mukherjee S, Caravan P. Redox-activated manganese-based MR contrast agent. J Am Chem Soc. 2013;135:4620–4623.
- Na HB, Hyeon T. Nanostructured T1 MRI contrast agents. J Mater Chem. 2009;19:6267–6273.
- Choi HS, Gibbs SL, Lee JH, et al. Targeted zwitterionic near-infrared fluorophores for improved optical imaging. Nat Biotechnol. 2013;31:148–153.
- Miao Q, Pu K. Organic semiconducting agents for deep-tissue molecular imaging: second near-infrared fluorescence, self-luminescence, and photoacoustics. Adv Mater. 2018;30:e1801778.
- Hemmer E, Benayas A, Légaré F, et al. Exploiting the biological windows: current perspectives on fluorescent bioprobes emitting above 1000 nm. Nanoscale Horiz. 2016;1:168–184.
- Zhu S, Tian R, Antaris AL, et al. Near-infrared-II molecular dyes for cancer imaging and surgery. Adv Mater. 2019;31:1900321.
- Hong G, Antaris AL, Dai H. Near-infrared fluorophores for biomedical imaging. Nat Biomed Eng. 2017;1:0010.
- Sekiyama S, Umezawa M, Iizumi Y, et al. Delayed increase in near-infrared fluorescence in cultured murine cancer cells labeled with oxygen-doped single-walled carbon nanotubes. Langmuir. 2019;35:831–837.
- Naczynski DJ, Tan MC, Zevon M, et al. Rare-earth-doped biological composites as in vivo shortwave infrared reporters. Nat Commun. 2013;4:2199.
- Kamimura M, Takahiro S, Yoshida M, et al. Over-1000 nm near-infrared fluorescent biodegradable polymer nanoparticles for deep tissue in vivo imaging in the second biological window. Polym J. 2017;49:799.
- Smith AM, Mancini MC, Nie S. Second window for in vivo imaging. Nat Nanotechnol. 2009;4:710–711.
- Heller DA, Baik S, Eurell TE, et al. Single-walled carbon nanotube spectroscopy in live cells: towards long-term labels and optical sensors. Adv Mater. 2005;17:2793–2799.
- Diao S, Blackburn JL, Hong G, et al. Fluorescence imaging in vivo at wavelengths beyond 1500 nm. Angew Chem Int Ed Engl. 2015;54:14758–14762.
- Welsher K, Liu Z, Sherlock SP, et al. A route to brightly fluorescent carbon nanotubes for near-infrared imaging in mice. Nat Nanotechnol. 2009;4:773–780.
- Iizumi Y, Yudasaka M, Kim J, et al. Oxygen-doped carbon nanotubes for near-infrared fluorescent labels and imaging probes. Sci Rep. 2018;8:6272.
- Hong G, Robinson JT, Zhang Y, et al. In vivo fluorescence imaging with Ag2S quantum dots in the second near-infrared region. Angew Chem Int Ed. 2012;51:9818–9821.
- Lu H, Carroll GM, Neale NR, et al. Infrared quantum dots: progress, challenges, and opportunities. ACS Nano. 2019;13:939–953.
- Kamimura M, Kanayama N, Tokuzen K, et al. Near-infrared (1550 nm) in vivo bioimaging based on rare-earth doped ceramic nanophosphors modified with PEG-b-poly(4-vinylbenzylphosphonate). Nanoscale. 2011;3:3705–3713.
- Kamimura M, Matsumoto T, Suyari S, et al. Ratiometric near-infrared fluorescence nanothermometry in the OTN-NIR (NIR II/III) biological window based on rare-earth doped β-NaYF4 nanoparticles. J Mater Chem B. 2017;5:1917–1925.
- Zheng W, Zhou S, Xu J, et al. Ultrasensitive luminescent in vitro detection for tumor markers based on inorganic lanthanide nano-bioprobes. Adv Sci. 2016;3:1600197.
- Ortgies DH, Tan M, Ximendes EC, et al. Lifetime-encoded infrared-emitting nanoparticles for in vivo multiplexed imaging. ACS Nano. 2018;12:4362–4368.
- Hemmer E, Venkatachalam N, Hyodo H, et al. Upconverting and NIR emitting rare earth based nanostructures for NIR-bioimaging. Nanoscale. 2013;5:11339–11361.
- Wang R, Li X, Zhou L, et al. Epitaxial seeded growth of rare-earth nanocrystals with efficient 800 nm near-infrared to 1525 nm short-wavelength infrared downconversion photoluminescence for in vivo bioimaging. Angew Chem Int Ed Engl. 2014;53:12086–12090.
- Jaque D, Richard C, Viana B, et al. Inorganic nanoparticles for optical bioimaging. Adv Opt Photon. 2016;8:1–103.
- Cortelletti P, Skripka A, Facciotti C, et al. Tuning the sensitivity of lanthanide-activated NIR nanothermometers in the biological windows. Nanoscale. 2018;10:2568–2576.
- Sekiyama S, Umezawa M, Kuraoka S, et al. Temperature sensing of deep abdominal region in mice by using over-1000 nm near-infrared luminescence of rare-earth-doped NaYF4 nanothermometer. Sci Rep. 2018;8:16979.
- Xu F, Ba Z, Zheng Y, et al. Rare-earth-doped optical nanothermometer in visible and near-infrared regions. J Mater Sci. 2018;53:15107–15117.
- Zhang P, Steelant W, Kumar M, et al. Versatile photosensitizers for photodynamic therapy at infrared excitation. J Am Chem Soc. 2007;129:4526–4527.
- Wang C, Tao H, Cheng L, et al. Near-infrared light induced in vivo photodynamic therapy of cancer based on upconversion nanoparticles. Biomaterials. 2011;32:6145–6154.
- Liang L, Care A, Zhang R, et al. Facile assembly of functional upconversion nanoparticles for targeted cancer imaging and photodynamic therapy. ACS Appl Mater Inter. 2016;8:11945–11953.
- Tsai Y-C, Vijayaraghavan P, Chiang W-H, et al. Targeted delivery of functionalized upconversion nanoparticles for externally triggered photothermal/photodynamic therapies of brain glioblastoma. Theranostics. 2018;8:1435–1448.
- Liu C, Gao Z, Zeng J, et al. Magnetic/upconversion fluorescent NaGdF4: yb,ernanoparticle-based dual-modal molecular probes for imaging tiny tumors in vivo. ACS Nano. 2013;7:7227–7240.
- Liu F, He X, Liu L, et al. Conjugation of NaGdF4 upconverting nanoparticles on silica nanospheres as contrast agents for multi-modality imaging. Biomaterials. 2013;34:5218–5225.
- Liu Y, Kang N, Lv J, et al. Deep photoacoustic/luminescence/magnetic resonance multimodal imaging in living subjects using high-efficiency upconversion nanocomposites. Adv Mater. 2016;28:6411–6419.
- Ma L, Liu Y, Liu L, et al. Simultaneous activation of short-wave infrared (SWIR) light and paramagnetism by a functionalized shell for high penetration and spatial resolution theranostics. Adv Funct Mater. 2018;28:1705057.
- Wang P, Wang C, Lu L, et al. Kinetics-mediate fabrication of multi-model bioimaging lanthanide nanoplates with controllable surface roughness for blood brain barrier transportation. Biomaterials. 2017;141:223–232.
- Li Y, Li D, Jian K, et al. A synergistically enhanced T1 and T2-weighted magnetic resonance/near-infrared contrast agent of Gd-doping Fe3O4@Fluorescence PEGylated nanoparticles for multimodality imaging of hepatocarcinoma. J Biomed Nanotechnol. 2019;15:85–99.
- Tan YF, Chandrasekharan P, Maity D, et al. Multimodal tumor imaging by iron oxides and quantum dots formulated in poly (lactic acid)-d-alpha-tocopheryl polyethylene glycol 1000 succinate nanoparticles. Biomaterials. 2011;32:2969–2978.
- Wang F, Deng R, Liu X. Preparation of core-shell NaGdF4 nanoparticles doped with luminescent lanthanide ions to be used as upconversion-based probes. Nat Protoc. 2014;9:1634–1644.
- Fischer S, Swabeck JK, Alivisatos AP. Controlled isotropic and anisotropic shell growth in β-NaLnF4 nanocrystals induced by precursor injection rate. J Am Chem Soc. 2017;139:12325–12332.
- Johnson NJJ, Van Veggel FCJM. Lanthanide-based heteroepitaxial core–shell nanostructures: compressive versus tensile strain asymmetry. ACS Nano. 2014;8:10517–10527.
- Wang Y, Liu K, Liu X, et al. Critical shell thickness of core/shell upconversion luminescence nanoplatform for fret application. J Phys Chem Lett. 2011;2:2083–2088.
- Xu X, Zhou Z, Liu Y, et al. Optimising passivation shell thickness of single upconversion nanoparticles using a time-resolved spectrometer. APL Photonics. 2019;4:026104.
- Liu J-N, Bu W, Pan L-M, et al. Simultaneous nuclear imaging and intranuclear drug delivery by nuclear-targeted multifunctional upconversion nanoprobes. Biomaterials. 2012;33:7282–7290.
- Ren Y, He S, Huttad L, et al. An NIR-II/MR dual modal nanoprobe for liver cancer imaging. Nanoscale. 2020;12:11510–11517.
- Ren F, Ding L, Liu H, et al. Ultra-small nanocluster mediated synthesis of nd(3+)-doped core-shell nanocrystals with emission in the second near-infrared window for multimodal imaging of tumor vasculature. Biomaterials. 2018;175:30–43.
- Hemmer E, Quintanilla M, Légaré F, et al. Temperature-induced energy transfer in dye-conjugated upconverting nanoparticles: a new candidate for nanothermometry. Chem Mater. 2015;27:235–244.
- Skripka A, Marin R, Benayas A, et al. Covering the optical spectrum through collective rare-earth doping of NaGdF4 nanoparticles: 806 and 980 nm excitation routes. Phys Chem Chem Phys. 2017;19:11825–11834.
- Dong A, Ye X, Chen J, et al. A generalized ligand-exchange strategy enabling sequential surface functionalization of colloidal nanocrystals. J Am Chem Soc. 2011;133:998–1006.
- Kamimura M, Suyari S, Matsumoto T, et al. Surface modification on rare-earth doped ceramic nanophosphors via ligand exchange method for near-infrared biophotonics. J Photopoly Sci Technol. 2015;28:711–713.
- Aebischer A, Hostettler M, Hauser J, et al. Structural and spectroscopic characterization of active sites in a family of light-emitting sodium lanthanide tetrafluorides. Angew Chem Int Ed. 2006;45:2802–2806.
- Johnson NJJ, Oakden W, Stanisz GJ, et al. Size-tunable, ultrasmall NaGdF4 nanoparticles: insights into their T1 MRI contrast enhancement. Chem Mater. 2011;23:3714–3722.
- Liu N, Marin R, Mazouzi Y, et al. Cubic versus hexagonal - effect of host crystallinity on the T1 shortening behaviour of NaGdF4 nanoparticles. Nanoscale. 2019;11:6794–6801.
- Naccache R, Chevallier P, Lagueux J, et al. High relaxivities and strong vascular signal enhancement for NaGdF4 nanoparticles designed for dual MR/optical imaging. Adv Healthcare Mater. 2013;2:1478–1488.
- Xing H, Zhang S, Bu W, et al. Ultrasmall NaGdF4 nanodots for efficient MR angiography and atherosclerotic plaque imaging. Adv Mater. 2014;26:3867–3872.
- Jin X, Fang F, Liu J, et al. An ultrasmall and metabolizable PEGylated NaGdF4: dynanoprobe for high-performance T1/T2-weighted MR and CT multimodal imaging. Nanoscale. 2015;7:15680–15688.
- Ryu J, Park H-Y, Kim K, et al. Facile synthesis of ultrasmall and hexagonal NaGdF4: yb3+, Er3+ nanoparticles with magnetic and upconversion imaging properties. J Phys Chem C. 2010;114:21077–21082.
- Dash A, Blasiak B, Tomanek B, et al. Validation of inner, second, and outer sphere contributions to T1 and T2 relaxation in Gd3+-based nanoparticles using eu3+ lifetime decay as a probe. J Phys Chem C. 2018;122:11557–11569.
- Bao Y, Sherwood JA, Sun Z. Magnetic iron oxide nanoparticles as T1 contrast agents for magnetic resonance imaging. J Mater Chem C. 2018;6:1280–1290.
- Zhao X, He S, Tan MC. Design of infrared-emitting rare earth doped nanoparticles and nanostructured composites. J Mater Chem C. 2016;4:8349–8372.
- Matsumura Y, Maeda H. A new concept for macromolecular therapeutics in cancer chemotherapy: mechanism of tumoritropic accumulation of proteins and the antitumor agent smancs. Cancer Res. 1986;46:6387.