
 ?Mathematical formulae have been encoded as MathML and are displayed in this HTML version using MathJax in order to improve their display. Uncheck the box to turn MathJax off. This feature requires Javascript. Click on a formula to zoom.
ABSTRACT
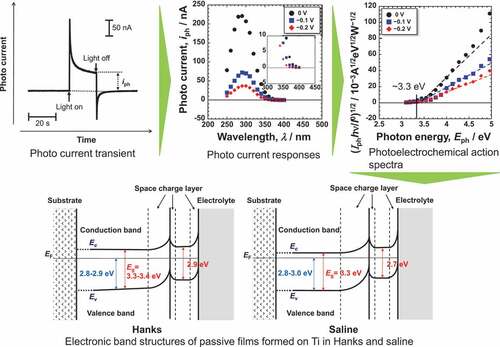
The band structures and band gap energies, Eg, of passive films formed on titanium (Ti) in simulated bioliquids, Hanks’ solution (Hanks) and saline, were evaluated. Ti was polarized at 0, −0.1, and −0.2 VAg/AgCl, Ef, for 1 h. After polarization, the surfaces were characterized using X-ray photoelectron spectroscopy, and the photoelectrochemical responses were evaluated. The current change during photoirradiation was recorded as a photocurrent transient at each measuring potential, Em, and by changing the wavelength of the incident light. Passive films consisted of a very thin TiO2 layer containing small amounts of Ti2O3 and TiO, hydroxyl groups, and water. During polarization in Hanks, calcium and phosphate ions were incorporated or formed calcium phosphate but not in saline. Calcium phosphate and hydroxyl groups influenced the band structure. Eg was graded in Hanks but constant in saline, independent of Ef and Em. The passive film on Ti behaved as an n-type semiconductor containing two layers: an inner oxide layer with a large Eg and an outer hydroxide layer with a small Eg. In Hanks, Eg was 3.3–3.4 eV in the inner oxide layer and 2.9 eV in the outer hydroxide layer. In saline, Eg was 3.3 eV in the inner layer and 2.7 eV in the outer layer. Calcium phosphate and hydroxyl groups influenced the band structure of the passive film. The Eg of the outermost surface was smaller than that of TiO2 ceramics, which is probably one of the principles of the excellent biocompatibility of Ti among metals.
Graphical abstract
1. Introduction
Titanium (Ti) and its alloys are widely used as implant devices in medicine and dentistry because of their excellent corrosion resistance and high specific strength [Citation1]. Their good tissue compatibility is well established through significant evidence from basic research and high clinical performance. For example, in orthopedics, bone screws and bone nails consisting of Ti alloys usually form calluses and assimilate into bone tissue after long-term implantation, inducing refracture of the bone during retrieval [Citation2]. This is because of the good compatibility of Ti alloys with hard tissues. Many studies on the hard-tissue compatibility of Ti have been performed, and detailed information can be found in the literature [Citation1,Citation3]. The initial reaction at the interface directly influences the biocompatibility of the material. Therefore, biocompatibility is governed by the surface properties of the material. However, the principle and mechanism of the good tissue compatibility of Ti among metals have not been completely elucidated, despite numerous studies conducted on biological reactions.
The Ti metal surface is covered by a passive oxide film, which contributes to its excellent corrosion resistance. The passive film on Ti is mainly an extremely thin amorphous TiO2 containing small amounts of Ti2O3 and TiO, along with water and hydroxyl groups [Citation4–7]. In addition, as the composition is graded, more Ti4+ and OH− ions appear near the surface of the film [Citation6]. This passive film formation process has been discussed elsewhere [Citation8], and the chemical state of the passive oxide film has also been precisely investigated [Citation9]. It has been established that the composition, structure, and chemical state of the passive film are different from those of the crystalline TiO2 ceramics. For example, the adsorption kinetics of calcium and phosphate ions in passive films on Ti differ from those in TiO2 ceramics [Citation10].
In this regard, the band gap energy, Eg, between the valence and conduction bands of TiO2 crystalline ceramics is usually evaluated by the optical absorption edge. It is well known that the reactivity of TiO2 ceramics is governed by Eg, and continuous efforts to decrease Eg have been made to activate their photocatalytic performance [Citation11]. The Eg of a photocatalyst decreases as its optical response shifts to longer excitation wavelengths. From this viewpoint, the passive film on Ti already contains oxygen defects because of its nonstoichiometric composition. Therefore, the difference in the surface properties of the passive films on Ti and TiO2 ceramics is probably due to the difference in their Egs. The Eg of passive films on Ti after anodic oxidation and thermal oxidation has been investigated by the photoelectrochemical response in borate buffer solution, artificial seawater, and sulfuric acid [Citation12–14] because the conventional techniques employed for oxide ceramics, such as ultraviolet absorption, cannot be used for thin passive films on Ti.
In this study, the Eg values of passive films formed on Ti in simulated bioliquids, Hanks’ solution and 0.9% NaCl aqueous solution, were evaluated using the photoelectrochemical response at potentials as close as possible to the open circuit potential (OCP). In addition, X-ray photoelectron spectroscopy (XPS) was performed to understand the effect of the chemical composition and chemical state of the passive films on the photoelectrochemical properties. This research will enhance our understanding of the properties of passive films on Ti in the human body.
2. Experimental procedure
2.1 Specimen
Commercially or industrially pure titanium (ISO grade 2; >99.5% Ti; Test Materials, Tokyo, Japan) rods (8 mm in diameter) were cut into disks (1.5 mm in thickness). In the case of OCP measurement and XPS, the disks were polished with SiC paper, followed by mirror finishing with a 0.04 μm SiO2 suspension. After polishing, the Ti disks were ultrasonically cleaned twice in acetone and once in isopropanol for 10 min each. The Ti disks were immersed in ultrapure water for 24 h to stabilize the passive films. The disks were then fixed in a polytetrafluoroethylene holder with an o-ring, exposing an area of 0.278 cm2 to the electrolyte. For photoelectrochemical measurements, Ti was connected to a lead wire by soldering. The disks and connected parts were embedded in epoxy resin, and the surface was polished with SiC paper, followed by mirror finishing with a 0.25 µm diamond suspension. After polishing, the specimens were ultrasonically cleaned sequentially in acetone, ethanol, and deionized water for 10 min each and immediately used for subsequent experiments.
2.2 Electrolytes
Hanks’ solution without glucose (Hanks) was prepared using reagent-grade chemicals in ultrapure water. The composition of the Hanks was similar to that of extracellular fluid which is as follows: Na+ 142, K+ 5.81, Mg2+ = 0.811, Ca2+ = 1.26, Cl– = 145, PO43– = 0.778, SO42– = 0.811, and CO32– = 4.17 (mmol/L). The pH of Hanks was 7.4 after preparation and did not change during the experimental acquisition at 37ºC. A 0.9 mass% NaCl solution (saline) was also prepared for comparison. The pH of saline is 6.4 just after preparation at 37ºC.
2.3 Open circuit potential change with time
The changes in OCP with time in Hanks and saline were measured using a Pt counter electrode and an Ag/AgCl reference electrode. The OCP was measured after 72 h of immersing the specimens in the electrolyte.
2.4 Photoelectrochemical response
The specimens were immersed in Hanks and saline for 10 min. The specimens were then polarized at film formation potentials, Ef, of −0.2, −0.1, and 0 V versus Ag/AgCl electrode in Hanks and saline for 1 h to form stable passive films. These potentials were determined according to the change in the OCP for 72 h. The potentials were as close as possible to the OCP. The pH of the saline after polarization was 5.3–5.8.
The photoelectrochemical response of the passive films was investigated using an experimental equipment similar to that used in a previous study [Citation15–18]. The photoelectrochemical responses were measured using a potentiostat connected to a low-pass filter with a threshold frequency of 4 Hz and a differential amplifier. Monochromatic light from a 150 W xenon arc lamp and a grating monochromator was irradiated onto Ti specimens in an electrochemical cell through a quartz window. Current changes during photoirradiation for 20 s were recorded as photocurrent transients at each Ef. The measurement was performed at each measuring potential, Em, by decreasing Ef at regular intervals of 0.1 V with the wavelength of the incident light varying from 250 to 450 nm.
2.5 X-ray photoelectron spectroscopy
After polarization at each Ef in both Hanks and saline for 1 h, the Ti specimens were rinsed with ultrapure water to remove any chemical species not incorporated onto the surface and dried by a stream of N2 gas. Immediately after drying, the specimens were inserted in the pre-evacuation chamber of the XPS machine (JPS-9010MC, JEOL, Tokyo, Japan). Mg Kα line (1253.6 eV) was employed as the X-ray source. The binding energies were calibrated with the electron energy region of C 1s peak (285.0 eV) originating from the so-called contamination. The background of peaks was subtracted with Shirley’s method [Citation19]. The composition and thickness of the passive film were simultaneously calculated according to previous studies [Citation20,Citation21] that is outlined elsewhere [Citation7,Citation22,Citation23]. The results were statistically evaluated using one-way ANOVA with a significance of p < .05.
3. Results
3.1 Change in open circuit potential
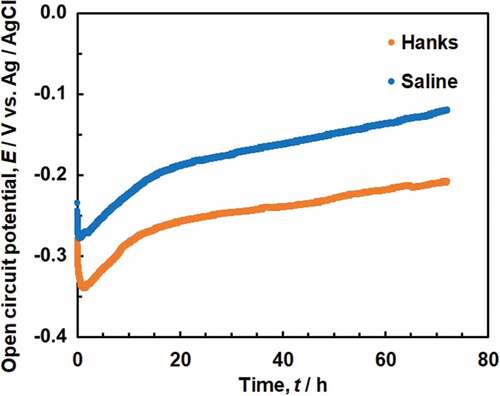
The pH of Hanks remained at 7.4 at 37ºC, and no precipitation was observed during the OCP measurement; the pH of saline gradually decreased to 5.7 after 6 h and 5.8 after 72 h at 37ºC. Changes in the OCP of Ti in Hanks and saline over time are shown in . The OCP was between −0.2 V and −0.3 V in Hanks and saline just after starting the measurement and immediately decreased after immersion, followed by a gradual increase with time. After 72 h, the OCP was approximately −0.2 V in Hanks and −0.1 V in saline. The OCP in saline was always more noble than that in Hanks because the pH of saline was lower than that of Hanks.
Figure 1. Change in open circuit potentials (OCP) of Ti in Hanks and saline for 72 h.
3.2 Photoelectrochemical response
A typical photocurrent transient for passive films formed on Ti in Hanks and saline is shown in . The shapes of the current transients in all the specimens were similar to that in this figure. The current varies during photoirradiation; therefore, the current recorded after 20 s was defined as the photocurrent, iph, for analysis in the present work.
Figure 2. Example of photocurrent transient generated with the light on and off for passive films on Ti.
shows the photocurrent responses of the passive films formed on Ti in Hanks and saline. The photocurrent varied depending on Em and the wavelength of the incident light. The photocurrent spectra were normalized for further analysis because the intensity of the light is not constant for each wavelength. Assuming that the photoexcitation is generated as an indirect transition, the photocurrent spectra were normalized as a photoelectrochemical action spectrum as follows [Citation15–18].
Figure 3. Photocurrent responses of the passive films formed on Ti in Hanks and saline.
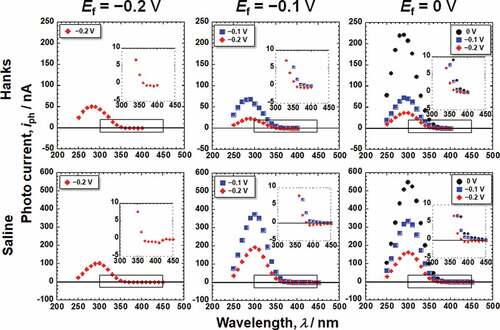
where I0 and hν are the intensity and photon energy of the incident light, respectively, C is the slope of the photoelectrochemical action spectrum and reflects the amplitude of the generated photocurrent, and h is Planck’s constant. By replotting the photocurrent spectra in , photoelectrochemical action spectra against the photon energy of irradiated light, Eph, were obtained, as shown in , corresponding to the Hanks and saline, respectively. The bottom figures show enlarged views of the lower photon energy region. In the case of Hanks, the photoelectrochemical action spectra did not exhibit a straight line with a constant C, instead C gradually changed. When the photocurrent is generated from a uniform composition layer, the direction of the photocurrent does not change at a fixed potential, even if the photon energy of the incident light is changed. In other words, Eg of the passive film was not uniform in the Hanks.
Figure 4. Photoelectrochemical action spectra calculated from the steady photocurrent in Hanks shown in .
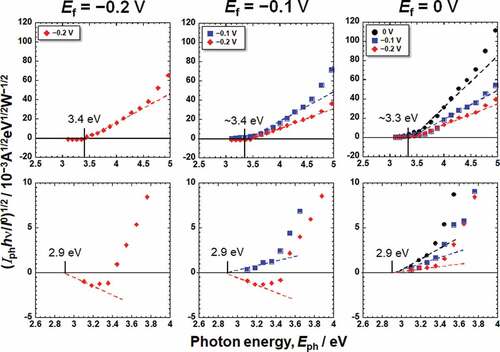
Figure 5. Photoelectrochemical action spectra calculated from the steady photocurrent in saline shown in .
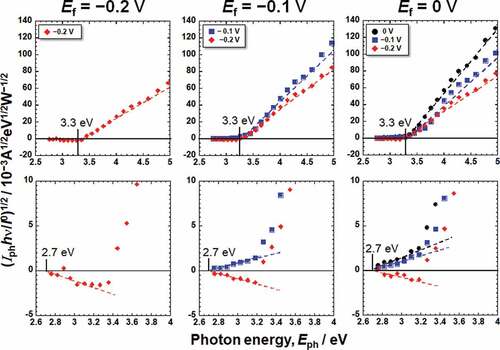
On subtracting the photoelectrochemical response of a component with lower band gap energy from the original photoelectrochemical action spectra, the photoelectrochemical action spectra for the other component with higher band gap energy are obtained in the higher photon energy region. The extrapolation of the remaining spectra on the horizontal axis represents a larger Eg component. The intersection between the extrapolation of the mean gradient lines and the horizontal axis represents Eg. For Hanks, the larger component of Eg was in the range of 3.3–3.4 eV. C decreased near the lower photoelectrochemical action region, and the intersection shows that the Eg was 2.9 eV. This value was identical for all the examined specimens in Hanks. In addition, the value of C for the Ef of −0.2 V was negative. In the case of saline, the Eg was determined to be 3.3 eV. Near the lower photoelectrochemical action region, Eg was 2.7 eV. The band gap values in Hanks were larger than those in the saline.
3.3 X-ray photoelectron spectroscopy
Titanium and oxygen were detected in all the Ti specimens. Carbon and nitrogen were also detected in the contaminated layer. In addition to the above elements, calcium and phosphorus were detected in specimens polarized in Hanks. No peak originating from CO32– was observed at approximately 289.6 eV [Citation24]. The Ti 2p, O 1s, Ca 2p, and P 2p electron energy region spectra obtained from Ti polarized at an Ef of 0 V are shown in . shows the deconvolution of the spectrum in the Ti 2p electron energy region. The Ti 2p spectrum contains four doublets corresponding to the metallic state of Ti0 and the oxide states of Ti2+, Ti3+, and Ti4+. The binding energy of each valence state of titanium was determined from the previously published data [Citation5]. The binding energy of the peak originating from Ti4+ before polarization was 458.8 eV and after polarization, it was 458.8–459.0 eV in both Hanks and saline. In addition, the [Ti4+]/([Ti2+] + [Ti3+] + [Ti4+]) ratio, calculated from the integrated intensities of the component peaks, was almost constant at 0.78–0.82 before and after polarization in Hanks and saline. In , the O 1s region spectrum contains three component peaks originating from oxide, O2–; hydroxyl groups or hydroxide, OH–; and adsorbed water or hydrate, H2O [Citation25]. The OH– peak included a peak from the phosphate oxygen, but the proportion of the latter was small. The [OH–]/[O2–] ratios are shown in . The ratios increased after polarization and those were the same at −0.2 V both in Hanks and saline. The ratio in Hanks significantly decreased with the increase in Ef, while that in saline was almost constant independent of Ef. Therefore, the ratio in saline was significantly larger than that in Hanks at 0 V. The binding energy of the Ca 2p3/2 electron was 347.6–347.7 eV (), indicating that calcium existed as Ca2+ [Citation26, Citation27]. The binding energy of the P 2p region peak was 133.9–134.2 eV, indicating that phosphorus existed as phosphate () [Citation22,Citation28]. Therefore, it can be concluded that the calcium and phosphorus ions exist in the passive film as calcium and phosphate ions and sometimes form calcium phosphate on the passive film.
Figure 6. (a) Ti 2p, (b) O 1s, (c) Ca 2p, and (d) P 2p electron energy region spectra obtained from Ti after polarization at 0 V in Hanks for 1 h.
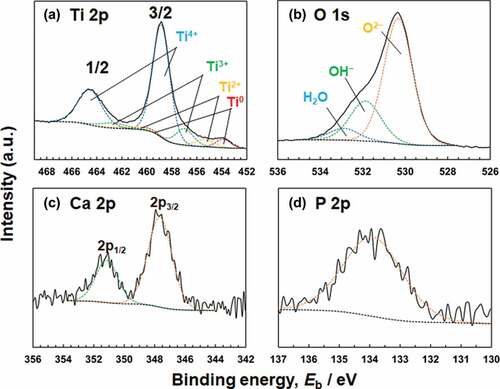
Figure 7. [OH−]/[O2−] ratios calculated form O 1s electron energy region spectra of Ti before and after polarization at each film formation potential, Ef (n = 3).
![Figure 7. [OH−]/[O2−] ratios calculated form O 1s electron energy region spectra of Ti before and after polarization at each film formation potential, Ef (n = 3).](/cms/asset/80622094-3f44-4f31-a02f-21f279e229d3/tsta_a_2066960_f0007_oc.jpg)
The relative concentrations of Ti, O, Ca, and P in the passive film without the Ti substrate were calculated by assuming that the total amount of these elements was 100 at.%, as presented in . It is evident that after polarization in Hanks, calcium and phosphate ions were incorporated into the passive film, but their amounts did not significantly change with increasing Ef. This table also contains ratios of calcium concentration to phosphorus concentration, [Ca]/[P]. The [Ca]/[P] ratios slightly increased with Ef, while no significant difference was observed. The thickness of the passive film increased slightly after polarization. The thickness in Hanks was comparable to or smaller than that in saline, despite the incorporation of calcium and phosphate ions or the formation of calcium phosphate.
Table 1. Relative concentrations of elements, [Ca]/[p] ratios, and thickness of the passive film formed on Ti (n = 3)
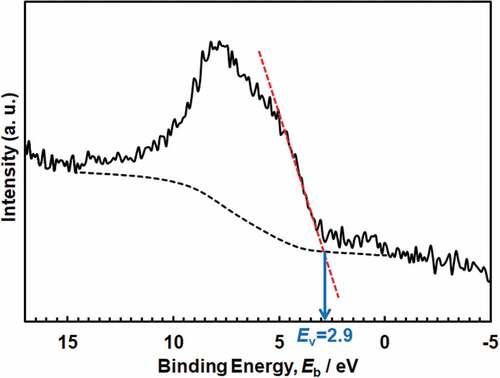
The valence-band energy-region spectra are shown in . The spectra were superimposed on those from the passive film and Ti substrate. In anatase, the valence band region contains two peaks at ~ 6 and ~8 eV, which correspond mainly to π (non-bonding) and σ (bonding) of O 2p orbitals, respectively [Citation28]. The 3σ orbital of OH− appears at a binding energy of ~10.8 eV [Citation29]. The water molecule and 3σ orbital of the dissociated water lie at approximately 13 and 11 eV, respectively [Citation30]. The maximum energy of the valence band, Ev, against the Fermi energy, EF, was determined by linearly extrapolating the fermi-level-side slope of the valence band peak on the baseline [Citation31]. The Ev was found to be 2.8–2.9 eV in Hanks and 2.8–3.0 eV in saline, while that in the polished Ti without polarization was 2.8 eV.
Figure 8. Valence band region spectra of Ti after polarization at 0 V in Hanks for 1 h and the determination of the maximum energy of valence band, Ev.
4. Discussion
XPS results revealed that the passive film on Ti consisted mainly of very thin TiO2 containing small amounts of Ti2O3 and TiO, along with hydroxyl groups and water (). These results are in accordance with those of previous studies [Citation5–7]. In addition, the composition is probably graded; more Ti4+ and OH− exist near the surface of the film [Citation6]. The passive film on Ti is non-stoichiometric TiO2 containing Ti2O3 and TiO that are electro conductive materials. However, the effect of Ti2O3 and TiO on the resultant Eg is unclear in this study. On the other hand, a large number of hydroxyl groups were detected using XPS. Therefore, similar to the passive film formed on Fe-Cr alloys, the passive film on Ti is assumed to consist of two layers [Citation32]: inner oxide and outer hydroxide. After polarization, the [OH−]/[O2−] ratios increased in the passive films of both the Hanks and saline (). The ratio in Hanks significantly decreased with the increase of Ef, probably caused by the formation of calcium phosphate. As a result, relative concentration of O at 0 V in Hanks were significantly smaller than those under other conditions () because of the decrease of OH−. The [OH−]/[O2−] ratios of the passive films on Co−28Cr−6Mo alloy (ASTM F799–95), Co–Ni–Cr–Mo alloy (ASTM F562), and 316 L-type stainless steel even before polarization were 2.9, 2.7, and 1.93 in a detection angle of 37°, respectively [Citation33–35]. Therefore, the [OH−]/[O2−] ratio in the surface oxide film on Ti was much smaller than that on the Co–Cr alloys and 316 L-type stainless steel. The thickness of the passive film on Ti is much larger than that on Co–Cr alloys and 316 L-type stainless steel; thus, the relative thickness of the hydroxide layer and the relative amount of hydroxyl groups decrease.
The thickness of the passive film was increased by 0.4–1.0 nm by polarization (). As the concentrations of Na+ and Cl− were almost the same in Hanks and saline, and other elements contained in Hanks were not contained in saline, the difference between the passive films formed in Hanks and those formed in saline may be due to the incorporation of calcium and phosphate ions or the formation of calcium phosphate in Hanks.
The Eg of the passive film formed in Hanks, 3.3–3.4 eV, was comparable or slightly larger than that in saline, 3.3 eV, independent of Ef and Em (). Interestingly, the Egs of the outer layer were identical for all the Ef and Em in each solution: 2.9 eV in Hanks and 2.7 eV in saline. Even in the lower photon energy region, Eg in Hanks was larger than that in saline. The Eg of hydroxyapatite was determined experimentally as >6 eV and theoretically as 4.95 eV [Citation36], whereas other studies reported it as 5.4 eV [Citation37] and 4.51 eV [Citation38]. The Eg of α-tricalcium phosphate (TCP) is 4.89 eV, and that of β-TCP is 5.25 eV [Citation38]. These values are much larger than those of TiO2. The formation of calcium phosphate in Hanks probably increases Eg of the inner and outer layers.
The Eg values of the passive film and the slope C of the photoelectrochemical action spectrum were obtained, as shown in . As mentioned above, Eg of the outer layer is much smaller than that inside the passive film. The passive film on Ti behaved as an n-type semiconductor. However, the photocurrents at the lower photon energy region at the Ef of −0.2 V and −0.1 V showed negative values at low Em (). We assume that the outer layer, where the band gap is small, is an n-type semiconductor and that the outer layer generates space charge layers at both the film–electrolyte interface and the outer layer–inner layer interface. The photocurrent changed from positive to negative with decreasing measurement potential, Em, because the gradients of the two space-charge layers were opposite. This phenomenon has been observed in a passive film on an Fe–Cr alloy with a p-type inner layer and an n-type outer layer [Citation18]. The same phenomenon was observed in this study, even though both the inner and outer layers were n-type. Further discussion is necessary for the comprehension of this observation.
The Eg of the passive film on Ti anodized in H2SO4 is 3.25 ± 0.05 eV [Citation12], whereas that anodized in artificial seawater is 3.4–3.7 eV and that anodized in borate buffer solution is 3.1 eV. After thermal oxidation at 400°C for 1 h, the Eg of the passive film on Ti is 3.4–3.7 eV [Citation14]. Meanwhile, the Eg values of the passive films formed in Hanks and saline in this study, 3.2–3.4 eV, were almost the same as those in previous studies. The Eg of TiO2 ceramics, rutile and anatase, are 3.0 eV and 3.2 eV, respectively. Therefore, Eg of the passive film formed during anodic oxidation is comparable to or larger than that of TiO2 ceramics, while in the outermost surface of the passive film, it is smaller than that of TiO2 ceramics.
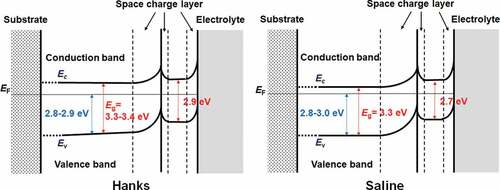
From the above results and discussion, the electronic band structures of the passive film formed on Ti in Hanks and saline are shown in . The Eg of the inner layer in Hanks was not constant but changed with depth because slope C was not constant but gradually decreased with decreasing photon energy (). The band structure of the outer hydroxide layer was based on our previous study [Citation16–18]. In the case of Hanks, Eg in the inner oxide layer was 3.3–3.4 eV. In the outermost surface layer, Eg was much lower (2.9 eV). In saline, Eg was 3.3 eV in the inner oxide layer and 2.7 eV in the outermost layer. In the inner oxide layer of Hanks, Eg was the same as or larger than that of saline, while Ev, the energy difference between EF, the Fermi energy of the Ti substrate, and that of the valence band of the inner oxide layer, was 2.8–2.9 eV in Hanks and 2.8–3.0 eV in saline. Therefore, the minimum energy of the conduction band, Ec, against EF in Hanks was larger than that in saline.
Figure 9. Electronic band structures of passive films formed on Ti in Hanks and saline.
Zr forms a highly stable and protective passive film, and the reactivity of Zr is much smaller than that of Ti [Citation39]. In the case of the passive film on Zr, Eg is 3.01–3.47 eV in the outer hydroxide layer and 4.44–4.91 eV in the inner oxide layer [Citation40]. The passive film on Zr consists mainly of ZrO2 with hydroxyl groups. The Eg is 4.27–4.93 eV by theory and 5.78–6.1 eV by experiment that varies according to the crystal systems [Citation41]. These values are much larger than those for TiO2 and the passive film on Ti. Therefore, the reactivity of a material can be determined based on Eg. The Eg values in the outermost layer are much smaller than those of TiO2 crystalline ceramics, rutile, and anatase, whereas the values in the inner layer are slightly larger than or almost the same as those of TiO2 ceramics. A very thin and non-stoichiometric composition probably reduces the Eg. Therefore, differences in the composition, structure, and chemical state influence Eg, and thinness and non-stoichiometric composition decrease Eg. The decrease in the Eg of a material activates its reactivity, as is known for TiO2 photocatalysts. The excellent biocompatibility of Ti among the metals may be induced by the low Eg of the outermost surface layer in the passive film, which has a high corrosion resistance. Calcium phosphate is regularly formed on Ti, but not on TiO2. Calcium phosphate formation kinetics on Ti are distinct from those on TiO2 crystalline ceramics [Citation10]. The Eg values of the outermost surface of the passive film formed on Ti are smaller than those of the TiO2 ceramics, rutile (Eg = 3.0 eV), and anatase (Eg = 3.2 eV). Therefore, the Ti surface is more reactive with the surrounding environment than the TiO2 ceramic surface. This reactivity is probably one factor contributing to the excellent biocompatibility of Ti, in addition to its excellent corrosion resistance.
5. Conclusions
Passive films mainly consisted of a very thin TiO2 layer containing small amounts of Ti2O3 and TiO, hydroxyl groups, and water. During polarization in Hanks, calcium and phosphate ions were incorporated or formed calcium phosphate but not in saline. Calcium phosphate and hydroxyl groups influenced the band structure. Eg was graded in Hanks but constant in saline, independent of Ef and Em. The passive film on Ti behaved as an n-type semiconductor containing two layers: an inner oxide layer with a large Eg and an outer hydroxide layer with a small Eg. In Hanks, the value of Eg in the inner layer was 3.3–3.4 eV, whereas it was much lower in the outermost surface layer (2.9 eV). In saline, Eg was 3.3 eV in the inner layer and 2.7 eV in the outermost layer. The Eg values of the outermost surfaces of the passive films formed on Ti were smaller than those of TiO2 ceramics. Therefore, the Ti surface is more reactive with the surrounding environment than the TiO2 ceramic surface. This is probably one of the reasons for the excellent biocompatibility of Ti among metals, in addition to its excellent corrosion resistance.
Supplemental Material
Download PDF (1,007.1 KB)Supplemental Material
Download PDF (288.8 KB)Supplemental Material
Download PDF (1.7 MB)Disclosure statement
No potential conflict of interest was reported by the author(s).
Supplementary material
Supplemental data for this article can be accessed here.
Additional information
Funding
Related Research Data
References
- Brunette DM, Tenvall P, Textor M, et al. Titanium in medicine. Berlin: Springer; 2001. doi:10.1007/978-3-642-56486-4
- Sanderson PL, Ryan W, Turner PG. Complications of metalwork removal. Injury. 1992;23(1):29–30. doi:10.1016/0020-1383(92)90121-8
- Hanawa T. Titanium-tissue interface reaction and its control with surface treatment. Front Bioeng Biotechnol. 2019;7:170. doi:10.3389/fbioe.2019.00170
- Kelly EJ. Electrochemical behavior of titanium. Mod Aspect Electrochem. 1982;14:319–424. doi:10.3389/fbioe.2019.00170.
- Asami K, Chen SC, Habazaki H, et al. The surface characterization of titanium and titanium–nickel alloys in sulfuric acid. Corros Sci. 1993;35(1–4):43–49. doi:10.1016/0010-938X(93)90131-Y
- Hanawa T, Asami K, Asaoka K. Repassivation of titanium and surface oxide film regenerated in simulated bioliquid. J Biomed Mater Res. 1998;40:530–538. doi:10.1002/(sici)1097-4636(19980615)40:4<530::aid-jbm3>3.0.co;2-g
- Hiji A, Hanawa T, Shimabukuro M, et al. Initial formation kinetics of calcium phosphate on titanium in Hanks’ solution characterized using XPS. Surf Interface Anal. 2021;53(2):185–193. doi:10.1002/sia.6900
- Olver JW, Ross JW. On the standard potential of the titanium(iii)-titanium(ii) couple. J Am Chem Soc. 1963;85(17):2565–2566. doi:10.1021/ja00900a006
- Wang L, Yu H, Wang K, et al. Local fine structural insight into mechanism of electrochemical passivation of titanium. ACS Appl Mater Interfaces. 2016;8(28):18608–18619. doi:10.1021/acsami.6b05080
- Hiji A, Hanawa T, Yokoi T, et al. Time transient of calcium and phosphate ion adsorption by rutile crystal facets in Hanks’ solution characterized by XPS. Langmuir. 2021;37:3597–3604. doi:10.1021/acs.langmuir.0c03540
- Diebold U. The surface science of titanium dioxide. Surf Sci Rep. 2003;48:53–229. doi:10.1016/S0167-5729(02)00100-0
- Di Quarto F, Piazza S, Sunseri C. The photoelectrochemistry of thin passive layers. Investigation of anodic oxide films on titanium metals. Electrochim Acta. 1993;38(1):29–35. doi:10.1016/0013-4686(93)80006-L
- Marsh J, Gorse D. A photoelectrochemical and ac impedance study of anodic titanium oxide films. Electrochim Acta. 1998;43(7):659–670. doi:10.1016/S0013-4686(97)00210-7
- Kim DY, Kwon HS. A study on electronic properties of passive film formed on Ti. Corros Sci Technol. 2003;2:212–218.
- Tsuchiya H, Fujimoto S. Semiconductor properties of passive films formed on sputter-deposited Fe–18Cr alloy thin films with various additive elements. Sci Technol Adv Mater. 2004;5(1–2):195–200. doi:10.1016/j.stam.2003.10.014
- Tsuchiya H, Fujimoto S, Shibata T. Semiconductive properties of passive films formed on Fe-18cr in borate buffer solution. J Electrochem Soc. 2004;151(2):B39–B44. doi: 10.1149/1.1639163
- Tsuchiya H, Fujimoto S, Shibata T. Semiconductive behavior of passive films formed on Fe-Cr alloy. J Electroceram. 2006;6:9–54. doi:10.1007/s10832-006-5703-z
- Fujimoto S, Tsuchiya H. Semiconductor properties and protective role of passive films of iron base alloys. Corros Sci. 2007;49(1):195–202. doi:10.1016/j.corsci.2006.05.020
- Shirley DA. High-resolution X-ray photoemission spectrum of the valence bands of gold. Phys Rev B. 1972;5(12):4709–4714. doi:10.1103/PhysRevB.5.4709
- Asami K, Hashimoto K, Shimodaira S. XPS determination of compositions of alloy surfaces and surface oxides on mechanically polished iron–chromium alloys. Corros Sci. 1977;17(9):713–723. doi:10.1016/0010-938X(77)90067-1
- Asami K, Hashimoto K. An XPS study of the surfaces on Fe-Cr, Fe-Co and Fe-Ni alloys after mechanical polishing. Corros Sci. 1984;24(2):83–97. doi:10.1016/0010-938X(84)90039-8
- Hanawa T, Ota M. Calcium phosphate naturally formed on titanium in electrolyte solution. Biomaterials. 1991;12:767–774. doi:10.1016/0142-9612(91)90028-9
- Tanaka Y, Nakai M, Akahori T, et al. Characterization of air-formed surface oxide film on Ti–29Nb–13Ta–4.6Zr alloy surface using XPS and AES. Corros Sci. 2008;50(8):2111–2116. doi:10.1016/j.corsci.2008.06.002
- Hammond JS, Holubka JW, DeVries JE, et al. The application of X-ray photo-electron spectroscopy to a study of interfacial composition in corrosion-induced paint de-adhesion. Corros Sci. 1981;21(3):239–253. doi:10.1016/0010-938X(81)90033-0
- Asami K, Hashimoto K. The X-ray photo-electron spectra of several oxides of iron and chromium. Corros Sci. 1977;17(7):559–570. doi:10.1016/S0010-938X(77)80002-4
- Wagner CD. Photoelectron and Auger energies and the Auger parameter: a data set. In: Briggs D Seah MP, editors. Practical surface analysis. 2nd ed. New York: Wiley; 1990. pp. 595–634. doi:10.1002/jctb.280530219
- Hanawa T, Ota M. Characterization of surface film formed on titanium in electrolyte using XPS. Appl Surf Sci. 1992;55(4):269–276. doi:10.1016/0169-4332(92)90178-Z
- Orendorz A, Wüsten J, and Ziegler C, et al. Photoelectron spectroscopy of nanocrystalline anatase TiO2 films. Appl Surf Sci. 2005;252(1):85–88. doi:10.1016/j.apsusc.2005.02.002
- Fusi M, Maccallini E, Caruso T, et al. Surface electronic and structural properties of nanostructured titanium oxide grown by pulsed laser deposition. Surf Sci. 2011;605(3–4):333–340. doi:10.1016/j.susc.2010.10.039
- Kurtz RL, Stock-Bauer R, Msdey TE, et al. Synchrotron radiation studies of H2O adsorption on TiO2(110). Surf Sci. 1989;218(1):178–200. doi:10.1016/0039-6028(89)90626-2
- Singh AP, Kodan N, Mehta BR. Enhancing the photoelectrochemical properties of titanium dioxide by thermal treatment in oxygen deficient environment. Appl Surf Sci. 2016;372:63–69. doi: 10.1016/j.apsusc.2016.03.072
- Lynch B, Wiame F, Maurice V, et al. XPS study of oxide nucleation and growth mechanisms on a model FeCrnimo stainless steel surface. Appl Surf Sci. 2022;575:151681. doi:10.1016/j.apsusc.2021.151681
- Hanawa T, Hiromoto S, Asami K. Characterization of the surface oxide film of a Co–Cr–Mo alloy after being located in quasi-biological environments using XPS. Appl Surf Sci. 2001;183(1–2):68–75. doi:10.1016/S0169-4332(01)00551-7
- Nagai A, Tsutsumi Y, Suzuki Y, et al. Characterization of air-formed surface oxide film on a Co–Ni–Cr–Mo alloy (MP35N) and its change in Hanks’ solution. Appl Surf Sci. 2012;258(14):5490–5498. doi:10.1016/j.apsusc.2012.02.057
- Hanawa T, Hiromoto S, Yamamoto A, et al. XPS characterization of the surface oxide film of 316L stainless steel samples that were located in quasi-biological environments. Mater Trans. 2002;43(12):3088–3092. doi:10.2320/matertrans.43.3088
- Tsukada M, Wakamura M, Yoshida N, et al. Band gap and photocatalytic properties of Ti-substituted hydroxyapatite: comparison with anatase-TiO2. J Mol Catal a. 2011;338:18–23. doi:10.1016/j.molcata.2011.01.017
- Calderín L, Stott MJ, Rubio A. Electronic and crystallographic structure of apatites. Phys Rev B. 2003;67(13):134106. doi:10.1103/PhysRevB.67.134106
- Liang L, Rulis P, Ching WY. Mechanical properties, electronic structure and bonding of α- and β-tricalcium phosphates with surface characterization. Acta Biomater. 2010;6(9):3763–3771. doi:10.1016/j.actbio.2010.03.033
- Tsutsumi Y, Nishimura D, Doi H, et al. Difference in surface reactions between titanium and zirconium in Hanks’ solution to elucidate mechanism of calcium phosphate formation on titanium using XPS and cathodic polarization. Mater Sci Eng C. 2009;29(5):1702–1708. doi:10.1016/j.msec.2009.01.016
- Kim BY, Park CJ, Kwon H. Effect of niobium on the electronic properties of passive films on zirconium alloys. J Electroanal Chem. 2005;576(2):269–276. doi:10.1016/j.jelechem.2004.11.002
- French RH, Glass SJ, Ohuchi FS, et al. Experimental and theoretical determination of the electronic structure and optical properties of three phases of ZrO2. Phys Rev B. 1994;49(8):5133–5142. doi:10.1103/PhysRevB.49.5133