
ABSTRACT
In the absence of sustained federal leadership to address climate change, many US states and cities have implemented their own climate policies. In 2018, the State of Hawai‘i set a goal of sequestering more greenhouse gases (GHGs) annually than emitted no later than 2045. This study builds a Computable General Equilibrium (CGE) model to understand how a state-level carbon tax in Hawai‘i could contribute to meeting this objective and how it would change household welfare for five different income groups. Against a baseline of existing federal and state GHG-related policies, we find that if Hawai‘i were to adopt a carbon tax at the level of the 2021 federally-specified social cost of carbon, Hawai‘i’s cumulative emissions would decline by an additional 10% from 2025 to 2045. Changes in group welfare depend heavily on whether carbon tax revenues are paid to households as equal-share dividends or used for increased state spending. If revenues are returned to households, the tax is progressive and benefits the average household in all five income groups. This is primarily because visitors pay the carbon tax while on a Hawai‘i vacation; their contributions amount to approximately one-third of collected revenues. Our findings are relevant to tourism-intensive regions, economies with demand-inelastic GHG-intensive export sectors, and island economies.
Key policy insights
A carbon tax for Hawai‘i set at the federal social cost of carbon – starting at $56/MtCO2e in 2025 and increasing to $79/MtCO2e in 2045 ($2020) – would reduce cumulative GHG emissions by 10% relative to the baseline from 2025 to 2045.
When carbon tax revenues are paid as equal-share dividends to Hawai‘i households, the incidence of the carbon tax policy is progressive across income groups (by quintile).
Carbon pricing with equal-share dividend payments results in net welfare gains for all household income groups, in part due to the large visitor contribution to carbon tax revenues.
These findings are relevant to tourism-intensive regions, economies with demand-inelastic GHG-intensive export sectors, and island economies.
State government carbon pricing programmes that recycle revenues towards households have the potential to mitigate GHGs and deliver broad benefits to households, which could speed regional and national climate action.
1. Introduction
The Intergovernmental Panel on Climate Change (IPCC) finds that to stall the global warming trend at 1.5°C requires immediate decarbonization and achieving net zero GHG emissions by approximately 2050 (IPCC, 2018). In the absence of sustained federal leadership to address climate change, many US states and cities have implemented their own climate policies. In response to the Trump Administration’s decision to leave the Paris Agreement, Hawai‘i passed legislation in 2018 that set a goal of sequestering more GHGs annually than emitted by no later than 2045 (HRS, Citation2018, §225P-5). Numerous studies have shown that putting an explicit price on GHG emissions is an efficient means of abatement because it directly discourages GHG-intensive activities (Metcalf, Citation2021; Newell & Pizer, Citation2003; Nordhaus, Citation2007). Most research on carbon pricing focuses on federal rather than state-level policy because it would more effectively capture upstream sources of GHGs as well as lessen possibilities for leakage and loss of competitiveness by a single state (Caron et al., Citation2015). However, because there has been little political appetite for US federal carbon pricing, thirteen states have developed regional carbon markets.
We built a Computable General Equilibrium (CGE) model of Hawai‘i to explore the role of state-level carbon pricing to meet the objective of decarbonizing by 2045. The Hawai‘i CGE (H-CGE) model represents economic and GHG flows, including patterns of household spending organized by income quintile, and important market aspects of Hawai‘i’s tourism-dominated economy. The baseline model accounts for existing policies that also reduce GHGs, most notably Hawai‘i’s Renewable Portfolio Standard (RPS). We run two scenarios, both incorporating a carbon tax set at the social cost of carbon (SCC) estimate adopted by the Federal Interagency Working Group on the Social Cost of Greenhouse Gases. The carbon tax starts at $56/MtCO2e in 2025 and increases to $79/MtCO2e in 2045 ($2020) (EPA, Citation2016; Interagency Working Group, Citation2021).Footnote1 In the first scenario, carbon tax revenues are used to fund general state government expenditures and, in the second scenario, carbon tax revenues are returned to households in equal-share dividend payments.
We find that a carbon tax for Hawai‘i set at the federal SCC would reduce cumulative GHG emissions by an additional 10% from the baseline over the 2025–2045 study period. Visitors to Hawai‘i would pay roughly a third of the carbon tax revenues. Consequently, when carbon tax revenues are paid as equal-share dividends to Hawai‘i households, we find that the welfare of each household income group improves, with proportionately more benefit accruing to lower-income households. This is an important finding for a state-level approach, as GHG mitigation policies that broadly benefit households can help to generate additional regional and national climate action that is necessary to tackle the global climate crisis.
2. Background and literature review
As of May 2021, 64 carbon pricing programmes have been implemented or planned, covering 22% of global GHG emissions (World Bank, Citation2021). Most carbon pricing programmes are at the national level because raising the cost of GHG emissions in one region can result in an increase in emissions from GHG-intensive activities in other regions without or with lower carbon prices.Footnote2 Slow adoption of carbon policies has led to the establishment of important sub-national programmes, both in Canada and the United States. In 2008, British Columbia adopted a carbon tax that was set to US$34/MtCO2e in April 2021. Several other Canadian provinces have similar programmes, though with smaller tax rates than British Columbia. The Canadian federal government in 2020 implemented a minimum carbon tax, starting at US$22/MtCO2e.Footnote3 In the United States, the longest-standing carbon pricing programme is the Regional Greenhouse Gas Initiative (RGGI), a cap-and-trade programme for the electric power sector covering eleven Northeastern states (RGGI, Citation2019). California developed a cap-and-trade programme and is currently linked to Québec’s carbon market via the Western Climate Initiative (WCI, Citation2022). The Washington State Legislature passed a cap-and-trade measure in April 2021 after Washington voters twice rejected ballot measures for a carbon tax (Carattini & Sen, Citation2019; Washington State Legislature, Citation2021). The State Climate Policy Network shows carbon pricing legislation has been introduced in 19 states, but only Washington’s most recent legislation has become law (ClimateXChange, Citation2021).
Despite the number of sub-national governments considering carbon pricing, there are relatively few studies estimating the economic and GHG impacts of these policies. Studies of carbon tax proposals for Rhode Island (CADMUS, Citation2021), Oregon (Liu et al., Citation2014; Liu & Renfro, Citation2013), and Washington (Mori, Citation2012) use Mori’s carbon tax assessment model (CTAM) or input-output models. CTAM is an elasticity-based model that provides partial equilibrium results with a focus on GHG-intensive sectors. Input-output models take a more economy-wide approach, yet lack price feedback. What the CTAM or input-output models gain in user-friendly features comes at the expense of more comprehensive estimates of adjustments by consumers and producers, which are captured by more completely-specified CGE models. CGE is the preferred method to assess the economic implications of tax interventions because it captures producer-side and consumer-side impacts, linkages among sectors, as well as full price feedbacks (Goulder et al., Citation2019). Two studies (Hafstead, Citation2020; Hafstead et al., Citation2019) use CGE models to assess the impacts of carbon pricing in Colorado and Vermont.
A particular benefit of CGE modelling is that it captures changes in prices paid by consumers due to carbon pricing, as well as changes in household consumption, capital income, labour income, and government transfers due to carbon pricing. The consumer price effects are often called ‘use-side’ impacts and the income effects ‘source-side’ impacts. A commonly stated reservation to carbon pricing is that it disproportionately harms lower-income households, i.e. is regressive in its incidence (Farrell, Citation2017; Metcalf, Citation2021; Wang et al., Citation2016). It is well-documented that carbon pricing is regressive when only use-side impacts are considered because a carbon tax increases prices of GHG-intensive goods and services that constitute a larger share of spending by lower-income, rather than higher-income, households (Burtraw et al., Citation2009; Dissou & Siddiqui, Citation2014; Goulder et al., Citation2019; Hassett et al., Citation2009; Metcalf et al., Citation2008; Rausch et al., Citation2011). However, studies incorporating source-side impacts show that carbon pricing can be progressive (Goulder et al., Citation2019; Rausch et al., Citation2011; Williams et al., Citation2015). Source-side impacts, generated by changes in household capital income, labour income, and transfers, are typically progressive because carbon pricing reduces capital income, which primarily accrues to higher-income households. In addition, when carbon tax revenues are paid to households in equal-share dividends, higher-income households with higher consumption of GHG-intensive goods and higher carbon tax payments will have larger net tax burdens than lower-income households (Goulder et al., Citation2019).
Beck et al. (Citation2015) use a CGE model to study British Columbia’s carbon tax and find that the carbon tax incidence is progressive, even prior to considering payment of dividends to households. Using a CGE model for Australia, Sajeewani et al. (Citation2015) find that a carbon tax has a mildly progressive tax incidence both with and without payment of carbon tax dividends to households. Using a CGE model for the United States, Goulder et al. (Citation2019) find that the average household in the lowest 20% of the income distribution would experience net welfare gains from a US carbon pricing policy if revenues were returned to households in equal shares. For Vermont, Hafstead et al. (Citation2019) find that the lowest two household income quintiles would experience net welfare gains if carbon tax revenues are returned to households in equal shares.Footnote4 Lastly, Sabine et al. (Citation2020) use a CGE model to assess impacts of carbon taxation for La Réunion, a fossil fuel-dependent island with strong renewable energy goals. Using a single representative household, which precludes analysis of distributional effects, Sabine et al. find that the carbon tax has a contractionary economic impact that is ameliorated by returning revenues to the household.
2.1 Existing GHG reduction efforts in Hawai‘i
The State of Hawai‘i has adopted several policies intended to mitigate its contribution to global GHGs. Nearly 90% percent of Hawai‘i’s GHG emissions are attributable to the energy sector; its emissions are split between stationary energy (mainly electricity) and transportation (ICF & UHERO, Citation2019). The most influential policy tool currently in place to reduce GHG emissions is the state’s RPS, which requires Hawai‘i utilities to reach 100% of net electricity sales from renewable sources by 2045. There are interim targets of 30% in 2020, 40% by 2030, and 70% by 2040. Electricity generation in Hawai‘i differs from the continental United States because 60% is generated with petroleum. The one existing coal-fired power plant is scheduled to shutter in 2022 (PUC, Citation2021). Renewable energy sources currently account for a quarter of the generation mix (EIA, Citation2020a; PUC, Citation2019).
Whereas stationary GHG emissions have declined from 2010, transportation-related GHG emissions have continued to rise (ICF & UHERO, Citation2019). Hawai‘i has implemented a patchwork of policy tools aimed at increasing the adoption of electric vehicles (EVs), with 1% of registered vehicles in 2019 being EVs (DBEDT, Citation2021). Beyond federal and state gasoline taxes, the Environmental Response, Energy, and Food Security Tax imposes $1.05 on each barrel of petroleum, and a 19 cent/MMBtu tax on non-petroleum fossil fuels. This tax rate is equivalent to a carbon tax of about $2.40/MtCO2e.
3. Methods
Our H-CGE model is built upon four primary datasets: the State of Hawai‘i Input-Output (I-O) Study (DBEDT, Citation2016), the US Consumer Expenditure Survey (CES) (BLS, Citation2019), the Hawai‘i GHG Inventory (ICF & UHERO, Citation2019), and statewide economic data for gross state product and visitor spending (DBEDT, Citation2018; UHERO, Citation2020). Hawai‘i is mainly represented as a small open economy, meaning that it is a price-taker on US and global markets, with one important exception. Tourism is Hawai‘i’s largest private-sector industry, providing services to 10.4 million visitors in 2019 (HTA, Citation2020). Studies on tax interventions in the Hawai‘i tourism market show that the industry benefits from an inelastic demand for Hawai‘i vacations (Bonham & Gangnes, Citation1996; Fuleky et al., Citation2014).
H-CGE is a recursive-dynamic model that represents the flows of goods and services through Hawai‘i’s economy. H-CGE is initially calibrated to 2012 and updated to 2016 and 2019. These years are selected to connect H-CGE to the available GHG data (2016) and the last year (2019) of complete economic data prec eding severe shocks to the Hawai‘i economy from the COVID-19 pandemic. The model is then projected in five-year intervals from 2025 to 2045.
The I-O data detail expenditures across 68 economic sectors from a representative household and visitor. For tractability, we aggregate the 68 economic sectors into 16. To examine the distributional effects of a carbon tax, we follow Goulder et al. (Citation2019) and use the US CES to disaggregate the representative household into five groups of households based on income quintiles. This section describes the data, structure of the model, baseline assumptions, and the two carbon tax scenarios. The Appendix provides further details.
3.1 An overview of the Hawai‘i economy
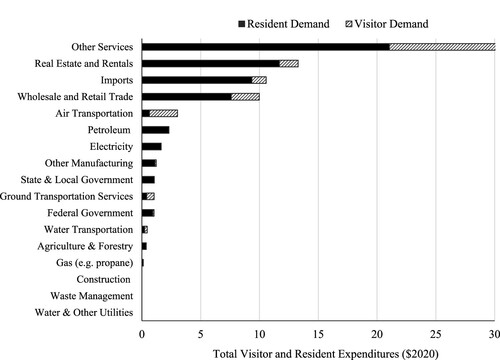
Spending by Hawai‘i residents is concentrated on services (36%), real estate and rentals – i.e. housing (20%), imports (16%) and wholesale/retail trade (13%). About 3% of spending goes to electricity and 4% to petroleum products, such as gasoline for private vehicle transportation. Visitor spending was $16 billion in 2012 ($2020), about one-third of resident spending; it goes to accommodations and restaurants (52%), air transportation (13%) and wholesale/retail trade (13%).Footnote5 Direct spending by residents and visitors is shown in .
Figure 1. Total Expenditures by Visitors and Residents by Sector. Note: Visitor spending on gasoline is included in the petroleum category and is not visible in the figure as it is less than 1% of spending on petroleum products.
3.2 Household spending by income quintiles
shows the pattern of spending across sectors for households in each income group. Expenditure categories in CES data are matched to the 16 economic sectors for H-CGE. This allows us to estimate expenditure shares by sector and sort household spending by quintiles of before-tax income (BLS, Citation2019).Footnote6
Table 1. Percentage of Household Expenditures by Sector by Income Group.
Across all Hawai‘i income quintiles, the largest proportion of household expenditures goes to real estate and rentals (i.e. housing), services, and wholesale and retail trade. There are some notable differences in expenditure shares across households: lower-income households spend a larger share of their income on petroleum (i.e. gasoline) and electricity compared to the highest income quintile, while the opposite holds for spending on air and water transportation. Direct expenditures on water transportation are skewed towards upper-income households primarily because they include expenditures on recreational boating.
Though lower-income households devote a larger proportion of their spending to key energy and GHG-intensive sectors, it is higher-income households who spend more money on these sectors. The highest-income quintile accounts for 32% of all household expenditures on petroleum products, such as gasoline, versus 10% for the lowest quintile household; 26% versus 14% for electricity; 31% versus 12% for gas; 58% versus 1% for water transportation; 52% versus 5% for air transportation; and 39% versus 10% for ground transportation services.
3.3 Linking to GHG emissions
H-CGE incorporates GHGs from the combustion of fossil fuels in Hawai‘i and those associated with domestic transportation fuel sold in Hawai‘i, e.g. fuel for flights to the US mainland and intra-state destinations. This covers 81% of total statewide GHG emissions.
To operationalize relevant GHG emissions in H-CGE, we divide them into their fossil fuel source, and map fossil fuel quantities to the economic sectors in the I-O Table. presents the baseline GHG-intensity of sectors with substantial emissions.
Figure 2. GHG Intensity of Economic Sectors with GHG Emissions at least 0.01 MMtCO2e/$Billion.Footnote16
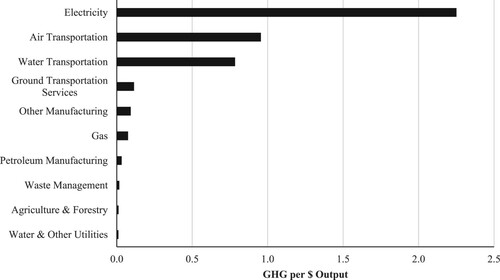
As measured by GHGs per dollar of output, electricity is the most GHG-intensive sector in Hawai‘i, followed by air transportation and water transportation. Far behind these sectors are ground transportation services and other manufacturing. Petroleum manufacturing – refining and processing – is less GHG-intensive only because its emissions are primarily attributed to the sectors in which petroleum products are burned. Twenty-five percent of baseline GHG emissions from direct and indirect consumption are attributed to visitors to Hawai‘i. This estimate is similar to an earlier estimate of 22% for 1997 (Konan & Chan, Citation2010).
3.4 Key baseline model assumptions
The H-CGE model is projected forward based on two key parameters: gross state product and visitor spending. Historic data are used between 2012 and 2019 (UHERO, Citation2020) and forecasts thereafter. Though we do not solve the model for the year 2020, we account for the severe effect of the global pandemic on the Hawai‘i economy in our baseline forecast of economic recovery and growth by assuming that gross state product and visitor spending do not recover to 2019 levels until 2025. This approach is informed by a combination of several short-term macroeconomic outlooks (DBEDT, Citation2020; UHERO, Citation2021). After 2025, we assume that the Hawai‘i economy returns to steady-state growth as represented by a long-run forecast of Hawai‘i gross state product to 2045 (DBEDT, Citation2018).
The baseline model also incorporates measures of federal and state policies and trends that directly influence GHG emissions in Hawai‘i. These include the state RPS, federal vehicle fuel economy standards, and sector energy efficiency (ICF & UHERO, Citation2019). Using Hawaiian Electric’s (the sole electric utility on five of the six largest islands) demand projections and generation plan for both distributed energy and total electricity generation, we estimate that the RPS will result in 29% of electricity generated through renewable sources in 2025 and 72% by 2045 (Hawaiian Electric, Citation2020; PUC, Citation2016).Footnote7 This provides a baseline constraint for minimum renewable energy generation in the model. Similarly, H-CGE incorporates two types of light-duty vehicles: gasoline-powered vehicles and EVs. Forecasts for EV adoption vary widely, so we take a forecast halfway between national and state forecasts (EIA, Citation2020b; Hawaiian Electric, Citation2020). This implies that EVs as a percentage of cars on the road increase from 3% in 2025 to 34% by 2045. Lastly, we use estimates of improvements in exogenous energy efficiency in major sectors reported in the US Annual Energy Outlook 2020 (EIA, Citation2020b). Annual estimates range from 0.5% for petroleum in the commercial sector to 2.5% for electricity in the commercial sector. See the Appendix for estimates for other sectors.
3.5 Scenarios
Our analysis covers two carbon tax policy scenarios. Both estimate the impacts of a carbon tax set at the federal SCC () but differ in their assumptions regarding the use of carbon tax revenues. The carbon tax is assumed to be levied at the point of import of fossil fuels to the state, with exceptions made for military and international sources of transportation fuel.
Table 2. US Federal Social Cost of Carbon, 2025–2045 ($2020/MtCO2e).
In the first scenario, SCC with Government Spending, the state government collects carbon tax revenues and spends them based on existing government spending patterns. In the second scenario, SCC with Equal-Share Dividends, the state government collects carbon tax revenues and redistributes revenues – all except those from taxation of aviation fuel – as equal-share dividend payments to Hawai‘i households. The state spends revenues from the taxation of aviation fuel according to federal restrictions on the use of tax revenues from aviation fuel.Footnote8
4. Results
4.1 GHG emissions
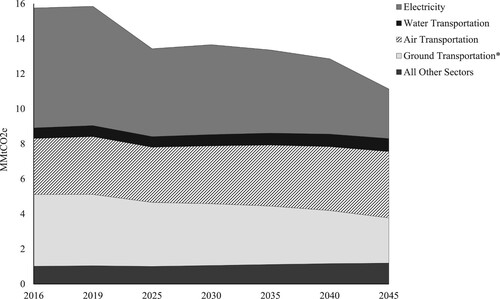
Targeted GHG emissions in 2016 amounted to 15.8 MMtCO2e (ICF & UHERO, Citation2019). We expect baseline GHGs to fall to 13.4 MMtCO2e by 2025 – resulting from the mandated closure of O‘ahu’s coal-fired power plant and the assumption of zero overall economic growth from 2020 to 2025 due to the pandemic. From 2025 to 2030, baseline emissions are estimated to increase because economic growth outpaces the increase in the RPS and improvements in energy efficiency. Between 2030 and 2045, baseline emissions trend downward as the RPS target increases and transportation becomes more electrified. Aviation emissions are estimated to rise over time and by 2045, they make up the largest portion of emissions (see ).
Figure 3. Baseline GHG Emissions by Sector (MMtCO2e).
displays the change in emissions by sector from the baseline due to imposition of the carbon tax set at the level of the federal SCC (). There is an additional seven percentage point reduction in GHG emissions relative to baseline levels in 2025 and a 13 percentage point reduction in 2045. displays only GHG impacts in the SCC with Government Spending scenario because impacts are similar in both scenarios.Footnote9
Figure 4. Change in GHG Emissions from the Baseline by Sector (SCC with Government Spending), MMtCO2e. *Includes ground transportation services and personal vehicle travel.
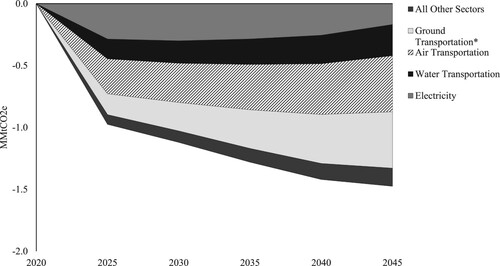
The largest sources of GHG reduction come from ground and air transportation. In the electricity sector, the RPS constraint continues to be binding in terms of requiring renewable sources of electricity generation. However, additional reductions in the electricity sector’s GHG emissions are achieved with the carbon tax because it prompts more efficient use of fossil fuel units. Together, the relative impact of the carbon tax on electricity sector costs is minimal. On the other hand, increased gasoline prices cause both a reduction in vehicle travel and an increase in EV adoption. We estimate that EVs as a percentage of total vehicle miles trave led will increase by eight percentage points in 2045 relative to the baseline – from 34% to 42%.
4.2 Macroeconomic and sector impacts
The introduction of the carbon tax causes a small contraction of the Hawai‘i economy. shows the impact of the carbon tax on total output, visitor spending, imports, and exports. Because results are similar in the two scenarios, results are shown only for the SCC with Government Spending scenario.
Figure 5. Economic Impacts of the Carbon Tax (SCC with government spending), Percent Change from Baseline.
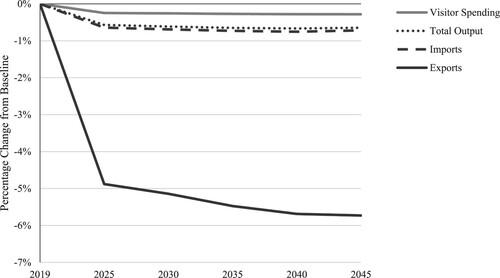
The carbon tax causes a reduction of total economic output of 0.6% in 2045 relative to the baseline and the contraction reduces the demand for imports.Footnote10 Non-tourism exports experience the largest relative impact with a decline of almost 5.0% in 2025 and 5.7% in 2045. The disproportionate impact occurs because prices of export goods rise relative to the price of goods produced outside of Hawai‘i, causing a loss of competitiveness for Hawai‘i’s non-tourism exports, such as cut flowers and other agricultural products. However, non-tourism exports comprise only a small portion (4%) of the Hawai‘i economy. Total visitor spending, Hawai‘i’s largest export, is estimated to decline by only 0.3% by 2045.Footnote11 Visitor spending changes only modestly due to inelastic demand for Hawai‘i vacations (Fuleky et al., Citation2014).
shows the share of carbon tax revenues paid by visitors, which increases from 27% in 2025 to 36% in 2045. The visitor share of total GHG emissions also increases over time because the emissions intensity of air travel is expected to decline less than that of other sectors, and the majority of emissions attributed to visitors comes from air travel.
Table 3. Share of Total Tax Revenue Paid by Visitors.
At the sector level, the carbon tax has the largest proportional impact in water (marine) transportation industries, with economic output falling by more than 17% in 2045 relative to the baseline. Water (marine) transportation encompasses interisland shipping as well as recreational/commercial activities, the largest decline in output coming from the latter. Petroleum manufacturing, the gas sector, and air transportation also decline substantially – falling by ten, eight, and seven percent, respectively, compared to the baseline in 2045. Output in the electricity sector, on the other hand, grows by two percent in 2045 as demand for power rises due to transportation becoming more electrified.
4.3 Household impacts: with and without dividend payments
The carbon tax affects households quite differently in each of the two scenarios.Footnote12 and display the change by quintile in household welfare of a carbon tax in the SCC with Equal-Share Dividends and SCC with Government Spending scenarios. Results are shown for disaggregated source-side and use-side welfare impacts, as well as net welfare. The net welfare change is the sum of the source-side and use-side welfare impacts.
Figure 6. Source-Side, Use-Side and Net Welfare Change from Baseline by Income Quintile (SCC with Equal-Share Dividends).
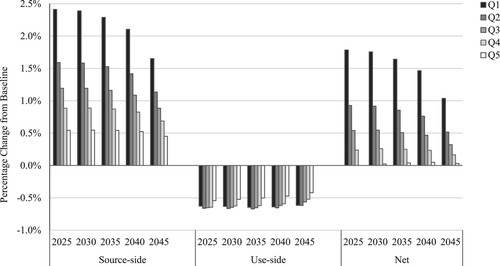
Figure 7. Source-Side, Use-Side and Net Welfare Change from Baseline by Income Quintile (SCC with Government Spending).
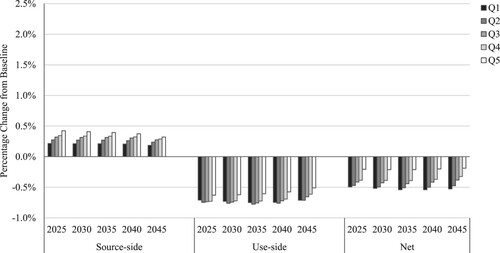
Similar to prior CGE analyses of carbon pricing that focus on distributional impacts, we find negative and regressive use-side impacts. However, unlike Beck et al. (Citation2015) and Goulder et al. (Citation2019), we find that source-side impacts are only progressive in the SCC with Equal-Share Dividends scenario. This is in part because the Hawai‘i economy has a relatively small manufacturing base. If source-side impacts are boosted by using carbon tax revenues to pay equal-share dividends, they become increasingly positive as well as progressive because the dividend represents a greater share of income for lower-income households. Moreover, we find that, in the case of Hawai‘i, the carbon tax scenario with equal-share dividends not only results in progressive changes in net welfare, but positive changes in net welfare across all household income groups. Goulder et al. (Citation2019) and Hafstead et al. (Citation2019) find that the lowest two income quintile households would have positive net welfare in their respective analyses for the United States and Vermont. Beck et al. (Citation2015) find that net welfare is progressive though negative across all household income groups for British Columbia. Sabine et al. (Citation2020) finds that revenue redistribution to the representative household in La Réunion was not enough to fully compensate for welfare loss.Footnote13 By contrast, we find that with a carbon tax set at the federal SCC, the average household in the lowest income quintile experiences a welfare gain of 1.8% in 2025 and 1.0% in 2045. Welfare gains are considerably smaller for the highest-income quintile, though still positive. Our finding is driven by the influential role of visitor spending in the Hawai‘i economy and visitor contributions to carbon tax revenues.Footnote14
5. Conclusion
Economists have argued for national carbon pricing to effectively address carbon emissions. With the lack of action by the US government, questions arise about the impacts of state-level implementation of carbon pricing. By modelling the impacts of a carbon tax in Hawai’i, our study informs ongoing discussions of regional carbon pricing, with implications beyond the Hawai’i context. First, our state-level CGE model could be adapted to evaluate proposals in other states with carbon pricing policies before their legislatures. The structure of H-CGE has particular relevance for other states with large tourism sectors possessing some market power, e.g. Nevada, Louisiana, and Alaska. The model also has relevance to other island economies that, like Hawai‘i, generate all of their own electricity and, because they are part of larger political federations, have limited ability to impose border adjustment taxes. US-affiliated examples include Guam, the Northern Mariana Islands, Puerto Rico, and American Samoa. For sovereign island nations – such as Jamaica, Sri Lanka, Tonga, and Fiji, the H-CGE model could be modified to impose relevant trade adjustments.
If Hawai‘i were to adopt a carbon tax at the level of the 2021 federal SCC, Hawai‘i’s cumulative emissions would decline by 10% over twenty years, over and above reductions from other policies already in place. In the absence of a national approach to address the global climate crisis, such state programmes could prove to be valuable demonstration projects that would help catalyze further climate action. This is important because our results strongly suggest that the goal of deep decarbonization is unlikely to be realized solely by the imposition of a carbon tax set at the SCC price by a state government. However, if more states adopt a carbon tax, then the likelihood increases that regional cooperation will emerge and facilitate the adoption of a common carbon price.Footnote15 Thus, state and regional actions to enact carbon pricing could pave the way to the adoption of a national programme.
Supplemental Material
Download MS Word (399.5 KB)Acknowledgements
We thank the University of Hawai‘i Economic Research Organization for additional project support. Three peer-review referees and the journal editor provided very helpful comments.
Disclosure statement
No potential conflict of interest was reported by the author(s).
Additional information
Funding
Notes
1 We use the SCC value with a 3% discount rate. The SCC is commonly used by researchers as an estimate for global GHG externality costs (Borenstein & Bushnell, Citation2021; Holland et al., Citation2021; Rennert et al., Citation2021). Several studies find that the federal SCC underestimates the social cost of greenhouse gas emissions. More comprehensive inclusion of expected environmental damages as well as incorporation of uncertainty yield substantially higher estimates (Bastien-Olvera & Moore, Citation2020; Cai et al., Citation2013; IPCC, Citation2014; Ricke et al., Citation2018).
2 A carbon price levied at the national level can address emissions leakage through a trade adjustment mechanism, whereas a state government is prohibited from imposing a trade adjustment mechanism on domestic and international trade (Fowlie & Reguant, Citation2022; Kaufman et al., Citation2020).
3 Murray and Rivers (Citation2015) and Metcalf (Citation2019) demonstrate that the British Columbia carbon tax reduced emissions by 5-15%. Bistline et al. (Citation2018) found substantial leakage of GHG emissions in the electric sector in provinces with carbon pricing programs, thus leaving room for a federal carbon tax to reduce leakage and overall emissions in Canada.
4 In the CGE analysis for Colorado, Hafstead (Citation2020) finds that a Colorado cap-and-trade program is more effective than sector-based policies and performs better when it is linked to multi-state carbon pricing programs such as the Western Climate Initiative. The CGE model does not incorporate distributional effects of costs and benefits by income group and does not allow for revenue recycling to households.
5 ‘Accommodations and restaurants’ is part of the ‘Other services’ category in .
6 Though we impose a national representation of the distribution of expenditures across income quintiles, the disaggregated data reflect Hawai‘i-specific spending patterns based on the initial representative household. For example, the data capture the higher expenditures on such goods as housing by Hawai‘i households relative to US households. We also use Goulder et al. (Citation2019)’s summary of the 2013 Survey of Consumer Finances to construct quintile-specific endowments for labor, capital and transfer income. See Appendix for details.
7 Customer-sited, grid-connected sources are counted in the numerator of the RPS target as renewable energy generation, but excluded from the denominator which reflects total sales. This results in the RPS target being larger than actual renewable energy generation.
8 This assumption is due to the Anti-Head Tax Act (49 U.S.C. § 40116), a federal statute regulating state taxation of the airline industry.
9 Relative to the SCC with Government Spending scenario, the SCC with Equal-Share Dividends scenario has a slight rebound in GHG emissions because of improved economic conditions (discussed below). The GHG increases are extremely small, amounting to 0.4% between 2025-2045.
10 In the SCC with Equal-Share Dividends scenario, total output is 0.2% higher in 2045 relative to the SCC with Government Spending scenario.
11 This analysis assumes a constant elasticity of substitution for travel to Hawai‘i versus all other goods of 0.25. See Fuleky et al. (Citation2014).
12 Our measurement of household welfare is based on equivalent variation, as described in Goulder et al. (Citation2019).
13 Using the Treasury Distribution Model, Horowitz et al. (Citation2017) conclude that a US carbon tax set at the federal SCC would decrease after-tax income for all household income groups, though the changes become progressive when dividends payments are made to households. Welfare analyses are sensitive to assumptions about the level of carbon tax rates.
14 Though outside the scope of our analysis, we posit that estimated welfare gains would be strengthened should carbon pricing change consumer perceptions of a Hawai‘i vacation. For example, tourists could perceive a Hawai‘i vacation to be a ‘green good’ and therefore a more desirable destination (Chan & Kotchen, Citation2014).
15 Nordhaus (Citation2015) discusses the formation of ‘climate clubs,’ both relevant to multi-region cap-and-trade and carbon tax regimes, and concludes that they can help to overcome free-riding problems in the establishment of more stringent GHG abatement programs. Without penalties for non-members, however, club arrangements are fragile and subject to defection by members.
16 Based on the I-O Table ($2012). Aviation and water transportation-related GHGs cover domestic sources only.
References
- Bastien-Olvera, B. A., & Moore, F. C. (2020). Use and non-use value of nature and the social cost of carbon. Nature Sustainability, 4(2), 101–108. https://doi.org/https://doi.org/10.1038/s41893-020-00615-0
- Beck, M., Rivers, N., Wigle, R., & Yonezawa, H. (2015). Carbon tax and revenue recycling: Impacts on households in British Columbia. Resource and Energy Economics, 41, 40–69. https://doi.org/https://doi.org/10.1016/j.reseneeco.2015.04.005
- Bistline, J., Hodson, E., Rossman, C., Creason, J., Murray, B. C., & Barron, A. R. (2018). Electric sector policy, technological change and US emissions reductions goals: Results from the EMF 32 model intercomparison project. Working Paper. Energy Modeling Forum, Stanford, CA.
- Bonham, C. S., & Gangnes, B. (1996). Intervention analysis with cointegrated time series: The case of the Hawai‘i hotel room tax. Applied Economics, 28(10), 1281–1293. https://doi.org/https://doi.org/10.1080/000368496327831
- Borenstein, S., & Bushnell, J. (2021). Headwinds and tailwinds: Implications of inefficient retail energy pricing for Energy substitution. National Bureau of Economic Research. Working Paper 29118.
- Bureau of Labor Statistics (BLS). (2019). Table 1101. Quintiles of income before taxes: Shares of annual aggregate expenditures and sources of income, Consumer Expenditure Survey, 2018. US Department of Labor.
- Burtraw, D., Sweeney, R., & Walls, M. (2009). The Incidence of US Climate policy: Alternative uses of revenues from a Cap-and-trade auction. National Tax Journal, 62(3), 497–518. https://doi.org/https://doi.org/10.17310/ntj.2009.3.09
- CADMUS. (2021). Rhode Island Carbon Pricing Study. http://www.energy.ri.gov/carbonpricingstudy/
- Cai, Y., Judd, K. L., & Lontzek, T. S. (2013). The social cost of stochastic and irreversible climate change. National Bureau of Economic Research. Working Paper 18704.
- Carattini, S., & Sen, S. (2019). Carbon Taxes and Stranded Assets: Evidence from Washington State. CESifo Working Paper No. 7785.
- Caron, J., Rausch, S., & Winchester, N. (2015). Leakage from sub-national climate policy: The case of California’s cap-and-trade program. Energy Journal, 36(2), 167–190. https://doi.org/https://doi.org/10.5547/01956574.36.2.8
- Chan, N. W., & Kotchen, M. J. (2014). A generalized impure public good and linear characteristics model of green consumption. Resource and Energy Economics, 37, 1–16. https://doi.org/https://doi.org/10.1016/j.reseneeco.2014.04.001
- ClimateXChange. (2021). State Climate Policy Network. States that have introduced carbon pricing legislation. https://climate-xchange.org/network/
- Department of Business, Economic Development and Tourism (DBEDT), State of Hawai‘i. (2016). Input-Output Study: 2012 Benchmark Report. Research and Economic Analysis Division. http://files.hawaii.gov/dbedt/economic/reports/IO/2012_state_io_study.pdf
- Department of Business, Economic Development and Tourism (DBEDT), State of Hawai‘i. (2018). Population and Economic Projections for the State of Hawaii to 2045. Research and Economic Analysis Division. https://files.hawaii.gov/dbedt/economic/data_reports/2045-long-range-forecast/2045-long-range-forecast.pdf
- Department of Business, Economic Development and Tourism (DBEDT), State of Hawai‘i. (2020). Outlook for the Economy, 3rd Quarter 2020 Report. https://dbedt.hawaii.gov/economic/qser/outlook-economy/
- Department of Business, Economic Development and Tourism (DBEDT), State of Hawai‘i. (2021). Monthly Energy Trends. http://dbedt.hawaii.gov/economic/energy-trends-2/
- Dissou, Y., & Siddiqui, M. (2014). Can carbon taxes be progressive? Energy Economics, 42, 88–100. https://doi.org/https://doi.org/10.1016/j.eneco.2013.11.010
- Farrell, N. (2017). What factors drive inequalities in carbon tax incidence? Decomposing socioeconomic inequalities in carbon tax incidence in Ireland. Ecological Economics, 142, 31–45. https://doi.org/https://doi.org/10.1016/j.ecolecon.2017.04.004
- Fowlie, M., & Reguant, M. (2022). Mitigating emissions leakage in incomplete carbon markets. Journal of the Association of Environmental and Resource Economists, 9(2), 307–343. https://doi.org/https://doi.org/10.1086/716765
- Fuleky, P., Zhao, Q., & Bonham, C. (2014). Estimating demand elasticities in non-stationary panels: The case of Hawai‘i tourism. Annals of Tourism Research, 44, 131–142. https://doi.org/https://doi.org/10.1016/j.annals.2013.09.006
- Goulder, L., Hafstead, M., GyuRim, K., & Long, X. (2019). Impacts of a carbon tax across US household income groups: What are the equity-efficiency trade-offs? Journal of Public Economics, 175, 44–64. https://doi.org/https://doi.org/10.1016/j.jpubeco.2019.04.002
- Hafstead, M. (2020). Decarbonizing Colorado: Evaluating Cap and Trade Programs to Meet Colorado’s Emissions Targets. Resources for the Future. https://media.rff.org/documents/Decarbonizing_Colorado_-_RFF_Report.pdf
- Hafstead, M., Look, W., Keyes, A., Linn, J., Burtraw, D., & Williams III, R. (2019). An Analysis of Decarbonization Methods in Vermont. https://ljfo.vermont.gov/assets/Uploads/f7d068947e/DecarbonizationMethodsVT_Report_7.pdf
- Hassett, K., Mathur, A., & Metcalf, G. (2009). The Incidence of a US carbon Tax: A lifetime and regional analysis. Energy Journal, 30(2), 155–177. https://doi.org/https://doi.org/10.5547/ISSN0195-6574-EJ-Vol30-No2-8
- Hawai‘i Revised Statutes (HRS). (2018). HRS §225P-5, Zero Emissions Clean Economy Target.
- Hawai‘i Tourism Authority (HTA). (2020). Hawai‘i Visitor Statistics Released for 2019, HTA Release (20-03). https://www.hawaiitourismauthority.org/news/news-releases/2020/hawai-i-visitor-statistics-released-for-2019/
- Hawaiian Electric. (2020). Forecast Assumptions Working Group Documents. IGP EoT Forecast. https://www.hawaiianelectric.com/clean-energy-hawaii/integrated-grid-planning/stakeholder-engagement/working-groups/forecast-assumptions-documents
- Holland, S., Mansur, E., Muller, N., & Yates, A. (2021). The environmental benefits of transportation electrification: Urban buses. Energy Policy, 148(11921), 1–10. https://doi.org/https://doi.org/10.1016/j.enpol.2020.111921
- Horowitz, J., Cronin, J., Hawkins, H., Konda, L., & Yuskavage, A. (2017). Methodology for Analyzing a Carbon Tax. Office of Tax Analysis, US Treasury Dept. Working Paper 115.
- ICF and University of Hawai‘i Economic Research Organization (UHERO). (2019). Hawai‘i Greenhouse Gas Emissions Report for 2016. https://health.hawaii.gov/cab/files/2019/12/2016-Inventory_Final-Report_December2019-1.pdf
- Interagency Working Group on Social Cost of Greenhouse Gases, US Government. (2021). Technical Support Document: Social Cost of Carbon, Methane, and Nitrous Oxide Interim Estimates under Executive Order 13990. February 2021. https://www.whitehouse.gov/wp-content/uploads/2021/02/TechnicalSupportDocument_SocialCostofCarbonMethaneNitrousOxide.pdf
- Intergovernmental Panel on Climate Change (IPCC). (2014). Climate Change 2014: Synthesis report. In Core Writing Team, R. K. Pachauri, & L. A. Meyer (Eds.), Contribution of working groups I, II and III to the fifth assessment report of the intergovernmental panel on climate change (p. 79). IPCC.
- Kaufman, N., Larsen, J., King, B., & Marsters, P. (2020). Output-based rebates: An alternative to border carbon adjustments for preserving US competitiveness. Columbia-SIPA Center on Global Energy Policy and Rhodium Group.
- Konan, D., & Chan, H. L. (2010). Greenhouse gas emissions in Hawai‘i: household and visitor expenditure analysis. Energy Economics, 32(1), 210–219. https://doi.org/https://doi.org/10.1016/j.eneco.2009.06.015
- Liu, J. H., & Renfro, J. (2013). Carbon tax and shift: How to make it work for Oregon’s economy. Northwest Economic Research Center (NERC). Portland State University, College of Urban and Public Affairs.
- Liu, J. H., Renfro, J., Butenhoff, C., Paruszkiewicz, M., & Rice, A. (2014). Economic and emissions impacts of a clean air tax or fee in Oregon (SB306). Northwest Economic Research Center (NERC). Portland State University, College of Urban and Public Affairs.
- Metcalf, G. (2021). Carbon taxes in theory and practice. Annual Review of Resource Economics, 13(1), 245–265. https://doi.org/https://doi.org/10.1146/annurev-resource-102519-113630
- Metcalf, G., Paltsev, S., Reilly, J., Jacoby, H., & Holak, J. (2008). Analysis of US greenhouse gas tax proposals. MIT joint program on the science and policy of global change, Report No. 160.
- Mori, K. (2012). Modeling the impact of a carbon tax: A trial analysis for Washington state. Energy Policy, 48, 627–639. https://doi.org/https://doi.org/10.1016/j.enpol.2012.05.067
- Murray, B., & Rivers, N. (2015). British Columbia's revenue-neutral carbon tax: A review of the latest “grand experiment” in environmental policy. Energy Policy, 86, 674–683. https://doi.org/https://doi.org/10.1016/j.enpol.2015.08.011
- Newell, R., & Pizer, W. (2003). Regulating stock externalities under uncertainty. Journal of Environmental Economics and Management, 45(2), 416–432. https://doi.org/https://doi.org/10.1016/S0095-0696(02)00016-5
- Nordhaus, W. (2007). To tax or not to tax: Alternative approaches to slowing global warming. Review of Environmental Economics and Policy, 1(1), 26–44. https://doi.org/https://doi.org/10.1093/reep/rem008
- Nordhaus, W. (2015). Climate clubs: overcoming free-riding in international climate policy. American Economic Review, 105(4), 1339–1370. https://doi.org/https://doi.org/10.1257/aer.15000001
- Public Utilities Commission (PUC), State of Hawai‘i. (2016). Docket No. 2014-0183. Instituting a Proceeding to Review the Power Supply Improvement Plan. PSIP Update Report filed on December 23, 2016. https://dms.puc.hawaii.gov/dms/
- Public Utilities Commission (PUC), State of Hawai‘i. (2019). Docket No. 2007-0008. Renewable Portfolio Standards (RPS) 2018 Annual Report. https://puc.hawaii.gov/reports/energy-reports/renewable-portfolio-standards-rps-annual-reports/
- Public Utilities Commission (PUC), State of Hawai‘i. (2021). Docket No. 2021-0024. Opening a Proceeding to Review Hawaiian Electric’s Interconnection Process and Transition Plans for Retirement of Fossil Fuel Power Plants Initial Status Update. Letter filed by Hawaiian Electric on March 5, 2021. State of Hawai‘i. https://dms.puc.hawaii.gov/dms/DocumentViewer?pid=A1001001A21C08B12124A00897
- Rausch, S., Metcalf, G. E., Reilly, J. M., & Paltsev, S. (2011). Distributional impacts of a US greenhouse gas policy: A general equilibrium analysis of carbon pricing. In G. E. Metcalf (Ed.), US Energy tax policy. Cambridge University Press.
- Regional Greenhouse Gas Initiative (RGGI). (2019). Allowance Prices and Volumes. https://www.rggi.org/auctions/auction-results/prices-volumes
- Rennert, K., Prest, B., Pizer, W., Newell, R., Anthoff, D., Kingdon, C., Rennels, L., Cooke, R., Raftery, A., Ševčíková, H., & Errickson, F. (2021). The Social Cost of Carbon: Advances in Long-Term Probabilistic Projections of Population, GDP, Emissions, and Discount Rates. Resources for the Future. https://media.rff.org/documents/WP_21-28_5q5itXP.pdf
- Ricke, K., Drouet, L., Caldeira, K., & Tavoni, M. (2018). Country-level social cost of carbon. Nature Climate Change, 8(10), 895–900. https://doi.org/https://doi.org/10.1038/s41558-018-0282-y
- Rogelj, J., Shindell, D., Jiang, K., Fifita, S., Forster, P., Ginzburg, V., Handa, C., Kheshgi, H., Kobayashi, S., Kriegler, E., Mundaca, L., Séférian, R., & Vilariño, M. V. (2018). Mitigation pathways compatible with 1.5°C in the context of sustainable development. In: V. Masson-Delmotte, P. Zhai, H. -O. Pörtner, D. Roberts, J. Skea, P. R. Shukla, A. Pirani, W. Moufouma-Okia, C. Péan, R. Pidcock, S. Connors, J. B. R. Matthews, Y. Chen, X. Zhou, M. I. Gomis, E. Lonnoy, T. Maycock, M. Tignor, and T. Waterfield (eds.), Global warming of 1.5°C. An IPCC special report on the impacts of global warming of 1.5°C above pre-industrial levels and related global greenhouse gas emission pathways, in the context of strengthening the global response to the threat of climate change, sustainable development, and efforts to eradicate poverty (p. 95). In Press.
- Sabine, G., Avotra, N., Olivia, R., & Sandrine, S. (2020). A macroeconomic evaluation of a carbon tax in overseas territories: A CGE model for Reunion Island. Energy Policy, 147, 674–683. https://doi.org/https://doi.org/10.1016/j.enpol.2020.111738
- Sajeewani, D., Siriwardana, M., & McNeill, J. (2015). Household distributional and revenue recycling effects of the carbon price in Australia. Climate Change Economics, 6(3), 1–23. https://doi.org/https://doi.org/10.1142/S2010007815500128
- University of Hawaii Economic Research Organization (UHERO). (2020). Real Gross Domestic Product, 1965-2019 and Total Visitor Arrivals, 1965-2020. https://data.uhero.hawaii.edu
- University of Hawaii Economic Research Organization (UHERO). (2021). UHERO Forecast for the State of Hawaii: Delta Wave Swamps Tourism but Return to Recovery Expected. https://uhero.hawaii.edu/wp-content/uploads/2020/09/20Q3_Public.pdf
- US Energy Information Administration (EIA). (2020a). Form EIA 923. https://www.eia.gov/electricity/data/eia923/
- US Energy Information Administration (EIA). (2020b). Annual Energy Outlook 2020. Reference Case. https://www.eia.gov/outlooks/aeo/tables_ref.php
- US Environmental Protection Agency (EPA). (2016). Technical Support Document: Technical Update of the Social Cost of Carbon for Regulatory Impact Analysis Under Executive Order 12866. https://19january2017snapshot.epa.gov/sites/production/files/2016-12/documents/sc_co2_tsd_august_2016.pdf
- Wang, Q., Hubacek, K., Feng, K., & Yi-Ming Wei, Q. (2016). Distributional effects of carbon taxation. Applied Energy, 184, 1123–1131. https://doi.org/https://doi.org/10.1016/j.apenergy.2016.06.083
- Washington State Legislature. Reg. Sess. (2021). Washington Climate Commitment Act, SB 5126 - 2021-22.
- Western Climate Initiative (WCI). (2022). WCI Participating Jurisdictions Overview. https://wcitestbucket.s3.us-east-2.amazonaws.com/amazon-s3-bucket/participatingjurisdiction-comparativetable-en.pdf
- Williams, R., Gordon, H., Burtraw, D., Carbone, J., & Morgenstern, R. (2015). The initial incidence of a carbon tax across income groups. National Tax Journal, 68(1), 195–214. https://doi.org/https://doi.org/10.17310/ntj.2015.1.09
- The World Bank. (2021). State and trends of carbon pricing 2021. World Bank.
- Yuan, M., Metcalf, G., Reilley, J., & Paltsev, S. (2017). The Revenue Implications of a Carbon Tax. MIT Joint Program, Global Change, Report 316.