
 ?Mathematical formulae have been encoded as MathML and are displayed in this HTML version using MathJax in order to improve their display. Uncheck the box to turn MathJax off. This feature requires Javascript. Click on a formula to zoom.
ABSTRACT
Many economies, especially in Asia, implement different policies to incentivize the issuance of corporate green bonds. However, there is a lack of empirical evidence on the effectiveness of green bond policies. This study examines the impact of a broad range of green bond policies on the issuance of corporate green bonds in 56 green-bond-issuing economies, including 11 economies in Asia, from January 2010 to June 2020. Using the difference-in-difference specification within the multilevel probit model, the study shows that the following policies increase the probability of issuance of green bonds by corporates: (i) policies that reduce the cost of green bond issuance, such as green bond grants and tax incentives (such policies are particularly popular in Asia); (ii) coordination policies such as the establishment of green bond or green finance institutions, committees, groups, as well as other policy signals such as national commitments and targets; and (iii) global international cooperation and international standardization.
Key policy insights
Policies that reduce the cost of green bond issuance, such as green bond grants and tax incentives, incentivize the issuance of corporate green bonds.
Coordination policies, such as the establishment of green bond or green finance institutions, committees, groups, as well as other policy signals, such as national commitments and targets, incentivize the issuance of corporate green bonds.
Global international cooperation and standardization incentivize corporate green bond issuance.
1. Introduction
Urgent actions are necessary to limit global warming, to reduce climate hazards and risks to ecosystems and humans (IPCC, Citation2022). This requires substantial investments in climate change mitigation and adaptation. The IPCC report (Citation2018) highlights the need to scale up resources to address climate change over the next few decades both in developed and developing countries. Financial instruments, such as green bonds, could play a large role in unlocking investment in green projects.
Green bonds are defined as ‘fixed income instruments for which the proceeds will be applied entirely towards green projects or activities that promote climate change mitigation, adaptation or other environmentally sustainable purposes’ (Shurey, Citation2018). The first green bonds were issued by the European Investment Bank in 2007 as ‘climate awareness bonds,’ the proceeds of which are used to fund projects in climate change mitigation and adaptation. The key guidelines regarding the use of green bond proceeds are summarized in the Green Bond Principles (GBP) by the International Capital Markets Association (ICMA, Citation2021) and involve four requirements for alignment with ICMA's GBP.
The first requirement is the use of proceeds. It differentiates green bonds from other bonds, through the investment of the proceeds only in green projects, such as climate change mitigation and adaptation, and natural resource conservation. The second requirement is the project evaluation and selection. To make the project evaluation credible, national green bond guidelines recommend reviews by external expert agencies. That serves as a validity check for potential investors, as some investors, including pension funds, may not have the mandate to invest in bonds that are not subjected to external evaluation. The third requirement is the management of proceeds. Since the proceeds from green bonds ought to be used for specific purposes, their monitoring is instrumental from the time of their receipt until the project realization. Further, the project revenues and investors’ returns are subjected to tracking and monitoring to ensure complete transparency. Through the fourth requirement, reporting, issuers list the projects funded using proceeds from green bonds and their expected environmental impact. To ensure transparency, the guidelines suggest true, fair, and standardized reporting of all project parameters.
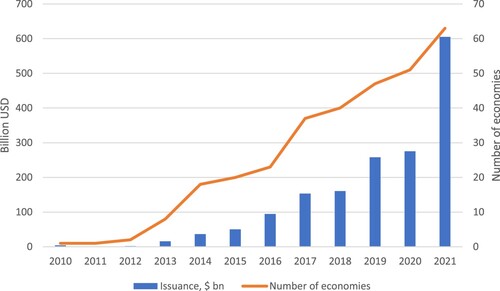
Green bonds are gaining popularity in both developed and developing economies. The global issuance of green bonds increased from $4 bn in 2010 to $282 bn in 2020, and $620 bn in 2021 (Bloomberg, Citation2022). The People’s Republic of China (PRC), Germany, the US, France, and the UK (in descending order) represent 50% of the global issuance in 2021, with green bond issuance of the above countries ranging from $40 bn to $87 bn (Bloomberg, Citation2022). However, despite the boom in the green bond market, the share of green bonds remains small at 0.75% of the global bond market in 2021 (Bloomberg, Citation2022).
The green bond market has low liquidity due to the limited supply of green bonds, lack of a credit risk profile, high transaction costsFootnote1, and adverse selection costs (Febi et al., Citation2018; Lin et al., Citation2012). The barriers to green bond issuance, such as a lack of harmonized global standards, high issuance and transaction costs, and lack of internal capacity to manage the green bond process, could be reduced with policy measures aiming to standardize the green bond market and provide a pipeline of projects (Banga, Citation2019; Deschryver & de Mariz, Citation2020; Ng, Citation2018).
The costs associated with green bond issuance can be significant, therefore, some countries provide subsidies, grants, tax deductions (Azhgaliyeva, Citation2020). In particular, such policies are designed to reduce the costs of external review, the costs of credit rating, credit costs, and other costs related to green bond issuance, or provide tax deductions for issuance costs (Azhgaliyeva & Liddle, Citation2020). For instance, Singapore’s Green Bond Grant Scheme reimburses the external review expenses up to SGD100,000 (USD 75,637)Footnote2 (Azhgaliyeva et al., Citation2020).
Governments realize the importance of raising green finance through the provision of policy support. The literature has not determined the extent to which these policies have a positive effect on the issuance of green bonds, to the best of the authors’ knowledge. Our study attempts to fill this void in the literature by providing empirical evidence and evidence-based policy recommendations for promoting green bonds.
This study pursues two objectives. First, it provides an overview of the green bond market development globally and in Asia. Second, using sector/country-level data on corporate green bonds, it examines the effectiveness of policy support in promoting corporate green bond issuance globally and in Asia. We distinguish between three types of policy instruments aiming to promote green bonds: (i) national, (ii) regional, and (iii) global. National policies include national standardization of green bonds, that is, (ia) green bond guidelines, standards, frameworks, and principles; (ib) policies reducing the cost of labelling bonds as ‘green,’ that is, green bond grants and tax incentives; and (ic) other national policies: coordination, such as the establishment of green bond or green finance institutions, committees, groups and/or other policy signals, such as national commitments and targets. Regional green bond policies include regional cooperation and standardization, such as EU and ASEAN policies. Global instruments represent global cooperation and international standards and guidelines, such as the ICMA’s GBP. National policies are binary variables, while regional and national variables count the number of policies implemented. The full list of policies is available from the Climate Bond Initiative’s Green Bond Policy Dataset.
This paper documents the effects of green bond policy instruments in 56 green-bond-issuing economies, including 11 economies in Asia, from January 2010 to June 2020. Using the difference-in-difference (DID) specification within the multilevel probit model, this paper studies the impact of green bond policies on the issuance of green bonds by corporates.
The remaining of the paper is structured as follows. Section 2 describes green bond policies. Section 3 discusses the data. Section 4 discusses the methodology. Section 5 presents the key findings. Section 6 concludes and provides policy recommendations.
2. Green bond policy
presents global, regional, and national green bond policies. Global policies include global international cooperation and internationally recognized voluntary green bond guidelines. Internationally recognized guidelines encourage more transparency and standardization to bring more credibility and hence promote green bonds. The standards include ICMA’s GBP and Climate Bond Initiative’s Climate Bonds Standards. Countries either accept internationally recognized guidelines or set their national standards, which are conventionally based on internationally recognized guidelines.
Figure 1. Green Bond Policies. Source: Authors’ own using the framework’s structure developed by the Climate Bonds Initiative (Citation2021) Green Bond Policy database.
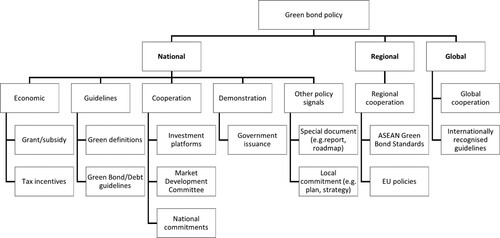
Regional standards include voluntary ASEAN green bond standards and the EU green bond standards. The ASEAN green bond standards are based on the ICMA’s GBP. However, they are more specific regarding how GBP should be applied for green bonds to be labelled as ASEAN green bonds. For the green bonds to be labelled as ASEAN green bonds they should demonstrate compliance with the ASEAN green bond standards. Likewise, for the projects to be labelled as the EU green bonds they should be aligned with the EU taxonomy.
Green bond guidelines are a widely used instrument and were first designed to reduce the extent of barriers related to the lack of definition of green bonds (OECD, Citation2015; Berensmann et al., Citation2016). ICMA’s GBP provide key guidelines related to the use of bond proceeds to fund green projects. Some countries develop their own national green bond guidelines that represent a set of voluntary instructions generally issued by the Central Bank or the Capital Market Regulator of the country in an attempt to standardize the market of green bonds.
The costs of green bond issuance can be substantial, and therefore, some countries adopt policies to reduce the costs associated with green bond issuances through policy instruments, such as subsidies/grants, and tax incentives. Such policies reduce the costs of external review, costs of credit rating, credit costs, issuance costs, and other costs associated with green bonds (Azhgaliyeva et al., Citation2020). For instance, Singapore launched the Green Bond Grant Scheme in June 2017, with external review expenses of up to SG$100,000 (US$75,637)Footnote3 for the green bonds with a minimum issue size of SG$200 million (US$151 million) and with a minimum tenure of three years issued in Singapore and listed on Singapore stock exchange shall be reimbursed to the issuer. Japan’s Financial Support Programme for Green Bond Issuance provides a subsidy for expenses incurred in external review for an amount of up to JPY 50 million (USD$0.5 million).Footnote4
Malaysia launched the Green Technology Financing Scheme in 2010 to encourage local companies and entrepreneurs to engage in green technology-based projects by providing a government guarantee of 60% of the green cost of the entire cost financed with a budget of RM 5 billion until 2022 (US$1.2 billion).Footnote5 The financing of US$1 billion across 319 projects has been funded by 28 participating financial institutions. In May 2018, the government extended this scheme for a further period of 5 years and has made it more attractive for financing through green bonds by providing a 100% credit guarantee from the government (against the limit of 60% for other forms of funding). Hong Kong’s Pilot Bond Grant Scheme also covers the legal fees and arrangement fees, which are reimbursed similarly to the costs of external review.
In the US, Qualified Energy Conservation Bonds (QECBs) and Clean Renewable Energy Bonds (CREBs) provide tax incentives.Footnote6 Chile offers foreign institutional investors tax exemption on all bonds. In Brazil, tax-free bonds can be issued by wind farm developers.Footnote7
Other instruments that aim to promote green bond issuance include cooperation and government demonstration. Cooperation occurs mainly through the establishment of green bonds or green finance institutions, committees, groups, etc. Such activities enable a flow of capital to sustainable energy and promote green bond market development. For instance, governments in the Datong and Quzhou regions in the People’s Republic of China established a green finance coordination group and a green finance steering group respectively to promote green bonds market development. The UK government and the City of London announced the establishment of a Green Finance Institute in 2018 to unlock barriers and scale up capital for building a net-zero carbon economy. Likewise, India established the Green Bonds Council in 2016 to promote green bonds market development and capital market flows into clean energy.
The government demonstration represents the issuance of green bonds by city municipals, development banks, and governments (sovereign green bonds) to provide initial market product pipelines and liquidity, engage investors, and educate them about green bonds (Climate Bond Initiative, Citation2022). For instance, Indonesia issued the green sovereign sukukFootnote8 in 2018 to finance green projects, to build and expand the green sukuk market. Fiji issued sovereign green bonds in 2017 to mobilize private sector capital for green projects (World Bank, Citation2017).
Other policy signals include special documents and local commitments to promote green bond market development. For instance, the People’s Republic of China is sending strong policy signals through developing guidelines to establish the green financial system, guidelines to support green bonds development, opinions on creating a green financial system, a three-year action plan for the development of the financial centre. Such policy signals are important to trigger market development for green bonds, issuance of green bonds, and increase the flow of capital to green projects. Other countries in Asia are also developing strategic documents to support green bond market development. Indonesia, through the Roadmap for Sustainable Finance, discusses the measures needed to support the supply, the demand of sustainable finance and to increase the coordination of sustainable finance implementation (Indonesian Financial Services Authority, Citation2014). The full list of policies is available from the Climate Bond Initiative’s (Citation2021) Green Bond Policy Dataset.
3. Green bond data and market overview
3.1. Data
We use data from 56 economies, including 11 economies from Asia (Appendix A), which issued green bonds over the period January 2010 to June 2020. We structure the data () across three levels: economy, sector, and period (months) (). Sectors follow the classification of the Bloomberg Industry Classification System (BICS) (Table B1 and Figure B1 in Appendix B).
Figure 2. Multi-level Data Structure.
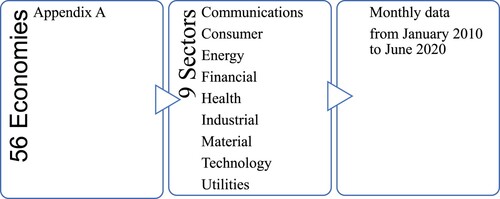
Table 1. Data description and sources.
Green bonds are defined as those with a ‘Green Investment Indicator’, which indicates that the proceeds of bonds will be applied toward green projects or activities that promote climate change mitigation or adaptation, or other environmental sustainability purposes (Bloomberg, Citation2020). We apply the ‘use of proceeds’ filter, which means that bond proceeds will be designated for green projects based on ICMA’s (2017) GBP, including (but not limited to) renewable energy, energy-smart technologies, energy efficiency, green buildings and infrastructure, clean transportation, sustainable water management, agriculture and forestry, pollution prevention and control, terrestrial and aquatic biodiversity conservation, climate change adaptation, eco-efficient products, and production technologies and processes (Shurey, Citation2018). Bloomberg includes only those green bonds, which bond term sheets and prospectus demonstrate that 100% of proceeds will be used to finance or re-finance green projects listed in ICMA (2017). As an additional measure, Bloomberg also collects external reviews, such as second-and third-party opinions, green bond audits, and green bond ratings (BloombergNEF, Citation2015).
Data includes bonds issued by corporates (corporates and financial institutions) and by government, including national, regional, and local governments (i.e. sovereigns, government agencies, regional government, local government, government development banks, and central banks). Corporate issuers are from nine sectors ().
Green bond policy data are obtained mainly from the Climate Bond Initiative’s (Citation2021) Green Bond Policy dataset. This database is a repository of green bond policies from around the globe and is publicly available. The description of this dataset is available in the framework’s structure developed by the Climate Bonds Initiative (Citation2020). Green bond policy data are the monthly data of each green bond policy implemented across countries, regions, and globally. The green bond policies dataset includes only policies that aim directly to promote green bonds, and excludes policies that can affect green bonds only indirectly, such as the promotion of renewable energy, energy efficiency, electric mobility, emission reduction, and other environmental policies.
provides summary statistics. The issuance of corporate green bonds (as a share of corporate bonds) increased over time in both the global sample and in Asia, as well as across sectors ( and ). The coefficients of correlation across independent variables (conventional bonds, sovereign bonds, and policies) are very small and significant only at a 10% level of significance (Table B2).
Figure 3. Issuance of corporate green bonds in Asia. Source: Authors, using data from Bloomberg (Citation2020).
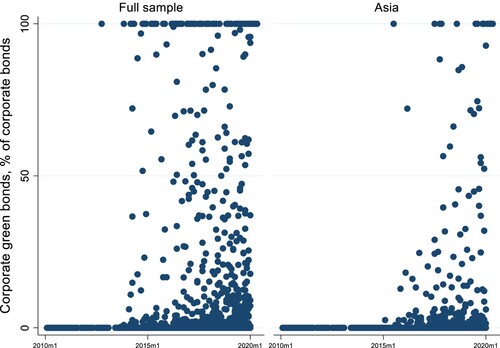
Figure 4. Issuance of corporate green bonds by sector. Source: Authors, using data from Bloomberg (Citation2020).
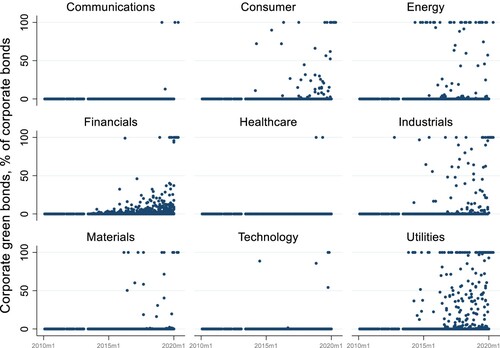
Table 2. Summary statistics.
3.2. Overview of the Green Bond Market
The issuance of green bonds has been very rapid (). The boom in the green bond market is especially marked since 2013, when bond issuance increased 45 times, mostly because France and Norway scaled up their green bond issuance significantly. In the following years, up to 2019, the issuance of green bonds continued to grow primarily due to the major bond-issuing economies’ soaring green bond issuance and the growing number of green-bond-issuing economies. The pace of growth was slower in 2018 due to the shift to social bonds (SP, Citation2019) and in 2020 due to the COVID-19 crisis.Footnote10 In 2021, green bond issuance recovered and doubled compared to 2020 ().
Figure 5. Global Green Bond Issuance. Source: Authors, using data from Bloomberg (Citation2022).
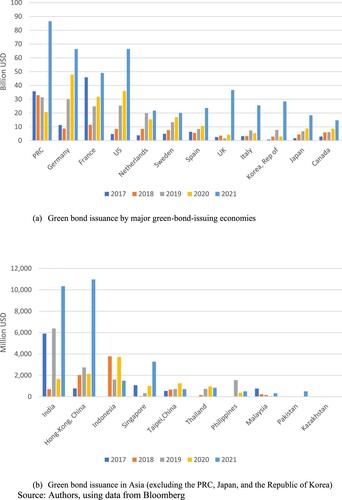
shows major trends in the geographical representations of the global green bond market across the major green-bond-issuing economies ((a)) and the rest of Asia ((b)). The People’s Republic of China (PRC), Germany, France, the US, and the Netherlands are the largest green-bond-issuing nations over the period 2017–2021, followed mainly by the European economies, the UK, and two Asian economies, Japan and the Republic of Korea. In the rest of Asia, India; Hong Kong, China; Indonesia; and Singapore are the regional leaders over the period 2017-2021.
Figure 6. Green Bond Issuance by Economies. (a) Green bond issuance by major green-bond-issuing economies. (b) Green bond issuance in Asia (excluding the PRC, Japan, and the Republic of Korea). Source: Authors, using data from Bloomberg (Citation2022).
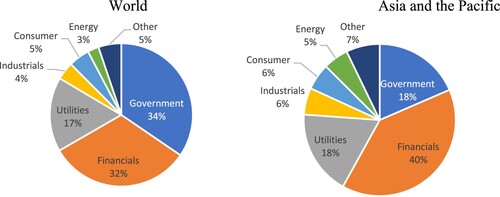
shows the sectoral distribution of green bond issuance separately for the world and Asia and the Pacific region from 2017-2021. Globally, the major issuers are governments (34%), financial entities (32%), and utilities (17%). Surprisingly, the energy sector has issued only 3% of green bonds. In Asia and the Pacific, financial entities are the main issuers (40%), followed by governments (18%) and utilities (18%). Similarly, the share of the energy sector in the issuance of green bonds is relatively small (5%).
Figure 7. Issuance of Green Bonds by Sector (2017–2021). Source: Authors, using data from Bloomberg (Citation2022).
4. Methodology
Our data consist of three levels, with 56 economies at the first level, 11 sectors at the second level and vary across 126 months from January 2010 to June 2020 at the third level. Corporate green bonds are not issued every month in every sector/country, therefore, the data contains many zero values. Given that corporate green bond issuances are clustered across sectors and economies, we apply a multilevel probit model to accommodate for a clustered nature of the binary dependent variable and account for cross-economy/-sector and longitudinal effects (Laird & Fitzmaurice, Citation2013; Skrondal & Rabe-Hesketh, Citation2008). To estimate the effects of the policies, we use a difference-in-difference (DID) specification. The baseline multilevel probit model with random-intercepts has the following specification:
(1)
(1) where
indexes economies,
indexes sectors, and
indexes months;
is a binary variable which equals one if the value of green bonds issued by corporates is greater than zero and zero otherwise; NGB is a value of conventional bonds (billion $), excluding green bonds, issued by corporates; GBs is a value of sovereign green bonds (billion $), Asia is a binary variable which equals 1 if a country is located in Asia (Appendix A) and zero otherwise; Policy is a set of five green bond policy variables, i.e. grants and taxes (binary), guidelines (binary), coordination and other policy signals (binary), regional (count of policies), and global (count of policies) cooperation and standardization;
is an interaction term of Asia with five Policy variables. J, I,and, T consist of a set of sector, economy, and time (respectively) control variables.
are random intercepts.
, and
are assumed to have zero means, are normally distributed and are mutually uncorrelated (Skrondal & Rabe-Hesketh, Citation2008).
DID is usually implemented as an interaction term between the treatment group and intervention time-variable in a regression model (Gertler et al., Citation2016). Our main focus is on the interaction term: . Asia identifies a treatment group; policy identifies the post-intervention period of green bond policies. National green bond policies are binary variables that equal 1 if an economy implemented respective green bond policies and 0 otherwise. Regional green bond policies are a count variable that equals the number of regional green policies in force in a region where an economy is located. These regional green bond policies affect economies located in two regions: the EU and the Association of Southeast Asian Nations (ASEAN). Global green bond policies are a count variable that measures the number of policies implemented globally.
measures the effect of five green bond policies in Asia.
5. Empirical results
The results of the multilevel probit models are presented in . The results of the impact of green bond policies are consistent, pointing toward the robustness of the impact of green bond policies.
Table 3. Results.
Green bond policies, including national (except for national guidelines and regional policies) and global policies, are associated with a positive impact on green bond issuance.
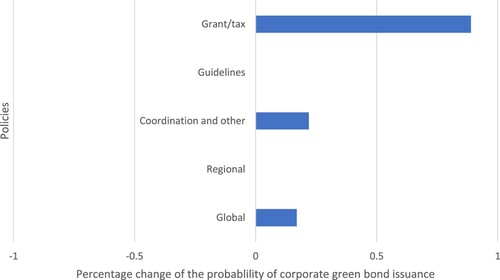
Green bond grant and tax incentives have the largest impact among all policies. They are associated with a greater probability of issuing green bonds. Grants and tax incentives aim to reduce the cost of issuing green bonds, thus, promoting their issuance, which is consistent with the existing literature (Azhgaliyeva et al., Citation2020; Febi et al., Citation2018; Lin et al., Citation2012). This shows the importance of government support and the need for policies that reduce the costs of green bond issuance.
Coordination and other policy signals on average increase the probability of the issuance of corporate green bonds, which implies that corporates are more likely to issue green bonds when a country has clear coordination or policy signals, for example, if the country established green bond/finance institutions, groups, committees, or set national targets.
Global cooperation and standardization have a positive effect on the probability of issuing corporate green bonds. Surprisingly, regional cooperation and standardization in the EU and ASEAN has no significant effect on the probability of issuing corporate green bonds. The former results are aligned with the literature (Banga, Citation2019; Deschryver & de Mariz, Citation2020; Ng, Citation2018), which also recommends global and regional coordination and standardization for promoting green bonds.
The issuance of sovereign green bonds does not have a significant impact on the issuance of corporate green bonds. We could not find the evidence that issuance of green bonds by governments incentivizes the issuance of green bonds by corporates. Surprisingly, this result is at odds with the literature (Climate Bond Initiative, Citation2022).
Conventional bond issuance increases the probability of issuing corporate green bonds. This implies that larger conventional bond issuing sectors/countries are more likely to issue green bonds. This could be because they have more resources (including human resources); expertise; experience to issue green bonds; strong local currency; more corporates with good risk rating; etc.
summarizes the impacts of national, regional, and global policies on the issuance of green bonds, based on the results from .
Figure 8. Impact of Green Bond Policies on Green Bond Issuance.
While our findings provide conclusions regarding the effectiveness of policies to promote corporate green bond issuance, studying green bond issuance merits further research. As noted in Section 2, real sector policies promoting green projects (such as renewable energy, energy and water efficiency, green buildings, and clean transport), as well as reducing green technology costs, affect green bonds indirectly by making green projects more attractive for investing (Kapoor et al., Citation2020; Ng and Tao Citation2016). Such policies were not included in our empirical model because, currently, it is difficult to distinguish bonds by project type, which is needed to assess the impact of policies on respective green projects. The issuing sector is not a good predictor for the project type. For example, banks and governments can issue green bonds for financing various green projects.
Future research could take into account policies promoting demand for green bonds, and the environmental impact of green bonds. Further, the rating of green bonds based on their environmental impact is not widely spread and also not consistent. Green bond reviewing agents (external reviewers) which evaluate green bonds rate green bonds based on own rating scheme. For example, CICERO rates green bonds using shades of green as dark green, medium green and light green; while RAM sustainability rates green bonds as Tier 1 (larger environmental benefit), Tier 2, and Tier 3 (smaller environmental benefit). Studying such questions merit special attention.
6. Conclusion and policy recommendations
The green bond market is surging; however, its share in the total bond market remains small. This study uncovers the extent to which the green bond policies are effective in incentivizing corporates to issue green bonds. Recently, green bond policies, such as national green bond guidelines/standards and green bond grant schemes, have become popular. The impact of these policies has not been studied empirically across economies, and our study sheds light on this issue.
This paper fills the gap in the literature by providing empirical evidence on the impact of green bond policies on the issuance of corporate green bonds. For our study, we used monthly data on green bond issuance from 56 economies from January 2010 to June 2020 and applied multilevel probit models with a DID specification to estimate the impact of green bond policies on the likelihood of green bond issuance by corporates.
The empirical evidence suggests that governments should consider national and global green bond policies, that is, the provision of policies that reduce the cost of green bond issuance, such as green bond grants and tax incentives; national coordination and other policy signals; and global cooperation and standardization, to incentivize corporate green bond issuance.
Acknowledgements
The authors are grateful to Peter J. Morgan, Shu Tian, and other participants at the Session: Green Finance of the ADB Economists’ Forum on 12–13 January 2021; Ivan Diaz-Rainey and other participants at the 1st CEFGroup Climate Finance Symposium on 3–4 December 2020; Marek Weretka and three anonymous reviewers for comments on the earlier version of the paper. The views expressed in this paper are the views of the authors and do not necessarily reflect the views or policies of the Asian Development Bank Institute (ADBI), the Asian Development Bank (ADB), its Board of Directors, or the governments they represent. ADBI does not guarantee the accuracy of the data included in this paper and accepts no responsibility for any consequences of their use. Terminology used may not necessarily be consistent with ADB official terms
Disclosure statement
No potential conflict of interest was reported by the author(s).
Notes
1 The transaction costs range from $10,000 to $100,000, including the costs of green label certification and other documents related to verification and monitoring (Berensmann et al., Citation2016).
2 2020 annual average exchange rate S$ per unit of US dollar is 1.3221. Sourced from the Monetary Authority of Singapore at https://eservices.mas.gov.sg/Statistics/msb/ExchangeRates.aspx
3 2020 annual average exchange rate S$ per unit of US dollar is 1.3221. Sourced from the Monetary Authority of Singapore at https://eservices.mas.gov.sg/Statistics/msb/ExchangeRates.aspx
4 2020 annual average exchange rate of JPY per unit of US dollar is 106.78. Sourced from the Bank of Japan at https://www.stat-search.boj.or.jp.
5 2020 annual average exchange rate of RM per unit of US dollar is 4.2016. Sourced from Central Bank of Malaysia at https://bnm.gov.my
8 Shariah-compliant financial instrument is often referred as Islamic bond or ‘Sharia-compliant’ bond. For more information about green sukuk see Azhgaliyeva (Citation2021).
9 See Appendix A.
10 In 2020, there was a shift to pandemic bonds for addressing COVID—19 outbreaks.
References
- Azhgaliyeva, D. (2020). An overview of green bonds pricing mechanisms—An opinion on ‘what’s in a greenium: An analysis of pricing methodologies and discourse in the green bond market. Journal of Environmental Investing, 10(1), 77–79.
- Azhgaliyeva, D. (2021). Green Islamic bonds. Asian Development Outlook 2021 background paper. https://www.adb.org/documents/asian-development-outlook-2021-background-papers
- Azhgaliyeva, D., Kapoor, A., & Liu, Y. (2020). Green bonds for financing renewable energy and energy efficiency in South-East Asia: A review of policies. Journal of Sustainable Finance & Investment, 10(2), 113–140. https://doi.org/10.1080/20430795.2019.1704160
- Azhgaliyeva, D., & Liddle, B. (2020). Introduction to the special issue: Scaling Up green finance in Asia. Journal of Sustainable Finance & Investment, 10(2), 83–91. https://doi.org/10.1080/20430795.2020.1736491
- Banga, J. (2019). The green bond market: A potential source of climate finance for developing countries. Journal of Sustainable Finance and Investment, 9(1), 17–32. https://doi.org/10.1080/20430795.2018.1498617
- Berensmann, K., Dafe, F., Kautz, M., & Lindenberg, N. (2016). Green bonds: Taking Off the rose-coloured glasses. Briefing paper 24/2016. German Development Institute.
- Bloomberg. (2020). Fixed income securities. Retrieved 30 July 2020. Bloomberg Terminal.
- Bloomberg. (2022). Bloomberg terminal.
- BloombergNEF. (2015). BNEF Bloomberg terminal guide, September 10, 2015.
- Climate Bonds Initiative. (2020). Green Bond Policy Framework. https://www.climatebonds.net/files/files/GB%20Policy%20Data%20Framework%281%29.pdf
- Climate Bonds Initiative. (2021). Green Bond Policy Data. Retrieved 25 February 2021. https://www.climatebonds.net/policy/data/download
- Climate Bonds Initiative. (2022). Strategic issuance: Sovereigns, cities, development banks, other public entities. Retrieved 4 March 2022. https://www.climatebonds.net/policy/policy-areas/strategic-issuance
- Deschryver, P., & de Mariz, F. (2020). What future for the green bond market? How can policymakers, companies, and investors unlock the potential of the green bond market? Journal of Risk and Financial Management, 13(3), 61. https://doi.org/10.3390/jrfm13030061
- Febi, W., Schaefer, D., Stephan, A., & Sun, C. (2018). The impact of liquidity risk on the yield spread of green bonds. Finance Research Letters, 27, 53–59. https://doi.org/10.1016/j.frl.2018.02.025
- Gertler, P. J., Martinez, S., Premand, P., Rawlings, L. B., & Vermeersch, C. M. J. (2016). Impact evaluation in practice, second edition. Inter-American Development Bank and World Bank. © World Bank. https://openknowledge.worldbank.org/handle/10986/25030 License: CC BY 3.0 IGO.
- Indonesian Financial Services Authority. (2014). Roadmap for sustainable finance in Indonesia 2015-2019. https://agep.aseanenergy.org/wp-content/uploads/2018/04/ojk-menerbitkan-roadmap-keuangan-berkelanjutan-di-indonesia-dan-buku-pedoman-energi-bersih-ojk.pdf
- Intergovernmental Panel on Climate Change (IPCC). (2022). Climate change 2022: Impacts, adaptation and vulnerability, IPCC. https://www.ipcc.ch/report/ar6/wg2/
- International Capital Market Association (ICMA). (2021). Green bond principles. Voluntary process guidelines for issuing Green bonds, ICMA. June. Retrieved 23 July 2021. https://www.icmagroup.org/assets/documents/Sustainable-finance/2021-updates/Green-Bond-Principles-June-2021-140621.pdf
- IPCC. (2018). Global warming of 1.5°C. IPCC. https://www.ipcc.ch/sr15/
- Kapoor, A., Teo, E., Azhgaliyeva, D., & Liu, Y. (2020). The viability of Green bonds as a financing mechanism for Green buildings in ASEAN. ADBI Working Paper N1186. https://www.adb.org/sites/default/files/publication/636661/adbi-wp1186.pdf
- Laird, N. M., & Fitzmaurice, G. M. (2013). Longitudinal data modeling. In M. A. Scott, J. S. Simonoff, & B. D. Marx (Eds.), The SAGE handbook of multilevel modeling (pp. 141–160). SAGE. https://doi.org/10.4135/9781446247600.n9.
- Lin, Y.-M., You, S.-J., & Huang, M.-S. (2012). Information asymmetry and liquidity risk. International Review of Business Research Papers, 8(1), 112–131.
- Ng, A. W. (2018). From sustainability accounting to a green financing system: Institutional legitimacy and market heterogeneity in a global financial centre. Journal of Cleaner Production, 195, 585–592. https://doi.org/10.1016/j.jclepro.2018.05.250
- Ng, T. H., & Tao, J. Y. (2016). Bond financing for renewable energy in Asia. Energy Policy, 95, 509–517. https://doi.org/10.1016/j.enpol.2016.03.015
- OECD. (2015). Green bonds: Country experiences, barriers and options. https://www.oecd.org/environment/cc/Green_Bonds_Country_Experiences_Barriers_and_Options.pdf
- Shurey, D. (2018). Guide to Green bonds on the terminal: Understanding the Bloomberg Green bond universe, Bloomberg New Energy Finance, January 22. Retrieved 27 July 2021. https://www.bnef.com/insights/12753/view
- Skrondal, A., & Rabe-Hesketh, S. (2008). Multilevel and related models for longitudinal data. In J. De Leeuw, E. Meijer, & H. Goldstein (Eds.), Handbook of multilevel analysis (pp. 275–299). Springer.
- SP. (2019). Green bond market slows significantly in 2018 amid shift to social bonds. https://www.spglobal.com/marketintelligence/en/news-insights/trending/TSCvk08MnYNVLZmd1urLIA2
- World Bank. (2017). Fiji issues first developing country Green bond, raising $50 million for climate resilience. https://www.worldbank.org/en/news/press-release/2017/10/17/fiji-issues-first-developing-country-green-bond-raising-50-million-for-climate-resilience
Appendix A
List of 56 green-bond-issuing countries: Argentina; Australia; Austria; Belgium; Bermuda; Brazil; Canada; Cayman Islands; Chile; Costa Rica; Denmark; Estonia; Fiji; Finland; France; Germany; Greece; Hong Kong, China; Hungary; India; Indonesia; Ireland; Italy; Japan; Kenya; Korea (the Republic of); Latvia; Lithuania; Luxembourg; Malaysia; Marshall Islands; Mauritius; Mexico; Namibia; Netherlands; New Zealand; Nigeria; Norway; PRC; Peru; Philippines; Poland; Portugal; Singapore; Slovenia; South Africa; Spain; Sweden; Switzerland; Taipei; Thailand; Turkey; United Arab Emirates; United Kingdom of Great Britain and Northern Ireland; United States; and Virgin Islands (British).
List of green-bond-issuing economies in Asia: Hong Kong, China; India; Indonesia; Japan; Korea (the Republic of); Malaysia; PRC; Philippines; Singapore; Taipei,China; and Thailand.
Appendix B
Figure B1. Structure of Green Bond Issuers.
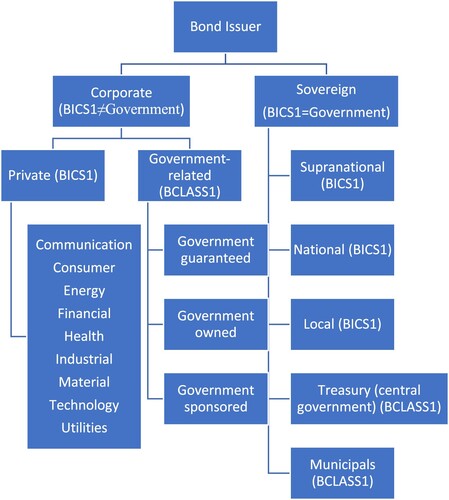
Table B1. Sectors and Subsectors.
Table B2. Correlation matrix.