
 ?Mathematical formulae have been encoded as MathML and are displayed in this HTML version using MathJax in order to improve their display. Uncheck the box to turn MathJax off. This feature requires Javascript. Click on a formula to zoom.
Abstract
Common metrics used for assessing air quality are based on guidelines and/or standards for regulating concentrations that should not be exceeded over a period. Exceeding those values would represent problematic situations. A lack of agreement on appropriate norms or standards deems this approach sub-optimal. Moreover, this approach does not relate a proportion of exceedance to specific health outcomes. A need to develop health-centered IAQ metrics that can quantify burden of disease in terms of epidemiological evidence of population morbidity and mortality supported by the best knowledge of health effects, is pressing. This work proposes an approach that harnesses the advantages of using disability adjusted life years (DALYs) as a valuable metric to quantify and rank the burden of household air pollution, as a global perspective. Two methods were used to compute DALYs, one mainly based on incidence data and another mainly based on effect factors (i.e. DALYs per unit-intake of contaminant of interest). The methods are based on the following parameters: risk estimates, baseline incidence rates, damage factors, indoor air contaminant concentrations, human toxicological & epidemiological effect factors, dose–response factors, cancer-related variables and breathing rates. Systematic searches and reviews of peer-reviewed literature (including systematic reviews and meta-analyses) were performed to find information on said input parameters. Meta-analysis was used to pooled and synthesise data from different studies. A Monte Carlo approach was used to model results in DALYs lost. Over 1000 articles were revised and overall ∼200 unique sources were used as sources of data. Ten contaminants were accounted for with specific risk estimates and damage factors data, for which human epidemiological effect factors were derived. Representative concentrations of 45 contaminants were calculated. Thirty-nine contaminants were accounted for human toxicological effect factors. Total pooled DALYs were estimated per 100,000 exposed population with corresponding uncertainty intervals. Estimated population-averaged annual cost, in DALYs lost, of chronic air contaminant inhalation in dwellings indicate that the contaminants with highest median DALY loss estimates are PM10 and PM2.5 (magnitudes of 103); PMcoarse, formaldehyde and NO2 could be found with magnitudes of 102; contaminants with magnitudes of 101 include radon and ozone, finally SO2 and acrolein would have magnitudes of 10°; mould-related bioaerosols could be of interest as well. The updated strategies allowed for the quantification of contaminants and health outcomes that were not accounted for in previous works. Computed DALYs have lower uncertainty intervals than those previously proposed. The updated methodology presented in this study may be used to assess cumulative health impacts of indoor air contaminants.
1. Introduction
Air pollution is one of the most serious health risks (WHO, Citation2021), and there now is enough scientific evidence to justify establishing and/or upgrading approaches for quantifying the health burden of (indoor)-air contaminants using current epidemiological and toxicological research. Common metrics used for assessing air quality are based on guidelines and/or standards for regulating concentrations that should not be exceeded over a period. Exceeding them would be problematic but the magnitude of doing so is unclear (Jones, Citation2017). This is because the approach does not relate a proportion of exceedance to specific health outcomes. Therefore, there is a pressing need to develop health-centered IAQ metrics that can quantify burden of disease in terms of epidemiological evidence of population morbidity and mortality supported by the best knowledge of health effects. Consequently, the disability adjusted life year (DALY) has been adopted worldwide in air pollution global burden of disease studies (Cohen et al., Citation2017). It was developed in the 1990s and is the sum of the years of life lost, and the time lived with a disability, attributable to some cause (Homedes, Citation1996).
A methodology to estimate the population-average health effects attributable to the inhalation of selected air contaminants in United States residences was proposed by Logue et al. (Citation2012) using disease incidence data and health-related effect factors, and accounting for output uncertainty. It uses the DALY metric by defining an intake-incidence DALY (IND) method and an intake-DALY (ID) method. Although the method proposed by Logue et al. (Citation2012) is pioneering because it quantified DALY losses based on two distinct methods, the approach has limitations. Here, we provide a way of strengthening the method, harnessing the advantages of using DALYs as a valuable metric to quantify and rank the burden of household air pollution, using a global perspective.
2. Methods
Two methods were used to compute DALYs, one based on incidence data [IND-method], and another based on effect factors that use a DALY value per unit-of-mass-intake of the contaminant of interest [ID-method] (Logue et al., Citation2012).
2.1. The IND method
The IND method [EquationEq. (1)(1)
(1) ] uses an epidemiologically-based concentration–response function to quantify disease incidence, which, when combined with a damage factor (DF), yields an expected DALY loss.
(1)
(1)
In the IND model, a damage factor is used to represent the life-years adversely impacted by each disease event, in DALY.(incidence)case−1. The DFIND is expressed for a specific contaminant h and disease k as
(2)
(2)
The second term on the right of EquationEq. (1)(1)
(1) , the disease incidence, refers to the relationship between contaminant concentration (IAP), risk of disease (β), and baseline incidence (γ0); see EquationEq. (3)
(3)
(3) . This relationship is modeled using a log-linear concentration response function given by EquationEq. (3)
(3)
(3) . As mortality is expected to have a greater impact on the global disease burden than morbidity, it is recommended that mortality data be used to represent disease incidence for most air pollution-related diseases (Cohen et al., 2017).
(3)
(3)
where,
is the baseline incidence of disease k of contaminant h, and
is a statistic describing the concentration of contaminant h. Beta
is an empirical parameter representing the estimated change in risk for a given change in contaminant concentration, ΔC, for disease k and contaminant h. This is expressed as
(4)
(4)
A breathing rate (BR, in m3 yr−1) combined with the parameter (in unit-intake m−3)Footnote1 is used to obtain an estimate of the human epidemiological effect factor (
in DALYs per unit-intake of contaminant) via the IND method, as shown in EquationEq. (5)
(5)
(5)
(5)
(5)
2.2. The ID method
The ID method [EquationEq. (6)(6)
(6) ] quantifies DALYs as the product of effect factors (EFID), intakes, a cancer-related parameter (ADAF) and breathing rates (BR), involving EquationEqs. (6)–(9). In this method, the EFID is the product of a dose–response factor (DRF, in case kgintake−1) and a damage factor (DFID, in DALY.(cancer or non-cancer)case)−1.
(6)
(6)
(7)
(7)
(8)
(8)
(8a)
(8a)
(8b)
(8b)
or
(9)
(9)
(9a)
(9a)
2.3. The input data
Parameters described in Section 2, can have more than one available value or set of data; see Datasets in . Thus, pooling independent data points is the recommended strategy for data synthesis (Schmid et al., Citation2020).
Table 1. Summary descriptive of the IND model inputs and disease incidence output for selected contaminantsTable Footnote+.
For the IND method, values of the parameters beta (β), baseline incidence (γ0), representative contaminant concentration and damage factor (DFIND) are obtained by combining systematic reviews with supplementary references. Baseline disease incidences are derived from epidemiological studies.
For the ID method, damage factors, representing overall cancer or non-cancer effects should be based on the latest available data from the World Health Organization (WHO) and/or the Global Burden of Disease studies. The DRF takes as a point of departure either the ED50 (median effective dose) benchmark measure [see EquationEq. (8a)(8a)
(8a) ] or concentration–response factors (CRF) [see EquationEq. (9a)
(9a)
(9a) ]. The ED50 is the human-equivalent lifetime daily dose per person, related to inhalation (intake) of a substance that produces a specific effect (e.g. carcinogenic or non-carcinogenic effects) in 50% of the population that takes that dose (Fantke et al., 2021) and CRFs are contaminant-associated mortality or morbidity rates per unit concentration of contaminant inhaled (Gronlund et al., Citation2015). ED50 based-DRF (ED50-DRF) for the contaminants of interest are extracted from Life Cycle Impact Assessment (LCIA) databases. CRF based-DRF (CRF-DRF) are computed using the same epidemiological inputs as the IND method and can be derived following Fantke et al. (Citation2019). When EFs are based on the ED50, they are referred to as human toxicological effect factors [EquationEq. (8)
(8)
(8) ] whereas those based on CRFs are called human epidemiological effect factors [EquationEq. (9)
(9)
(9) ]. The ADAF parameter used for the estimation of cancer risks and the breathing rates representing the volume of air breathed indoors each year, are determined from relevant sources following a focused literature review.
2.4. The modelling
Since each method will derive an estimate of DALY and EF (one estimate via IND method and two estimates via ID method, for a total of three theoretically possible independent DALY and EF estimations), we pooled the results from each independent method via meta-analysis to obtain pooled DALYs and pooled Effect Factors. To account for the uncertainty of the parameters, the Monte Carlo (MC) method is applied. First, a bootstrapping technique is applied to populate a synthetic database for each parameter and described using a probability distribution function (PDF). The PDF is then combined with the bootstrapped results to generate random samples of the inputs, which in turn are used to compute the three outputs: (i) disease incidence, (ii) effect factors and (iii) DALYs. We repeated this process until the means of the results were normally distributed. All outputs are reported by their median and 95% confidence interval of its distribution, representing the range that contains 95% of the population values.
Preliminary analysis of the input data showed that they can be well described by a lognormal distribution around its median. This type of distribution is widely used and accepted to adequately adjust for right-skewed data (Crow & Shimizu Citation1987). A MATLAB code was used to run the Monte Carlo simulations. All pooled estimates (meta-analysis) were computed with STATA 16.0’s ‘metan’ commands, using the DerSimonian and Laird (random effects) estimators (Harris et al., Citation2008).
3. Results
Systematic searches and reviews of peer-reviewed literature (including systematic reviews and meta-analyses) were performed to extract information on the input parameters. Over 1000 articles were identified and ∼200 unique sources were used as sources of data. provide descriptive statistics and recommended values for each input parameter for IND and ID model, respectively. Ten contaminants were accounted for with specific risk estimates and damage factors data: Acrolein, Benzene, Mould-related bioaerosols, Formaldehyde, NO2, O3, PM10, PM2.5, Radon and SO2 (see ). The methodology allowed for the identification, using the literature, of a single representative health outcome for each of the ten contaminants (see ). The health outcome chosen to represent each contaminant is the most reported health impact associated with it, either for mortality or morbidity endpoints.
Table 2. Summary descriptive of the ID model inputs, for selected contaminantsTable Footnote+.
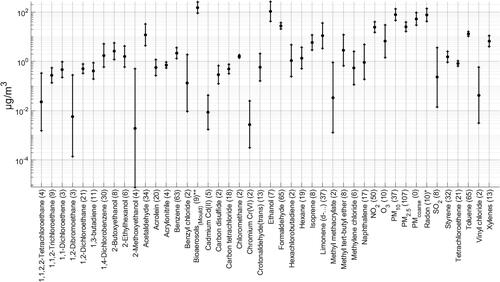
Representative concentrations of 45 contaminants were calculated. They are all included because they have previously been identified as contaminants of interest in dwellings (Logue et al., Citation2011). shows the representative mid-range concentrations, including a 95% CI and the magnitude of individual values (data sets) used to obtain them. Mid-range indoor concentrations for the contaminants are, in general, within the values reported by others (Logue et al., 2011; Vardoulakis et al., Citation2020). With over 50 data sets, PM2.5, formaldehyde, Toluene, Benzene and NO2 would be the contaminants with the most reported values.
Figure 1. Recommended representative concentrations for the 45 contaminants included in the analysis. In alphabetical order. Central estimate and 95% CI of distribution in black. Datasets in parenthesis. *Radon in Bq m−3. **Bioaerosols in CFU m−3.
The annual incidence of disease for the ten indoor contaminants and selected typical health outcomes was calculated using EquationEq. (3)(3)
(3) and data inputs are presented in . The highest disease incidences are found in PM10, PM2.5 and mould, with estimates exceeding magnitudes of 102. Because particle contaminants are based on all-cause mortality risk estimations, this is to be expected. Mould-bioaerosols have a high value because asthma morbidity in children accounts for a large portion of the illness burden.
presents the damage factors for the contaminants in the IND model and their corresponding number of datasets found. Our method for calculating this parameter yielded novel damage factors for a broader range of contaminants not presented before in related works (Fazli & Stephens, Citation2018). Results are based on contaminant and health outcome-specific effects, which allows the information gaps on contaminant-related damage factors to be reduced.
To account for updated information and variability of data for standard breathing rates (Phillips & Moya, Citation2013), we pool recommended values for long-term inhalation rates for adults aged 16–81+ years (USEPA, Citation2011). For the ADAF parameter, the review of pertinent references indicates that the USEPA (Citation2005) recommendations are still in use; see CalEPA (Citation2009). The recommended estimate for the standard breathing rate is 14.80 m3.(pop d)−1 (95% CI 13.50–16.20) and for the ADAF parameter is 1.6 (95% CI 1–10). The USEtox database was used to extract ED50-DRFs (Fantke et al., Citation2017). The USEtox model is chosen because it is a widely used global scientific consensus model for characterising human toxicological consequences in LCIA. CRF-DRFs were calculated following Fantke et al. (Citation2019). Regarding the DFID parameter, we use the latest results from the 2019 GBD study. shows descriptive for ID model.
Combined carcinogenic and non-carcinogenic (toxicological)-effect factors were computed for 39 contaminants using EquationEq. (8b)(8b)
(8b) whilst (epidemiological)-effect factors were computed for ten contaminants using EquationEqs. (5)
(5)
(5) and Equation(9)
(9)
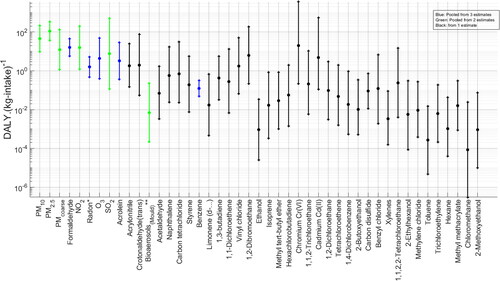
(9) . The results are pooled, giving 45 contaminants with effect factors. Results are shown in . PM2.5 has the highest pooled effect factor [1.1
102 (95% CI 3.6
101–3.3
102)] (an order of magnitude higher than the other contaminants) indicating that this would be the contaminant with the highest chronic health impacts per kg inhaled in the exposed population, in dwellings. Other PMs are among the contaminants with the highest EFs, with chromium, NO2 and formaldehyde having all >101 effect factors. These results represent an update to the preeminent work on human–toxicological & epidemiological effect and damage factors of carcinogenic and noncarcinogenic chemicals for life cycle impact assessment presented by Fantke et al. (Citation2019) and Huijbregts et al. (Citation2005). The results given in have narrower confidence intervals when compared with those of Huijbregts et al. (Citation2005).
Figure 2. Pooled effect factors. Highest to lowest DALY median. Central estimate and 95% CI of distribution in black. *Radon in DALY.(10−9Bq-intake)−1. **Bioaerosols in DALY.(10−9CFU-intake)−1
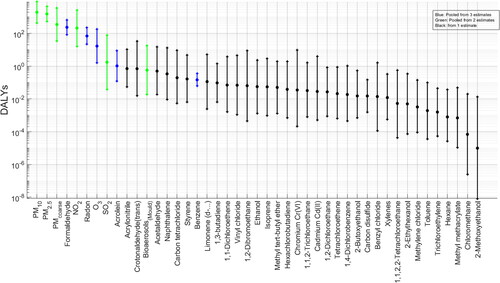
Total pooled DALYs were estimated per 100,000 population with corresponding uncertainty intervals; see . Estimated population-averaged annual cost, in units of DALYs lost, of chronic air contaminant inhalation in dwellings, indicate that the contaminants with the highest median pooled DALY loss estimates are PM10 [1.9103 (95% CI 4.4
102–8.7
103)] and PM2.5 [1.5
103 (95% CI 5.3
102–4.4
103)]. PMcoarse, formaldehyde, NO2, radon and ozone have medians among 102–101. Acrolein and SO2 are within 100. Mould-related bioaerosols could still be of interest having >0.5 DALYs per 100,000 exposed population. The confidence intervals of the results indicate a lower uncertainty range than those presented by Logue et al. (Citation2012).
Figure 3. Pooled DALYs. Highest to lowest median. Central estimate and 95% C.I. of distribution in black.
Contaminant with highest median DALYs include the so called criteria pollutants, which are defined as the indoor contaminants with the highest health impacts based on the DALY metric. There is sufficient epidemiological evidence that indicates PM10, PM2.5, NO2, O3 and SO2 have the potential to be associated with harm in humans, using other health based-metrics such as relative risks (WHO, Citation2021). Other airborne contaminants where health based-evidence exists to indicate that they are contaminants of interest in the indoor environment, having also elevated DALY values, include Formaldehyde (Golden, Citation2011), Radon (Pawel & Puskin, Citation2004), Acrolein (Ghilarducci & Tjeerdema, Citation1995) and mould (Heseltine and Rosen, Citation2009).
4. Conclusions
PM2.5 have the highest median DALYs per unit intake (1.1 102 (95% CI 3.6
101–3.3
102)), being one order of magnitude above the rest of contaminants included in the analysis, indicating that higher harm is associated with fine PM. The highest absolute DALY medians were found for PM10 with 1.8
103 (95% CI 4
102−9
103) and PM2.5 with 1.9
103 (95% CI 4.4
102–8.7
103). PM10 is higher because it includes the burden associated with the PM2.5 fraction. Reporting representative indoor concentrations or disease incidence as the sole metrics to assign harm from exposure to contaminants is rendered suboptimal. Computed DALYs have lower uncertainty intervals than those previously proposed. The updated methodology presented in this study may be used to assess cumulative health impacts of indoor air contaminants and contribute to the development of standards.
Acknowledgement
This study was supported by a University of Nottingham Faculty of Engineering Research Excellence Scholarship and partially supported by Chartered Institution of Building Services Engineers (CIBSE).
Disclosure statement
No potential conflict of interest was reported by the authors.
Additional information
Funding
Notes
1 A unit-intake could be kg, Bq, or colony forming units (CFU).
References
- Annesi-Maesano, I., Hulin, M., Lavaud, F., Raherison, C., Kopferschmitt, C., de Blay, F., Charpin, D. A., & Denis, C. (2012). Poor air quality in classrooms related to asthma and rhinitis in primary schoolchildren of the French 6 Cities Study. Thorax, 67(8), 682–688. https://doi.org/10.1136/thoraxjnl-2011-200391
- Cal EPA. (2009). Technical support document for cancer potency factors: Methodologies for derivation, listing of available values, and adjustments to allow for early life stage exposures.California Environmental Protection Agency, Office of Environmental Health Hazard Assessment, Air Toxicology and Epidemiology Branch.
- Cohen, A. J., Brauer, M., Burnett, R., Anderson, H. R., Frostad, J., Estep, K., Balakrishnan, K., Brunekreef, B., Dandona, L., Dandona, R., Feigin, V., Freedman, G., Hubbell, B., Jobling, A., Kan, H., Knibbs, L., Liu, Y., Martin, R., Morawska, L., … Forouzanfar, M. H. (2017). Estimates and 25-year trends of the global burden of disease attributable to ambient air pollution: An analysis of data from the Global Burden of Diseases Study 2015. The. Lancet (London, England), 389(10082), 1907–1918. https://doi.org/10.1016/S0140-6736(17)30505-6
- Crouse, D. L., Peters, P. A., Hystad, P., Brook, J. R., van Donkelaar, A., Martin, R. V., Villeneuve, P. J., Jerrett, M., Goldberg, M. S., Pope, C. A., Brauer, M., Brook, R. D., Robichaud, A., Menard, R., & Burnett, R. T. (2015). Ambient PM2.5, O-3, and NO2 exposures and associations with mortality over 16 years of follow-up in the Canadian census health and environment Cohort (CanCHEC). Environmental Health Perspectives, 123(11), 1180–1186. https://doi.org/10.1289/ehp.1409276
- Crow, E. L., & Shimizu, K. (1987). Lognormal distributions. Marcel Dekker.
- Fantke, P. (Ed.), Bijster, M., Guignard, C., Hauschild, M., Huijbregts, M., Jolliet, O., Kounina, A., Magaud, V., Margni, M., McKone, T. E., Posthuma, L., Rosenbaum, R. K., van de Meent, D., & van Zelm, R. (2017). USEtox® 2.0 Documentation (Version 1). http://usetox.org
- Fantke, P., McKone, T. E., Tainio, M., Jolliet, O., Apte, J. S., Stylianou, K. S., Illner, N., Marshall, J. D., Choma, E. F., & Evans, J. S. (2019). Global effect factors for exposure to fine particulate matter. Environmental Science & Technology, 53(12), 6855–6868. https://doi.org/10.1021/acs.est.9b01800
- Fazli, T., & Stephens, B. (2018). Development of a nationally representative set of combined building energy and indoor air quality models for US residences. Building and Environment, 136, 198–212. https://doi.org/10.1016/j.buildenv.2018.03.047
- Fischer, P. H., Marra, M., Ameling, C. B., Hoek, G., Beelen, R., de Hoogh, K., Breugelmans, O., Kruize, H., Janssen, N. A. H., & Houthuijs, D. (2015). Air pollution and mortality in seven million adults: the Dutch Environmental Longitudinal Study (DUELS). Environmental Health Perspectives, 123(7), 697–704. https://doi.org/10.1289/ehp.1408254
- GBD. (2019). Global health metrics. Residential radon—Level 3 risk. GBD.
- Ghilarducci, D. P., & Tjeerdema, R. S. (1995). Fate and effects of acrolein. Reviews of Environmental Contamination and Toxicology, 144, 95–146.
- Golden, R. (2011). Identifying an indoor air exposure limit for formaldehyde considering both irritation and cancer hazards. Critical Reviews in Toxicology, 41(8), 672–721. https://doi.org/10.3109/10408444.2011.573467
- Gronlund, C. J., Humbert, S., Shaked, S., O'Neill, M. S., & Jolliet, O. (2015). Characterizing the burden of disease of particulate matter for life cycle impact assessment. Air Quality, Atmosphere, & Health, 8(1), 29–46. https://doi.org/10.1007/s11869-014-0283-6
- Harris, R. J., Deeks, J. J., Altman, D. G., Bradburn, M. J., Harbord, R. M., & Sterne, J. A. (2008). Metan: fixed-and random-effects meta-analysis. The Stata Journal: Promoting Communications on Statistics and Stata, 8(1), 3–28. https://doi.org/10.1177/1536867X0800800102
- Heseltine, E., & Rosen, J. (Eds.) (2009). WHO guidelines for indoor air quality: Dampness and mould. World Health Organization. Regional Office for Europe.
- Homedes, N. (1996). The disability-adjusted life year (DALY) definition, measurement and potential use. Technical report. The World Bank.
- Huijbregts, M. A. J., Rombouts, L. J. A., Ragas, A. M. J., & van de Meent, D. (2005). Human-toxicological effect and damage factors of carcinogenic and noncarcinogenic chemicals for life cycle impact assessment. Integrated Environmental Assessment and Management, 1(3), 181–244. https://doi.org/10.1897/2004-007r.1
- Jones, B. (2017). Metrics of health risks from indoor air. Ventilation Information Paper, 36, 39-44.
- Logue, J. M., McKone, T. E., Sherman, M. H., & Singer, B. C. (2011). Hazard assessment of chemical air contaminants measured in residences. Indoor Air, 21(2), 92–109.
- Logue, J. M., Price, P. N., Sherman, M. H., & Singer, B. C. (2012). A method to estimate the chronic health impact of air pollutants in US residences. Environmental Health Perspectives, 120(2), 216–222. https://doi.org/10.1289/ehp.1104035
- Pawel, D. J., & Puskin, J. S. (2004). The US Environmental Protection Agency’s assessment of risks from indoor radon. Health Physics, 87(1), 68–74. https://doi.org/10.1097/00004032-200407000-00008
- Phillips, L., & Moya, J. (2013). The evolution of EPA’s Exposure Factors Handbook and its future as an exposure assessment resource. Journal of Exposure Science & Environmental Epidemiology, 23(1), 13–21.
- Schmid, C. H., Stijnen, T., & White, I. R. (2020). Handbook of meta-analysis (1st ed.). Chapman and Hall/CRC. https://doi.org/10.1201/9781315119403
- USEPA. (2005). Supplemental Guidance for Assessing Susceptibility from Early-Life Exposure to Carcinogens. EPA/630/R-03/003F.
- USEPA. (2011). Exposure factors handbook 2011 edition (final). USEPA.
- Vardoulakis, S., Giagloglou, E., Steinle, S., Davis, A., Sleeuwenhoek, A., Galea, K. S., Dixon, K., & Crawford, J. O. (2020). Indoor exposure to selected air pollutants in the home environment: A systematic review. International Journal of Environmental Research and Public Health, 17(23), 8972. https://doi.org/10.3390/ijerph17238972
- World Health Organization. (2021). WHO global air quality guidelines: particulate matter (PM2. 5 and PM10), ozone, nitrogen dioxide, sulfur dioxide and carbon monoxide. World Health Organization.