
ABSTRACT
Background: Infections, cytopenia, and gastrointestinal (GI) toxicity are adverse events of special interest (AESI) affecting most relapsed Philadelphia chromosome–negative (Ph−) B-cell acute lymphocytic leukemia (ALL) patients. This study quantified real-world rates and economic burden of these events among relapsed Ph− B-cell ALL patients in the United States.
Methods: Adults with relapsed Ph− B-cell ALL during 1 April 2009–31 October 2016 were selected from MarketScan® healthcare claims databases. Outcomes included proportions of patients with AESIs and AESI-related costs during 100 days after relapsed hospitalization.
Results: Of 400 relapsed Ph− B-cell ALL patients, 92.5% experienced ≥1 AESI during the median 100-day follow-up, of which 64.6% had infections, 94.6% cytopenia, and 46.2% GI toxicities. Mean (SD; median) AESI-related total cost per patient during follow-up was $197,213 ($308,551; $105,731), with a mean of 2 AESI-related hospitalizations comprising 32.2 inpatient days. Mean (SD; median) healthcare costs were highest for infections ($164,461 [$347,083; $64,528]), followed by cytopenia ($125,210 [$165,141; $67,475]) and GI events ($11,652 [$40,231; $1349]).
Conclusion: The economic burden of AESIs is substantial, with infections the most expensive, followed by cytopenia and GI toxicity. New therapies that can improve outcomes in relapsed Ph− B-cell ALL while offering a favorable safety profile are needed.
1. Introduction
Acute lymphoblastic leukemia (ALL) is a highly aggressive cancer of the blood and bone marrow characterized by the sudden onset of abnormal proliferation and differentiation of immature lymphoid cells in the bone marrow, peripheral blood, and extramedullary sites [Citation1–Citation4]. ALL is rare with an incidence rate in the United States (US) estimated at 1.57 per 100,000 overall [Citation5,Citation6]. If left untreated, ALL is fatal within days or a few weeks [Citation1,Citation3].
The treatment and management of the disease is complicated by the fact that ALL is not a single disease, but a heterogeneous group of related hematologic pathology that require highly diversified treatment protocols [Citation2]. Several pathophysiologic subtypes of ALL have been classified based on the lymphoid cell type (B-cell or T-cell) and other cytogenetic factors, the most well-known being the Philadelphia chromosome’s presence (Ph+) or absence (Ph−), each with different prognoses and specific treatment recommendations [Citation1,Citation4,Citation7]. In adults, Ph− ALL is more common than Ph+ ALL where 75% of adult cases develop from precursors of the Ph− B-cell type [Citation8]. The course of adult ALL treatment, generally lasting 2–3 years, typically consisting of intensive multidrug chemotherapies, tyrosine kinase inhibitors and other targeted biologic therapy, radiation therapy, and bone marrow transplant, with each regimen associated with significant adverse events and complications [Citation7,Citation9].
The majority (65–90%) of newly diagnosed ALL patients will achieve complete remission with these regimens; however, approximately 50% of patients with Ph− B-cell ALL suffer relapse [Citation7,Citation10–Citation13]. Relapsed or refractory (R/R) ALL in adults carries a historically poor prognosis, over 90% of patients eventually die with a median overall survival of 3–6 months and 5-year overall survival following the first relapse was around 3–10% [Citation10,Citation11,Citation13–Citation15]. R/R ALL patients are extremely ill and their health is further worsened by the highly toxic multidrug salvage chemotherapy regimens commonly used to treat the disease [Citation3,Citation7,Citation10,Citation16]. Significant toxicities include hematologic adverse events, infections/sepsis, gastrointestinal (GI) adverse events, pulmonary events, and neurologic toxicity [Citation4,Citation9,Citation17–Citation19].
Hematologic toxicity (cytopenias), infections/sepsis, and GI toxicities are important adverse events of special interest (AESI) among ALL patients due to their pervasive and potentially life-threatening impacts on ALL patients’ quality of life [Citation17,Citation19–Citation21]. Cytopenia and infection are the most common adverse events reported up to 100% of all R/R ALL patients in a systematic literature review study [Citation17]. Among the studies included, the incidence of grade 3 or higher infection raged from 3% to 56% [Citation17]. Due to low immune response, half of adult ALL patients may undergo infection related complications during the induction therapy while more than one in five suffers from infections during maintenance therapy. The study further reported that older adults with ALL are at higher risk for infection and related mortality [Citation19]. Most common infectious adverse events among R/R ALL patients are infections, febrile neutropenia, bacterial and fungal infections or sepsis, viral infection, and pneumonia [Citation17]. GI toxicities are also common among R/R ALL patients. Some of the common GI toxicities associated with chemotherapy regimens among R/R ALL patients were oral toxicity/mucositis, nausea, and vomiting (Hummel) [Citation17].
These AESI often further compromise the severity and complications of the disease, resulting in repeated and extended inpatient admissions and health resource use. The treatment landscape for adult R/R ALL has been rapidly changing. Along with improvements brought about by novel approaches to salvage chemotherapy, the approval of the bispecific monoclonal antibody blinatumomab by the US Food and Drug Administration for R/R Ph− B-cell ALL in 2014 has ushered the introduction of other monoclonal antibody agents, such as inotuzumab ozogamicin and other immunomodulatory agents [Citation10,Citation20,Citation22–Citation25]. These new therapies can improve the outcomes and tend to be less toxic compared with standard of care [Citation20,Citation25]. However, no study so far, to our knowledge, has documented the economic burden related to AESI in this population. To inform the value of the innovative therapies, it is essential to quantify the economic burden of AESI. Therefore, this study seeks to quantify the burden of AESI in relapsed Ph− B-cell ALL patients.
2. Objectives
This aim of this study is to examine the rates and associated economic burden of infections, cytopenia, and GI toxicities among adults with relapsed Ph− B-cell ALL in the United States using the most recent real-world data available.
3. Methods
3.1. Study design and data source
This retrospective cohort study is based on de-identified administrative healthcare claims data from 2008 to 2016 in the MarketScan® Commercial Claims and Encounters (Commercial) Database and Medicare Supplemental and Coordination of Benefits (Medicare) Database. The MarketScan claims databases offer one of the largest convenience samples available in proprietary US databases – with nearly 240 million unique patients since 1995. In the most recent full data year, MarketScan claims databases contain healthcare data for more than 43.6 million covered lives and are large enough to allow creation of a nationally representative data sample of Americans with employer-provided health insurance. The region and age group distribution of MarketScan enrollees is similar to that in the national datasets such as Current Population Survey. These databases capture the full continuum of care for reimbursable healthcare services delivered across all settings, including physician office visits, hospital stays, emergency room (ER) visits, and outpatient pharmacy claims for individuals with employer-sponsored primary or Medicare supplemental health insurance covered under a variety of plan types. Complete longitudinal records of inpatient services, outpatient medical services and prescription drug claims provide detailed healthcare costs, utilization, and outcomes data that include dates of service, places of service, and all payments. All database records are fully compliant with the United States patient confidentiality requirements, including the Health Insurance Portability and Accountability Act (HIPAA) of 1996. Institutional Review Board approval to conduct this study was not necessary since the study used only de-identified patient records and did not involve the collection, use, or transmittal of individually identifiable data.
3.2. Subject selection
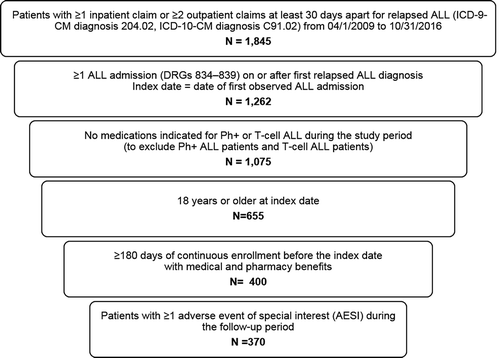
The patient population with relapsed Ph− B-cell ALL was selected for analysis of AESI according the flowchart shown in . Relapsed ALL patients were identified based on having at least one inpatient claim or two or more outpatient claims at least 30 days apart containing a diagnosis code for relapsed ALL (International Classification of Diseases, Ninth Revision, Clinical Modification [ICD-9-CM] code 204.02 or International Classification of Diseases, Tenth Revision, Clinical Modification [ICD-10-CM] code C91.02) between 1 April 2009 and 31 October 2016. The 1 April 2009 date was used because it was when the relapsed ALL ICD-9-CM code became available. Claims for diagnostic tests (a.k.a., diagnostic claims), such as diagnostic radiology or laboratory tests, were not used for patient identification. All patients were required to have at least 1 hospitalization with a diagnosis-related group (DRG) code in the range of 834–839 (acute leukemia or chemotherapy with acute leukemia) on or after the first relapsed ALL diagnosis date [Citation26]. The index date was the first ALL hospitalization admission date on or after the first relapsed ALL diagnosis during the study period. Patients included in the study were at least 18 years old on the index date and had at least six months of continuous enrollment with medical and pharmacy benefits prior to the index date. Patient with medications for Ph+ (i.e. imatinib, dasatinib, ponatinib) or T-Cell ALL (i.e. nelarabine) anytime during the study period were excluded.
Figure 1. Patient selection flowchart for adults with relapsed Ph− B-cell ALL.
Ph−: philadelphia chromosome-negative; ALL: acute lymphoblastic leukemia; ICD: International Classification of Diseases; DRG: diagnosis related group; Ph+: Philadelphia chromosome-positive.
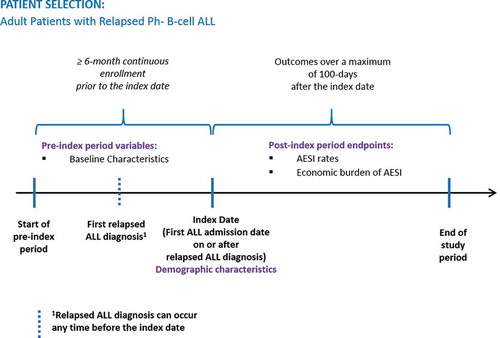
The study follow-up period was variable in length to a maximum of 100 days postindex, starting from the index date and continuing until the first evidence of inpatient death, end of health plan enrollment, end of the study period (31 October 2016), or 100 days postindex. shows the study timeline schema.
Figure 2. Study period schema.
3.3. Outcome measures
The key outcomes for this study included the proportion of relapsed Ph− B-cell ALL patients with an AESI and the medical costs associated with AESI. AESI were identified during the follow-up period using nondiagnostic inpatient and outpatient claims with an ICD-9-CM or ICD-10-CM code for the adverse events, and included infections (bacteremia, febrile neutropenia, line infections, pneumonia, and sepsis), cytopenia (anemia, neutropenia, thrombocytopenia, and other cytopenia), and GI toxicities (nausea/vomiting, diarrhea, gastritis/duodenitis, GI bleeding, and mucositis/stomatitis). Other cytopenia included leucopenia, pancytopenia, allergic purpura, qualitative platelet defects, other nonthrombocytopenic purpuras, functional disorders of polymorphonuclear neutrophils, eosinophilia, and hemophagocytic syndromes.
The number of AESI-related hospitalizations and the corresponding inpatient length of stay (LOS) during the follow-up period were reported for patients with at least one AESI. AESI-related costs calculated among those with at least one AESI were the total costs accumulated during follow-up for inpatient and outpatient medical claims with a corresponding diagnosis code for the AESI. Costs were the sum of all paid amounts on adjudicated claims, including all health plan payments and patient cost sharing in the form of copayment, deductible, and coinsurance. Cost outcomes were calculated for all AESI, for each AESI category (i.e. infections, cytopenia and GI toxicities), and for each subcategory. For hospitalizations with one AESI as the primary diagnosis, then the total inpatient costs were attributed to only that AESI; for hospitalizations showing AESI only in secondary diagnosis positions, then the costs associated with the inpatient service line of the AESI were attributed to the event. For example, a patient had both infection and cytopenia during a hospitalization. If infection was the primary discharge diagnosis of this hospitalization, the whole hospitalization costs were attributed to infection and cytopenia costs was $0. If neither infection nor cytopenia was the primary discharge diagnosis, the costs associated with the service line with infection diagnosis were allocated to infection and the costs associated with the service line with cytopenia diagnosis were allocated to cytopenia. All cost measures were adjusted for inflation using the medical component of the Consumer Price Index and standardized to 2016 US dollars.
3.4. Patient demographic and clinical characteristics
Demographic characteristics were captured at index date and clinical characteristics were measured during the 180-day preindex period. Demographic characteristics included age at index, sex, health plan type (comprehensive, indemnity, preferred or exclusive provider organization, health maintenance organization, point of service, consumer-driven health plans, high-deductible health plans), and US Census Bureau geographic region (Northeast, North Central, South, West). The clinical characteristics measured included the Deyo-Charlson Comorbidity Index (DCI) score, an aggregate measure of comorbidity using select diagnoses associated with chronic disease, and evidence of HSCT. The mean and median length of follow-up were reported.
3.5. Analysis
Univariate analyses were used to describe AESI rates and AESI-related costs in relapsed Ph− B-cell ALL patients. Categorical variables were presented as counts and percentages, and continuous variables presented as the number of observations, means, standard deviations (SDs), and medians. Data management, analytic file building and statistical analyses were conducted using SAS software, version 9.4 (SAS Institute Inc, Cary, North Carolina).
4. Results
4.1. Patient selection and demographics
A total of 400 adult patients with relapsed Ph− B-cell ALL were identified, and 370 (92.5%) patients had at least 1 AESI at some point during the follow-up period (maximum 100 days). The 370 AESI patients had a mean (SD) age of 41.9 (17.0) years, were 63% male, and had a mean (SD; median) follow-up of 83.7 (28.3; 100) days (). Over half of patients (59.7%) received health insurance coverage from preferred or exclusive provider organizations. Slightly more than one third of patients lived in south, and one-fifth lived in west and northeast, respectively. Patients had a mean (SD) comorbidity (DCI) index score of 3.0 (2.2) and 28.1% had medical claims for HSCT during the preindex period.
Table 1. Baseline characteristics of adult relapsed Ph− B-cell ALL patients with AESI.
4.2. Rates of AESI
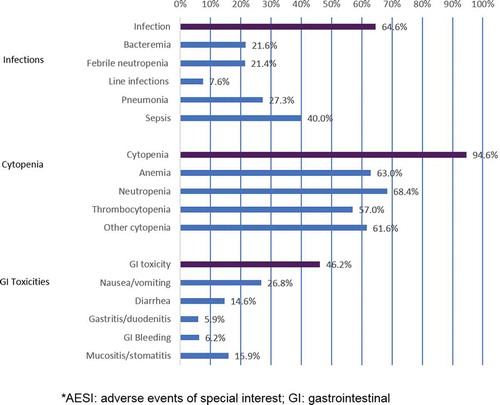
Among patients with an AESI, 64.6% had infections, 94.6% had cytopenia, and 46.2% had GI toxicity events (). The most frequent events were cytopenia, with neutropenia (68.4%) and anemia (63.0%) the most common events. The most common infection event was sepsis (40.0%) and the most frequent GI toxicity event was nausea/vomiting (26.8%).
Figure 3. AESI frequency by event type.
*AESI: adverse events of special interest; GI: gastrointestinal.
4.3. AESI-related hospitalizations and costs
Of all patients with an AESI, 349 (94.3%) required hospitalization for their events, and 21.0% AESI events resulted in hospitalizations (data not shown). These patients experienced a mean (SD) of 2.0 (1.3) AESI-related hospitalizations during follow-up with a mean (SD) total LOS of 32.2 (26.0) days. Mean (SD; median) LOS for infection, cytopenia, and GI toxicity-related events was 29.7 (26.2; 24.0), 29.5 (25.1; 25.0), and 24.0 (26.3; 15.0) days, respectively.
The mean (SD; median) total cost of AESIs per affected patient during follow-up was $197,213 ($308,551; $105,731) (). Inpatient and outpatient costs per patient were $185,990 ($306,448; $90,640) and $11,223 ($33,716; $2760), respectively. Infection-related events had the overall highest total mean (SD; median) cost per patient of $164,461 ($347,083; $64,528), followed by cytopenia ($125,210 [$165,141; $67,475]) and GI toxicity-related events ($11,652 [$40,231; $1349]) (). Sepsis was the most expensive AESI subcategory with total mean (SD; mean) healthcare costs per patient at $204,151 ($412,572; $79,853) followed by other cytopenia-related events at $98,900 ($143,961; $39,777). Of the total mean cost per patient, 99% was paid by the health plan (total plan-paid: mean $196,662; median $105,353, ).
Table 2. Total, inpatient, and outpatient costs of AESI by event type during follow-up.
Table 3. Plan-paid inpatient and outpatient costs of AESI by event type during follow-up.
5. Discussion
The greatest challenge of ALL treatment is to induce complete remission and prolong overall survival with as few adverse events as possible [Citation2,Citation4,Citation7]. Prior to the approval of the innovative therapies, the approaches to improving outcomes in adults with R/R Ph− B-cell ALL involve intensification of induction chemotherapy regimens with additions of cytotoxic agents, increasing the probability of remission but at the cost of increased toxicities, hematologic recovery, and deaths in complete remission [Citation2,Citation4,Citation23]. Our study found 92.5% of the 400 relapsed Ph− B-cell ALL patients experienced at least one of the AESI within 100 days following initial hospitalization for relapse. The most frequent category of AESI was hematologic adverse event (94.6% of patients with an AESI), followed by infections (64.6%) and GI adverse events (46.2%). Hummel et al recently did an extensive review of clinical trials for adults with R/R ALL, similarly finding the most common adverse events with chemotherapy to be hematologic, followed by infections, and GI toxicities [Citation17].
To our knowledge, this is the first study to report healthcare resources and expenditures related to adverse events in relapsed Ph− B-Cell ALL. The driver of the total costs was hospitalizations, accounting for 94.3% of all costs. Nearly all patients’ (94.3%) AESI required hospitalization during the 100-day follow-up period, at a mean inpatient cost of $185,990 per patient including an average of 2 AESI-related hospitalizations comprising an average total of 32.2 inpatient days. The average expenditure per hospitalization of $92,995 and $5776 per hospitalized day are similar to results from a recent study by Barlev et al. who estimated the hospitalization burden in relapsed Ph− B-cell ALL patients [Citation26]. That study found over a similar follow-up period mean reimbursement per hospitalization was $89,663 (2014 dollars) averaging 13.1 days per stay. However, Barlev et al. estimated that an average hospitalization with chemotherapy cost $58,565 and lasted 10.8 days, which cost less and was shorter than AESI hospitalizations. The AESIs in our study are ubiquitous among patients treated with current salvage therapies and thus could be major contributors to the heavy hospitalization burden [Citation16]. The mean costs associated with AESI were estimated as $197,213 over a period of 100 days, which is high relative to other conditions. For example, Bhowmik et al. estimated that costs associated with chronic kidney disease in patients with multiple myeloma ranged between $34,754 and $78,455 per patient per year [Citation27].
The treatment landscape for adult R/R ALL has been rapidly changing since the 2014 approval of blinatumomab. Newer therapeutic approaches such as immunotherapies appear to exhibit different toxicity profiles than prior salvage regimens, with predominantly immunologic, neurologic, and hepatic toxicity but less hematologic, GI, cardiac, and renal toxicity) [Citation17]. Recent phase 3 trial results for adults with R/R Ph− B-cell ALL on blinatumomab reported significantly longer median overall survival (7.7 months vs. 4.0 months) for blinatumomab compared to standard chemotherapy as well as fewer grade 3 or higher adverse events (87% vs. 92%, respectively). Lower rates for blinatumomab than standard therapy were found in neutropenia (38% vs. 58%) and infections (34% vs. 52%), which were the most common adverse events reported in both groups although cytokine-release syndrome (CRS) was more common for blinatumomab arm [Citation20]. The phase 3 trial for antibody-drug conjugate inotuzumab reported significantly higher complete remission for inotuzumab versus standard chemotherapy (80.7% vs 29.4%) in adults with R/R B-cell ALL. Lower rates of thrombocytopenia, platelet transfusions, and febrile neutropenia were observed in the inotuzumab group than in the standard therapy group, however, higher rates of neutropenia and more hepatic adverse events, such as the potentially life-threatening veno-occlusive disease, occurred more often in the inotuzumab group (11% vs 1%) [Citation25]. A multicenter single-arm phase 2 trial for anti-CD19 chimeric antigen receptor (CAR) T-cell therapy tisagenlecleucel demonstrated high rates of overall remission among children and young adults (3–21 years) with R/R ALL, but CRS and neurologic events that occurred during the CRS or shortly after its resolution were common and often required management in the intensive care unit [Citation28]. Nonetheless, novel agents especially newer immunological treatments have shown encouraging results in R/R ALL while featuring a different toxicity profile, and are needed to improve outcomes in R/R ALL while reducing adverse events.
5.1. Limitations
There are several limitations that should be noted. This study did not include outpatient prescriptions costs associated with AESI management and so AESI-related healthcare costs presented in this study are likely to underestimate the true economic burden associated with AESIs. Administrative healthcare claims are intended to support reimbursement and thereby limit analysis in the absence of patient charts or provider attestations. The potential for misdiagnosis or misclassification of ALL and AESIs cannot be ruled out as patients were identified retrospectively through administrative claims data as opposed to medical records. Providers may not report mild events in claims data, thus possibly underestimating the rates of some AESIs. The study could not distinguish AESI due to treatment from those due to the disease itself. In addition, this study only reported on the selected adverse events (cytopenia, infection, and GI toxicities). There are published studies describing other adverse events, such as hepatic veno-occlusive disease [Citation25], cytokine-release syndrome [Citation28], central and peripheral neuropathies, and pulmonary events [Citation17]. However, few if any examined the associated costs or healthcare resource impacts [Citation29,Citation30]. In addition, costs of therapy were not examined in this study as it was outside the scope. Future studies should investigate the economic burden of these adverse events and costs of therapy to better understand the value of novel treatments. Further, due to the lack of information on types of ALL, this study excluded patients with Ph+ B-cell ALL and T-Cell ALL based on drugs used. Given that 75–80% of adult ALL patients are B-cell [Citation31] and about 75% of adult ALL are Ph− [Citation8,Citation32], using drug therapies to exclude potential T-cell and Ph+ ALL patients would result in minimal dilution of the final study sample. Finally, the MarketScan databases used for this study are convenience samples of patients with employer-sponsored healthcare coverage through contributing commercial and Medicare payers in the United States, and so findings may not be generalizable to other insured or uninsured US or international patient population.
6. Conclusion
This study found that infections, cytopenia, and GI toxicity events affect the vast majority of adult relapsed Ph− B-cell ALL patients. The economic burden associated with AESI is substantial, with infections the most expensive AESI, followed by cytopenia and GI toxicities. New therapies that can improve outcomes for adults with relapsed Ph− B-cell ALL while offering a more favorable safety profile are needed.
Key issues
This is the first study investigating the burden of adverse events of special interest (AESIs) in relapsed Philadelphia chromosome-negative (Ph−) B-cell ALL patients using large claims database. Most patients developed AESIs: 92.5% Ph− ALL patients experienced ≥1 AESI during a median 100-day follow-up, of which 64.6% had infections, 94.6% cytopenia, and 46.2% GI toxicities.
The economic burden of AESIs was substantial. Mean (SD; median) AESI-related total cost per patient during a median 100-day follow-up was $197,213 ($308,551; $105,731), with an average of two AESI-related hospitalizations comprising 32.2 inpatient days during follow-up.
Mean (SD; median) healthcare costs were highest for infection-related events ($164,461 [$347,083; $64,528]), followed by cytopenia ($125,210 [$165,141; $67,475]) and GI events ($11,652 [$40,231; $1349]).
New therapies that can improve outcomes in relapsed Ph− B-cell ALL while offering a favorable safety profile are needed.
Declaration of interest
Editorial/medical writing support for this manuscript was provided by Jay Margolis, PharmD (Truven Health Analytics, an IBM Company), funded by Amgen. Xinke Zhang and Ze Cong are employees and stockholders of Amgen, Inc. Xue Song, Lorena Lopez-Gonzalez, and Krutika Jariwala-Parikh are employees of Truven Health Analytics, an IBM Company, which received a research grant from Amgen for the overall conduct of the study and preparation of the manuscript. The authors have no other relevant affiliations or financial involvement with any organization or entity with a financial interest in or financial conflict with the subject matter or materials discussed in the manuscript apart from those disclosed.
Reviewer disclosures
Peer reviewers on this manuscript have received an honorarium from Expert Review of Pharmacoeconomics & Outcomes Research for their review work, but have no other relevant financial relationships to disclose.
Author contributions
All authors were involved in the conception and design, interpretation of the data, and critical revision of the manuscript for intellectual content. XS, LL, and KJ were involved in data analysis and the drafting of the article. All authors gave the final approval of the version to be published and all authors agree to be accountable for all aspects of the work.
Additional information
Funding
References
- Adult Acute Lymphoblastic Leukemia Treatment (PDQ(R)): Health Professional Version. PDQ Adult Treatment Editorial Board. In: PDQ cancer information summaries [Internet]. Bethesda (MD): National Cancer Institute (US); 2002; 2018 Mar 22.
- National Comprehensive Cancer Network. NCCN clinical practice guidelines in oncology: acute lymphoblastic leukemia. Version 5. 2017 [cited 2018 Jan 29]. Available from: https://www.nccn.org/professionals/physician_gls/pdf/all.pdf
- Bassan R, Gatta G, Tondini C, et al. Adult acute lymphoblastic leukaemia. Crit Rev Oncol Hematol. 2004;50(3):223–261.
- Terwilliger T, Abdul-Hay M. Acute lymphoblastic leukemia: a comprehensive review and 2017 update. Blood Cancer J. 2017;7(6):e577.
- Howlader N, Noone AM, Krapcho M, et al., editors. SEER cancer statistics review, 1975-2014: leukemia, acute lymphocytic leukemia. Age-adjusted SEER incidence. National Cancer Institute; 2017 [cited 2018 Jan 29]. Available from: https://seer.cancer.gov/csr/1975_2014/results_merged/sect_13_leukemia.pdf
- American Cancer Society. About Acute Lymphocytic Leukemia (ALL): key statistics for acute lymphocytic leukemia. 2018 [cited 2018 Jan 29]. Available from: https://www.cancer.org/cancer/acute-lymphocytic-leukemia/about/key-statistics.html
- Bassan R, Hoelzer D. Modern therapy of acute lymphoblastic leukemia. J Clin Oncol. 2011;29(5):532–543.
- National Comprehensive Cancer Network. NCCN guidelines for patients: acute lymphoblastic leukemia. Version 1. 2017 [cited 2018 Jun 5]. Available from: https://www.nccn.org/patients/guidelines/all/index.html#30/z
- Mei L, Ontiveros EP, Griffiths EA, et al. Pharmacogenetics predictive of response and toxicity in acute lymphoblastic leukemia therapy. Blood Rev. 2015;29(4):243–249.
- Brown PA, Shah B, Fathi A, et al. NCCN guidelines insights: acute lymphoblastic leukemia, version 1.2017. J Natl Compr Canc Netw. 2017;15(9):1091–1102.
- Forman SJ, Rowe JM. The myth of the second remission of acute leukemia in the adult. Blood. 2013;121(7):1077–1082.
- Lamanna N, von Hassel M, Weiss M. Relapsed acute lymphoblastic leukemia. In: Acute leukemias. Hematologic Malignancies. Springer, Berlin, Heidelberg; 2008. p. 275–279.
- Oriol A, Vives S, Hernández-Rivas J-M, et al. Outcome after relapse of acute lymphoblastic leukemia in adult patients included in four consecutive risk-adapted trials by the PETHEMA study group. Haematologica. 2010;95(4):589–596.
- Fielding AK, Richards SM, Chopra R, et al. Outcome of 609 adults after relapse of acute lymphoblastic leukemia (ALL); an MRC UKALL12/ECOG 2993 study. Blood. 2007;109(3):944–950.
- Kantarjian HM, Thomas D, Ravandi F, et al. Defining the course and prognosis of adults with acute lymphocytic leukemia in first salvage after induction failure or short first remission duration. Cancer. 2010;116(24):5568–5574.
- Pui C-H, Jeha S. New therapeutic strategies for the treatment of acute lymphoblastic leukaemia. Nat Rev Drug Discov. 2007;6(2):149–165.
- Hummel HDT, Chang MS, Chia ET, et al. Events in adults with relapsed or refractory Acute Lymphoblastic Leukemia (ALL): a literature review of recent clinical trials. J Leuk. 2016;4(1):208.
- Topp MS, Gökbuget N, Stein AS, et al. Safety and activity of blinatumomab for adult patients with relapsed or refractory B-precursor acute lymphoblastic leukaemia: a multicentre, single-arm, phase 2 study. Lancet Oncol. 2015;16(1):57–66.
- Offidani M, Corvatta L, Malerba L, et al. Infectious complications in adult acute lymphoblastic leukemia (ALL): experience at one single center. Leuk Lymphoma. 2004;45(8):1617–1621.
- Kantarjian H, Stein A, Gökbuget N, et al. Blinatumomab versus chemotherapy for advanced acute lymphoblastic leukemia. N Engl J Med. 2017;376(9):836–847.
- Schmiegelow K, Muller K, Mogensen SS, et al. Non-infectious chemotherapy-associated acute toxicities during childhood acute lymphoblastic leukemia therapy. F1000Res. 2017;6:444.
- The Leukemia & Lymphoma Society. Chimeric Antigen Receptor (CAR) T-cell therapy. 2018 [cited 2018 Jan 29]. Available from: http://www.lls.org/treatment/types-of-treatment/immunotherapy/chimeric-antigen-receptor-car-t-cell-therapy
- Daver N, O’Brien S. Novel therapeutic strategies in adult acute lymphoblastic leukemia – a focus on emerging monoclonal antibodies. Curr Hematol Malig Rep. 2013;8(2):123–131.
- Gökbuget N, Stanze D, Beck J, et al. Outcome of relapsed adult lymphoblastic leukemia depends on response to salvage chemotherapy, prognostic factors, and performance of stem cell transplantation. Blood. 2012;120(10):2032–2041.
- Kantarjian HM, DeAngelo DJ, Stelljes M, et al. Inotuzumab ozogamicin versus standard therapy for acute lymphoblastic leukemia. N Engl J Med. 2016;375(8):740–753.
- Barlev A, Lin VW, Song X. Burden of hospitalization in relapsed acute lymphoblastic leukemia. Curr Med Res Opin. 2016;32(7):1209–1212.
- Bhowmik D, Song X, Intorcia M, et al. Healthcare resource use and costs associated with chronic kidney disease in US private insurance patients with multiple myeloma. J Oncol Pharm Pract. 2018;1078155218766408. [Epub ahead of print]
- Maude SL, Laetsch TW, Buechner J, et al. Tisagenlecleucel in children and young adults with B-cell lymphoblastic leukemia. N Engl J Med. 2018;378(5):439–448.
- Bryant AL, Deal AM, Walton A, et al. Use of ED and hospital services for patients with acute leukemia after induction therapy: one year follow-up. Leuk Res. 2015;39(4):406–410.
- Garcia JB, Lei X, Wierda W, et al. Pneumonia during remission induction chemotherapy in patients with acute leukemia. Ann Am Thorac Soc. 2013;10(5):432–440.
- Chiaretti S, Zini G, Bassan R. Diagnosis and subclassification of acute lymphoblastic leukemia. Mediterr J Hematol Infect Dis. 2014;6(1):e2014073.
- Leukemia and Lymphoma Society. Ph Positive ALL Therapy. 2018 [cited 2018 Jun 5]. Available from: https://www.lls.org/leukemia/acute-lymphoblastic-leukemia/treatment/ph-positive-all-therapy