
ABSTRACT
Background
Despite reported increases in referral numbers, a large proportion of those with prediabetes still decline participation in the NHS England Diabetes Prevention Programme (NDPP). The aim of this study was to explore whether investment in interventions to improve uptake of the programme has the potential to be cost-effective.
Methods
An early cost-utility analysis was conducted using a Markov model parameterized based on secondary data sources. We explored different uptake scenarios and the impact that this had on the maximum allowable intervention price based on cost-effectiveness at the UK NICE willingness to pay threshold of £20,000 (US$ 25,913). Value of information analyses were conducted to explore the potential value of further research to resolve uncertainty at each uptake level.
Results
As uptake levels increase, the maximum allowable intervention price and overall expected value of removing decision uncertainty increases. For 5 percentage and 50 percentage points increase in uptake levels, the maximum allowable intervention price is £41.86 (US$ 54.23) and £418.59 (US$ 542.34) per person, and the overall expected value of removing decision uncertainty are £361,818,839 (US$ 468,786,625) and £1,468,712,316 (US$ 1,902,921,063) respectively.
Conclusion
There is headroom for investment in interventions that improve uptake to the NDPP, thereby allowing the programme itself to be delivered in a manner that remains cost-effective.
1. Introduction
Diabetes mellitus (DM) is a global health priority [Citation1], with 415 million known cases worldwide, of which 91% are Type 2 (T2DM) [Citation2]. The global prevalence of T2DM is anticipated to rise to 637 million by 2045 [Citation3]. In England, there are currently 3.4 million people with T2DM, which is estimated to cost the NHS £8.8 billion (US$ 11.4 billion) a year [Citation4]. The cost of treating T2DM therefore has a significant toll on health budgets, with approximately 80% of the cost spent on treatment of associated complications such as stroke, kidney failure, neuropathy, and retinopathy [Citation5].
Type 2 diabetes is preceded by a phase of impaired glucose regulation, described as prediabetes [Citation6,Citation7]. This is defined as a fasting plasma glucose (FPG) level of 5.5–6.9 mmol/l or HbA1c of 42–47 mmol/mol [Citation8]. A substantial number (up to 10%) of individuals with prediabetes progress to T2DM each year [Citation9]. In the UK, individuals with prediabetes are identified through general practice (GP) patient registers and NHS Health Checks which are offered every 5 years for 40–74-year-olds [Citation10]. Although several risk factors for prediabetes have been identified (including genetic factors, ethnicity and age), a large proportion of cases in the UK are associated with modifiable risk factors such as obesity [Citation11]. Addressing these factors implies that the burden of complications is likely to be reduced (limiting the corresponding impact of such complications on the person’s quality of life) with the potential result of reduced economic consequences on NHS resources [Citation2].
The NHS England Diabetes Prevention Programme (NDPP) has been commissioned in England to prevent or delay the onset of T2DM in adults identified as having prediabetes [Citation12]. The NDPP was informed by proven Diabetes Prevention Programme models such as the United States Diabetes Prevention Programme (US DPP) [Citation13,Citation14] and the Finnish Diabetes Prevention Programme [Citation15,Citation16]. The NDPP is a behavioral change intervention, consisting of face-to-face sessions taking place over a minimum period of 9 months, aimed at supporting participants in making lifestyle changes to reduce their risk of developing T2DM [Citation11]. Patients who have been diagnosed to be at risk by an HbA1c blood glucose test are referred to the NDPP by their GP. It is then the patient’s choice whether they take up the service. Despite reports that referrals have increased since its implementation, recent studies have reported low uptake and participation [Citation17–19]; thus, national targets remain unmet as a large proportion of those identified as having prediabetes decline to participate [Citation20]. Sex, age, socioeconomic status, mode of referral, risk communication at referral and the perceived impact of the NDPP have been highlighted as factors that affect uptake [Citation17–19]. Uptake is slightly higher among women than men, decreases with older age, lowest among those living in the most deprived areas and much higher among referrals via letters compared with consultation [Citation17–19]. Better risk communication, motivating patients, and the need for specific, more resource-intensive ‘warm’ recruitment approaches to capture the ‘right’ patients have been proposed as strategies that could benefit uptake and participation in the programme [Citation18,Citation19]. Considering the observed current trend, an increase in coverage through interventions that can potentially improve uptake to the programme is therefore likely to become a priority for the NHS because, the public health impact of a Diabetes Prevention Programme depends on participation as well as population coverage [Citation21]. Interventions that improve uptake to the NDPP may have potential economic value in themselves. Despite a lot of work done to evaluate the cost-effectiveness of interventions that improve uptake to other public health programmes [Citation22–26], the cost-effectiveness of interventions to increase uptake to the NDPP has not been explored. To the best of our knowledge, there is one study that has assessed the potential return on investment of the NDPP itself [Citation27] and a recent study that has examined the likely cost-effectiveness of a hypothetical intervention to delay progression to T2DM [Citation28] but not the potential cost-effectiveness of an intervention that increases uptake to the NDPP.
The aim of this study was to determine, via an early economic evaluation [Citation29], the cost-effectiveness of an intervention to improve uptake of NDPP and to estimate the maximum allowable intervention price based on cost-effectiveness [Citation30]. The intervention could, for example, take the form of a biomarker-based test, could be a risk score or could take the form of incentives by providing shopping vouchers for individuals that complete the programme.
2. Methods
A cost-utility analysis was conducted (using a Markov model developed in Microsoft Excel 2016) to examine the potential cost-effectiveness of an intervention to improve uptake of NDPP. The patient population considered consists of individuals identified as pre-diabetic through GP patient registers and NHS Health Checks in primary care and eligible for the NDPP but having previously declined to participate. This subpopulation – rather than everyone identified as having prediabetes – was considered in this analysis, because about 56% of the total pre-diabetic population will take up NDPP when offered to them [Citation31]. This means that giving an additional intervention to everyone would be unnecessary for those who would have taken up NDPP anyway and highlights the need to target the right patients (i.e. those who have previously declined to participate). It is worth highlighting that although these patients are being referred to as ‘decliners’, not all of them may have actually declined but could have either missed their initial NDPP appointment or are simply unaware, as highlighted by Stokes et al. [Citation18]. Thus, the assumption here is that, for those patients when NDPP is re-offered to them, a proportion of them will take up the programme in the absence of any further measures to induce uptake. The model structure was informed by a review of the published literature on intervention trials and previous model-based economic evaluations focused on T2DM prevention programmes, comprising four health states: (1) normoglycaemia (healthy FPG or HbA1c), (2) intermediate hyperglycemia (prediabetes), (3) T2DM, and (4) death (see ).
Figure 1. State transition diagram.
A lifetime time horizon was adopted in this analysis; however, we present results for a 10-year time horizon. The reasons for opting for a shorter time horizon are that Clinical Commissioning Groups (CCGs) are likely to be the main decision-makers in this context and they are more likely to be interested in the impact of an investment on shorter-term costs and outcomes [Citation32]. Annual cycles were used to reflect the natural history of the disease [Citation7]. An NHS and Personal Social Services (PSS) cost perspective was adopted, and costs and utilities were discounted at an annual discount rate of 3.5%, as recommended by NICE [Citation33]. The outcomes of the analysis are cost, quality-adjusted life years (QALYs), and net-monetary benefit (NMB), where NMB is defined for each intervention as [Citation34]
NMB = QALYs gained × willingness to pay (WTP) for a QALY – cost of the intervention
A cost-effectiveness threshold of £20,000-£30,000/QALY (US$25,913-US$38,869) was assumed in accordance with NICE recommendations [Citation33].
Sensitivity analyses (probabilistic and deterministic) were conducted to describe the impact of parameter uncertainty on the results.
2.1. Model Description
Individuals enter the model with a diagnosis of prediabetes and could remain in the same state, transition to healthy (normoglycaemia), T2DM or death. Patients who are healthy could remain in the same state, transition back to prediabetes or death but not directly to T2DM. Patients with T2DM could remain in the same state, transition back to prediabetes or death but not to the healthy state. Each cycle in the model represents 1 year of a simulated individual’s life and, at the end of a cycle, individuals could remain in the same state, progress to another state, or die. shows the health states and possible transitions.
2.2. Model assumptions
The following base case assumptions were made:
15% of the population (previous decliners) will take up NDPP when re-offered to them in the absence of any further measures to induce uptake (elicited expert opinion, explored in sensitivity analysis).
Benefits from NDPP occur in the 2 years (9–18 months as per NICE guidance) in which NDPP is given [Citation8,Citation35].
NDPP is associated with a 0.0189 increase in QALYs [Citation36].
For each arm of the analysis, the transition probability from prediabetes to T2DM (conditional on survival) is assumed to be constant. This estimate is varied in a sensitivity analysis.
There is no harm associated with NDPP.
Those with prediabetes who take up NDPP are retained in the programme until completion.
2.3. Parameterization
As detailed below, estimates for model parameters were based on the published literature and websites of government departments in the UK (e.g. Office for National Statistics).
2.3.1. Clinical and epidemiological parameters
The annual transitional probabilities (conditional on survival) were based on a meta-analysis [Citation37], a systematic review [Citation38] and a longitudinal study [Citation39]. In order to derive missing elements of the transition matrix, UK death tables were combined with estimates from the above studies. All-cause age-dependent mortality rates were determined from the Office for National Statistics in England [Citation40], with increased risk of death calculated for prediabetes and T2DM. shows the transitional probabilities used in the economic model.
Table 1. Transition matrix between health states (transition probability to death is excluded from this table because it is age dependent and, as such, not static)
2.3.2. Costs
Costs were measured in UK pound sterling (£) (for the 2018 cost year) and were informed by four sources [Citation5,Citation8,Citation41,Citation42]. All monetary values have also been reported in United States dollars (US$) in parentheses for the same cost year. In line with the assumption used in the NICE costing template, we assumed the cost of T2DM increases linearly from the time of diagnosis, to reflect the increasing cost of T2DM complications over time [Citation43]. Calculating the expected costs for the usual care arm involved, for each cycle, adding the costs of each state weighted by the proportion in the state, and then adding across cycles [Citation44]. The same principle was followed to calculate the expected costs for the NDPP arm. However, in this case, the cost of NDPP was added to the usual care costs to determine the cost per cycle for each state (for the duration of the NDPP). shows the costs used in the economic analysis.
Table 2. Model parameters and parameters of gamma and beta distributions
2.3.3. Utilities
Health-related quality of life outcomes were modeled in QALYs, taking into account both quality of life and survival. Utility estimates were informed by a cross-sectional study conducted in Sweden that used SF-36 questionnaires and converted responses using the SF-6D index to utilities [Citation46]. Given that there is as yet no publicly available direct data collected on the effectiveness of the NDPP, the analysis assumes that effectiveness will be similar to that obtained in pragmatic trials of lifestyle interventions aimed at preventing T2DM, while also undertaking sensitivity analysis around this assumption. The relative effectiveness of the NDPP was modeled by applying relative risk to the rate of progression to diabetes. Incremental utility associated with NDPP was drawn from the USDPP [Citation36]. Calculating the expected utility for the usual care arm involved, for each cycle, adding the utilities of each state weighted by the proportion in the state, and then adding across cycles. Following the same principle, the expected utility for the NDPP arm was calculated. However, in this case, incremental utilities associated with NDPP were added to the usual care utilities for each state (for the duration of the NDPP). also shows the utilities used in the economic analysis.
2.4. Analyses
Given this is an early economic evaluation, it is useful to draw insights on the maximum price for an intervention that improves uptake to NDPP. Headroom analysis (i.e. the maximum allowable intervention price at which it is still considered cost-effective) was conducted using NMB [Citation47], at various uptake levels using a WTP threshold of £20,000/QALY (US$ 25,913). For each uptake level considered, outputs from both the deterministic analysis and probabilistic sensitivity analysis (PSA) were used.
Probabilistic sensitivity analysis was undertaken to characterize the decision uncertainty and test the robustness of parameter estimates [Citation48]. Where possible, distributions were attached to probabilities, utilities and costs in the model. Beta distributions were attached to probabilities and utilities, and gamma distributions were attached to costs. The model was run for 10,000 iterations, each time randomly selecting a value for each parameter from their respective distributions. Mean costs and QALYs were calculated by averaging across all 10,000 iterations. also shows the distribution assigned to each model parameter.
Value of information (VOI) analysis was conducted to provide insights into the potential value of reducing uncertainty by conducting further research. For each uptake level examined, VOI analysis was conducted for the maximum price estimated at that uptake level. The overall value of reducing uncertainty for each uptake level is presented using the expected value of perfect information (EVPI). In VOI analysis, insight into the parameters that cause the most decision uncertainty and the potential value of reducing the uncertainty by collecting more data were examined using expected value of partial perfect information (EVPPI). In this study, EVPPI was estimated for each uptake level using SAVI (Sheffield Accelerated Value of Information) [Citation49]. The number of patients considered to be affected by the decision annually is 1,099,104 [Citation50,Citation51].
3. RESULTS
3.1. Headroom Analysis Using Net Monetary Benefit
As shown in , at a WTP threshold of £20,000/QALY (US$ 25,913) and for 5 percentage points increase in uptake of NDPP, the intervention can be priced up to £41.86 (US$ 54.23) per person and still allow the NDPP to be delivered in a manner that remains cost-effective. The figures for the other uptake levels are presented in the Appendix. The maximum price at which the intervention can be priced and still allow the NDPP to be delivered in a cost-effective manner are summarized in for all the uptake levels considered. The results show that, as uptake levels increase, the headroom increases. Adopting a lifetime time horizon increases the maximum allowable intervention price at all uptake levels considered. Taking into account the uncertainty around each parameter in the model in a probabilistic sensitivity analysis produced slightly lower maximum price estimates.
Figure 2. Headroom for 5% points increase in uptake of NDPP.
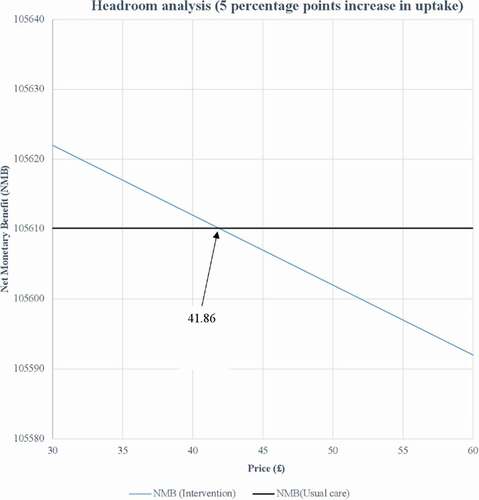
Table 3. Summary of headroom price for different uptake levels
3.2. Value of Information Analysis
As shown in , at the WTP threshold adopted and for 5 percentage points increase in uptake of NDPP, the overall EVPI for the specified decision relevance time horizon of 10 years is £361,818,839 (US$ 468,786,625). Driving this high value is the high number of patients affected by the decision annually. The figures for the other uptake levels are presented in the Appendix. gives a summary of per person EVPI and the overall EVPI for each of the uptake levels considered in this analysis. The results show that, as uptake levels increase, the overall expected value of removing decision uncertainty increases.
Figure 3. VOI analysis results for a 5 percentage points increase in uptake of NDPP.
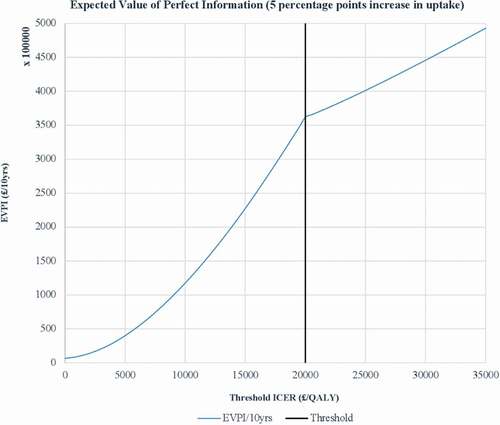
Table 4. Summary of per person EVPI and overall EVPI for different uptake levels
shows the summary of the single-parameter EVPPI for different uptake levels at the WTP threshold adopted with a time horizon of 10 years. As shown in the table, regardless of the uptake level considered, all the model parameters are noted to contribute to the overall decision uncertainty. For 5 percentage and 10 percentage points increase in uptake, it is noted that the parameter causing most of the decision uncertainty in both scenarios is the percentage of NDPP uptake (when reoffered), whereas incremental utility associated with NDPP and usual care cost per cycle for the healthy state are the parameters causing the least uncertainty respectively. However, for the rest of the uptake levels considered, it is noted that utility associated with T2DM state is the parameter causing most of the decision uncertainty and, cost per cycle for the healthy state is the parameter causing the least uncertainty. shows the single parameter EVPPI for 5 percentage points increase in uptake. The figures for the other uptake levels are presented in the Appendix. Adopting a lifetime time horizon increases the EVPI and EVPPI at all uptake levels considered.
Figure 4. Single parameter EVPPI for a 5 percentage points increase in uptake of NDPP.
Table 5. Summary of single-parameter EVPPI for different uptake levels
4. DISCUSSION
Using an early model-based economic evaluation, this study sought to examine whether investment in interventions to improve uptake of the NDPP has the potential to be cost-effective. A particular focus of this evaluation was to gain insights into the maximum allowable intervention price at each uptake level considered required for the NDPP to still be delivered in a manner that remains cost-effective and the potential value of further research to resolve uncertainty at each uptake level.
In an era of ever-increasing demand to demonstrate value for money, innovators can no longer assume that interventions developed will be adopted and funded. Thus, research and development of new interventions should always be driven by considerations of value to payers of health care and early economic evaluation has much conceptual attractiveness in this regard [51]. Early economic evaluation is a useful tool that can be used by innovators to demonstrate the value of a new intervention to payers and to understand the expected commercial viability, the risks, and the potential return on investment in the intervention.
The headroom analysis shows the maximum price at which the intervention can be priced and still be considered cost-effective for the different uptake levels considered. For example, it is noted that for 5 percentage points increase in NDPP uptake, the intervention can be priced up to £41.86 (US$ 54.23) per person and still allow the NDPP to be delivered in a manner that remains cost-effective. Thus, if this price is not consistent with an acceptable return on investment (at this uptake level), then resources should not be committed to the further development of the intervention. The same principle applies to the other uptake levels considered in this analysis. Furthermore, it is noted from the headroom analysis that as uptake levels increase, the maximum price at which the intervention can be priced also increases. For example, for 10 percentage points increase in uptake of NDPP, the intervention can be priced up to £83.72 (US$ 108.47) per person and, for 50 percentage points increase in uptake of NDPP, the intervention can be priced up to £418.59 (US$ 542.34) per person. Thus, it can be concluded that an innovator will gain most from the intervention at higher uptake levels. However, it is worth stating that in the case of this analysis, although potentially there is a greater chance of a return on investment at a higher price, it also increases the likelihood of rejection on budget impact grounds. It is also noted from the headroom analysis that although both approaches used in estimating the headroom produced similar results, the results obtained from using the PSA outputs were slightly lower. This is quite intuitive considering the fact that the deterministic model takes no account of uncertainty in model parameters.
It is worth mentioning that it was not our intention with this analysis to evaluate any one intervention aimed at increasing the NDPP participation rate in previous programme decliners. However, given the issues with participation rates and the subsequent impact on the cost-effectiveness of such programmes, the benefits of conducting such an analysis is that it provides an idea of the price an intervention would have to fall under to have an acceptable cost-effectiveness profile. We acknowledge that there is an additional step needed to translate our acceptable price estimates to the cost of a new intervention depending on the form of the intervention, how it is going to be delivered and for how long.
It is shown in the VOI analysis that for the specified decision relevance time horizon of 10 years adopted in this study and for 5 percentage points increase in uptake of NDPP, the overall expected value of removing decision uncertainty when the intervention is £41.86 (US$ 54.23) per person is £361,818,839 (US$ 468,786,625). This implies that any further research exercise to resolve uncertainty costing more than this amount will not represent a cost-effective use of resources. Furthermore, the VOI analysis shows that, as uptake levels increase, the overall expected value of removing decision uncertainty increases. For example, for 10 percentage points increase in uptake, the expected value of removing decision uncertainty is £444,717,279 (US$ 576,193,083) and, for 50 percentage points increase in uptake, the expected value of removing decision uncertainty is £1,468,712,316 (US$ 1,902,921,063). From these values, it can be concluded that there is potential value in resolving uncertainty (with increasing value at higher uptake levels) as any research on further data collection are not likely to cost more than the estimated values.
The single-parameter EVPPI results show that all model parameters contribute to the decision uncertainty. It is noted that for the majority of uptake levels considered, the parameter causing most of the uncertainty is the utility associated with T2DM state. The EVPPI results demonstrate where future research should be focused. It is important to recognize that these values for EVPI and EVPPI are upper bounds, and form limit values to guide only whether further research may be cost-effective, rather than guarantee that it necessarily is. Adopting a lifetime time horizon increases the maximum allowable intervention price as well as EVPI and EVPPI at all uptake levels considered.
Early economic evaluation has potentially profound advantages for innovators and its implementation will promote efficiency from the outset of the development of a new intervention [Citation29]. However, conducting economic evaluations so early in the evidence pipeline means that there are often limitations and/or uncertainties associated with some of the data used to parameterize the model. For example, where primary data is lacking, elicited expert opinion may be relied upon for model parameterization. It is important therefore to explore the impact of these parameters on the cost-effectiveness argument via sensitivity analyses. Here, a key driver of decision uncertainty was the proportion of pre-diabetics who would take up NDPP if it was re-offered to them, an estimate based on expert opinion.
4.1. Strengths and limitations of the study
To the best of our knowledge, this is the first study that has focused on evaluating the potential cost-effectiveness of interventions to increase uptake to the NDPP. Another strength of this analysis is the use of multiple sources of evidence to parameterize a full model-based economic evaluation including systematic reviews, meta-analyses, and other economic models. Furthermore, it highlights the usefulness of using the early economic evaluation to explore the headroom for a new intervention and potential price-points.
Owing to the timing of this evaluation in the evidence pipeline, some of the data used to parameterize the model are associated with considerable uncertainty. This is accounted for within the analysis via the probabilistic sensitivity analysis.
5. Conclusion
This analysis explored whether there is headroom for investment in interventions that improve uptake to the NDPP. The results demonstrate that there is room for investment, and the maximum price increases as the potential effectiveness of the intervention increases (i.e. improvement in NDPP uptake levels). The estimated maximum price that the intervention can be priced and still allow the NDPP to be delivered in a manner that remains cost-effective for 5 percentage and 50 percentage points increase in uptake of NDPP are £41.86 (US$ 54.23) and £418.59 (US$ 542.34) per person, respectively. The analysis shows further that, as uptake levels increase, the overall expected value of removing decision uncertainty increases.
Declaration of interest
The authors have no other relevant affiliations or financial involvement with any organization or entity with a financial interest in or financial conflict with the subject matter or materials discussed in the manuscript apart from those disclosed.
Reviewers Disclosure
Peer reviewers on this manuscript have no relevant financial relationships or otherwise to disclose.
Author contributions
All study authors meet the criteria for authorship as outlined by the journal policy.
Complying with ethics of experimentation
Ethical approval was not needed.
Consent
Participatory consent was not needed.
Using third-party material
All figures and tables submitted are original
Supplemental Material
Download PDF (218.4 KB)Acknowledgments
The research was supported by the National Institute for Health Research (NIHR) infrastructure at Leeds. The views expressed are those of the author(s) and not necessarily those of the NHS, the NIHR or the Department of Health. We also acknowledge the contributions from organizations (and individuals within) that formed part of the wider partnership involved in this work: Leeds City Council (Hanna Kaye, Diane Burke, Lucy Jackson); Leeds Academic Health Partnership (Paul Stewart, Sarah Brondson); Leeds GP Confederation/Leeds Community Healthcare Trust (Ruth Burnett); and Leeds Clinical Commissioning Group (Bryan Power, Jason Broch).
Supplementary material
Supplemental data for this article can be accessed here.
Additional information
Funding
References
- Neumann A, Schwarz P, Lindholm L. Estimating the cost-effectiveness of lifestyle intervention programmes to prevent diabetes based on an example from Germany: Markov modelling. Cost Eff Resour Allocation. 2011 Dec;9(1):17.
- Roberts S, Barry E, Craig D, et al. Preventing type 2 diabetes: systematic review of studies of cost-effectiveness of lifestyle programmes and metformin, with and without screening, for pre-diabetes. BMJ Open. 2017 Nov 1;7(11):e017184.
- Statista. Estimated number of diabetics worldwide in 2019 and 2045. 2019. [Online]. [cited 2020 Jan 15]. Available from: https://www.statista.com/statistics/271442/number-of-diabetics-worldwide/. Accessed 2020 Jan 15
- NHS England. NHS Diabetes Prevention Programme (NHS DPP). 2019. [ONLINE]. [cited 2019 Dec 16]. Available from: https://www.england.nhs.uk/diabetes/diabetes-prevention/
- Hex N, Bartlett C, Wright D, et al. Estimating the current and future costs of type 1 and type 2 diabetes in the UK, including direct health costs and indirect societal and productivity costs. Diabetic Med. 2012 Jul;29(7):855–862.
- Gillies CL, Lambert PC, Abrams KR, et al. Different strategies for screening and prevention of type 2 diabetes in adults: cost effectiveness analysis. Bmj. 2008 May 22;336(7654):1180–1185.
- Palmer AJ, Tucker DM. Cost and clinical implications of diabetes prevention in an Australian setting: a long-term modeling analysis. Prim Care Diabetes. 2012 Jul 1;6(2):109–121.
- National Institute of Clinical Excellence. Preventing type 2 diabetes: risk identification and interventions for individuals at high risk. 2012. [Online]. [cited 2019 Jul 1]. Available from: https://www.pennine-gp-training.co.uk/res/Diabetes%20screening%20NICE.pdf.
- Mainous AG, Tanner RJ, Baker R, et al. Prevalence of prediabetes in England from 2003 to 2011: population-based, cross-sectional study. BMJ Open. 2014 May 1;4(6):e005002.
- NHS England. NHS health check. [ONLINE]. [cited 2019 Jul 15]. Availablefrom: https://www.nhs.uk/conditions/nhs-health-check/.
- Herman WH. The cost-effectiveness of diabetes prevention: results from the diabetes prevention program and the diabetes prevention program outcomes study. Clin Diabetes Endocrinol. 2015Dec1;1(1):9.
- NHS England. NHS Diabetes Prevention Programme overview and FAQ. [Online]. [cited 2019 Jun 7]. Available from: https://www.england.nhs.uk/wp-content/uploads/2016/08/dpp-faq.pdf.
- Diabetes Prevention Program Research Group. 10-year follow-up of diabetes incidence and weight loss in the diabetes prevention program outcomes study. Lancet. 2009 Nov 14; 374(9702):1677–1686.
- Knowler WC, Barrett-Connor E, Fowler SE, et al.; Diabetes Prevention Program Research Group. Reduction in the incidence of type 2 diabetes with lifestyle intervention or metformin. N Engl J Med. 2002;346:393–403.
- Tuomilehto J, Lindström J, Eriksson JG, et al. Prevention of type 2 diabetes mellitus by changes in lifestyle among subjects with impaired glucose tolerance. N Engl J Med. 2001 May 3;344(18):1343–1350.
- Lindström J, Ilanne-Parikka P, Peltonen M, et al. Sustained reduction in the incidence of type 2 diabetes by lifestyle intervention: follow-up of the Finnish Diabetes Prevention Study. Lancet. 2006 Nov 11;368(9548):1673–1679.
- Penn L, Rodrigues A, Haste A, et al. NHS diabetes prevention programme in England: formative evaluation of the programme in early phase implementation. BMJ Open. 2018 Feb 1;8(2). https://doi.org/10.1136/bmjopen-2017-019467.
- Stokes J, Gellatly J, Bower P, et al. Implementing a national diabetes prevention programme in England: lessons learned. BMC Health Serv Res. 2019 Dec;19(1):1–2.
- Rodrigues AM, Haste A, Penn L, et al. Stakeholders’ perceptions and experiences of the National Health Service diabetes prevention programme in England: qualitative study with service users, intervention providers and deliverers, commissioners and referrers. BMC Health Serv Res. 2020 Dec;20(1):1–3.
- Barron E, Clark R, Hewings R, et al. Progress of the Healthier You: NHS Diabetes Prevention Programme: referrals, uptake and participant characteristics. Diabetic Med. 2018 Apr;35(4):513–518.
- Aziz Z, Absetz P, Oldroyd J, et al. A systematic review of real-world diabetes prevention programs: learnings from the last 15 years. Implement Sci. 2015 Dec;10(1):172.
- Thompson B, Thompson LA, Andersen MR, et al. Costs and cost-effectiveness of a clinical intervention to increase mammography utilization in an inner city public health hospital. Prev Med. 2002 Jul 1;35(1):87–96.
- Gannon M, Dowling M. Increasing the uptake of cervical screening programmes. British Journal of Nursing. 2008 Nov 13;17(20):1280–1284.
- Shankleman J, Massat NJ, Khagram L, et al. Evaluation of a service intervention to improve awareness and uptake of bowel cancer screening in ethnically-diverse areas. Br J Cancer. 2014 Sep;111(7):1440–1447.
- Tsiachristas A, Gittins M, Kitchener H, et al. Cost-effectiveness of strategies to increase cervical screening uptake at first invitation (STRATEGIC). J Med Screen. 2018 Jun;25(2):99–109.
- Filby A, Lewis L, Taylor M. An economic evaluation of interventions to improve the uptake of vitamin D supplements in England and Wales. In: PH56. National institute for health and care excellence. York Health Economics Consortium; 2014.
- Thomas C, Sadler S, Breeze P, et al. Assessing the potential return on investment of the proposed UK NHS diabetes prevention programme in different population subgroups: an economic evaluation. BMJ Open. 2017 Aug 1;7(8):e014953.
- Leal J, Reed SD, Patel R, et al. Benchmarking the cost-effectiveness of interventions delaying diabetes: a simulation study based on NAVIGATOR data. Diabetes Care. 2020;43(10):2485–2492.
- Abel L, Shinkins B, Smith A, et al. Early economic evaluation of diagnostic technologies: experiences of the NIHR diagnostic evidence co-operatives. Med Decis Mak. 2019 Oct;39(7):857–866.
- Faria R, Walker S, Whyte S, et al. How to invest in getting cost-effective technologies into practice? A framework for value of implementation analysis applied to novel oral anticoagulants. Med Decis Mak. 2017 Feb;37(2):148–161.
- Howarth E, Bower PJ, Kontopantelis E, et al. ‘Going the distance’: an independent cohort study of engagement and dropout among the first 100 000 referrals into a large-scale diabetes prevention program. BMJ Open Diabetes Res Care. 2020Dec1;8(2):e001835.
- Hinde S, Horsfield L, Bojke L, et al. The relevant perspective of economic evaluations informing local decision makers: an exploration in weight loss services. Appl Health Econ Health Policy. 2019 Dec;4:1–6.
- National Institute for Health and Care Excellence. Guide to the methods of technology appraisal. 2013. [Online]. [cited 2019 Jun 3]. Available from: https://www.nice.org.uk/process/pmg9/resources/guide-to-the-methods-of-technology-appraisal-2013-pdf2007975843781.
- Gray AM, Clarke PM, Wolstenholme JL, et al. Applied methods of cost-effectiveness analysis in healthcare. Oxford University Press; 2011.
- Roberts S, Craig D, Adler A, et al. Economic evaluation of type 2 diabetes prevention programmes: Markov model of low-and high-intensity lifestyle programmes and metformin in participants with different categories of intermediate hyperglycaemia. BMC Med. 2018 Dec;16(1):16.
- Herman WH, Hoerger TJ, Brandle M, et al. The cost-effectiveness of lifestyle modification or metformin in preventing type 2 diabetes in adults with impaired glucose tolerance. Ann Intern Med. 2005 Mar 1;142(5):323–332.
- Morris DH, Khunti K, Achana F, et al. Progression rates from HbA 1c 6.0–6.4% and other prediabetes definitions to type 2 diabetes: a meta-analysis. Diabetologia. 2013;56(7):1489–1493.
- Balk EM, Earley A, Raman G, et al. Combined diet and physical activity promotion programs to prevent type 2 diabetes among persons at increased risk: a systematic review for the community preventive services task force. Ann Intern Med. 2015 Sep 15;163(6):437–451.
- Meigs JB, Muller DC, Nathan DM, et al. The natural history of progression from normal glucose tolerance to type 2 diabetes in the Baltimore Longitudinal Study of Aging. Diabetes. 2003 Jun 1;52(6):1475–1484.
- Office of National Statistics. National life tables UK. 2018. [Online]. [cited 2019 Aug 5]. Available from: https://www.ons.gov.uk/peoplepopulationandcommunity/birthsdeathsandmarriages/lifeexpectancies/datasets/nationallifetablesunitedkingdomreferencetables.
- Nichols GA, Arondekar B, Herman WH. Medical care costs one year after identification of hyperglycemia below the threshold for diabetes. Med Care. 2008 Mar;1(3):287–292.
- Bächle C, Claessen H, Andrich S, et al. Direct costs in impaired glucose regulation: results from the population-based Heinz Nixdorf Recall study. BMJ Open Diabetes Res Care. 2016 May 1;4(1):e000172.
- National Institute of Clinical Excellence. Preventing type 2 diabetes: risk identification and interventions for individuals at high risk. Costing template. 2012. [Online]. [cited 2019 Jul 15]. Available from: https://www.nice.org.uk/guidance/ph38/resources.
- Briggs A, Sculpher M, Claxton K. Decision modelling for health economic evaluation. Oxford University Press, Oxford; 2006 Aug 18.
- Ashra NB, Spong R, Carter P, et al. A systematic review and meta-analysis assessing the effectiveness of pragmatic lifestyle interventions for the prevention of type 2 diabetes mellitus in routine practice. London: Public Health England; 2015 Aug.
- Neumann A, Schoffer O, Norström F, et al. Health-related quality of life for pre-diabetic states and type 2 diabetes mellitus: a cross-sectional study in Västerbotten Sweden. Health Qual Life Outcomes. 2014 Dec 1;12(1):150.
- Sutton AJ, Lamont JV, Evans RM, et al. An early analysis of the cost-effectiveness of a diagnostic classifier for risk stratification of haematuria patients (DCRSHP) compared to flexible cystoscopy in the diagnosis of bladder cancer. PloS One. 2018;13(8).
- Briggs AH, Weinstein MC, Fenwick EA, et al. Model parameter estimation and uncertainty analysis: a report of the ISPOR-SMDM modeling good research practices task force working group–6. Med Decis Mak. 2012 Sep;32(5):722–732.
- Strong M, Oakley JE, Brennan A. Estimating multiparameter partial expected value of perfect information from a probabilistic sensitivity analysis sample: a nonparametric regression approach. Med Decis Mak. 2014 Apr;34(3):311–326.
- National Institute for Health and Care Excellence. 2017. Putting NICE guidance into practice. Resource impact template: type 2 diabetes: prevention in people at high risk (PH38). [Online]. {cited 2019 Oct 16]. Available from: https://www.nice.org.uk/guidance/ph38/resources.
- Frempong SN, Sutton AJ, Davenport C, et al. Early economic evaluation to identify the necessary test characteristics of a new typhoid test to be cost Effective in Ghana. PharmacoEconomics-open. 2020 Mar;4(1):143–157.