
ABSTRACT
Objectives
Anorexia Nervosa (AN) is a severe psychiatric disorder and knowledge about the cost-effectiveness of potential interventions is limited. The aim of this paper is to introduce the Trimbos Institute health economic cost-effectiveness model for Anorexia Nervosa (AnoMod-TI), a flexible modeling tool for assessing the long-term cost-effectiveness of interventions for AN in late adolescent and adult patients, which could support clinical decision making.
Methods
AnoMod-TI is a state-transition cohort simulation (Markov) model developed from a Dutch societal perspective, which consists of four health states – namely full remission (FR), partial remission (PR), AN and death. Results are expressed as total healthcare costs, QALYs and incremental cost-effectiveness ratio.
Results
For the purpose of demonstrating AnoMod-TI and how it could be used to estimate cost-effectiveness over a 20-year time horizon, it was applied to a hypothetical treatment scenario. Results illustrate how a relatively costly intervention with only modest effects can still be cost-effective in the long term.
Conclusions
AnoMod-TI can be used to examine long-term cost-effectiveness of various interventions aimed at either treating AN or preventing relapse from a state of partial or full remission. AnoMod-TI is freely available upon request to the authors.
1. Introduction
Anorexia Nervosa (AN) is a severe eating disorder (ED) characterized by extreme weight loss and a variety of health problems arising from malnutrition [Citation1,Citation2]. While AN can manifest across all genders and age groups, adolescent girls and young women are particularly at risk [Citation3,Citation4]. Early adolescent onset, early treatment and early response are all associated with a favorable outcome, whereas the risk of an enduring and/or severe disease course typically increases as core symptoms persist or in the case of prepubescent or adult onset [Citation2].
Many patients go on to develop a protracted disease course, and the associated mortality rate is among the highest of all psychiatric illnesses [Citation3]. AN places a high burden on patients, their families and society [Citation5]. Health related quality of life is low [Citation6], and costs incurred through healthcare resource use, education and productivity losses are substantial [Citation7]. The lifetime prevalence of AN in women is ranging from less than 1 to 4% [Citation8]. High per-patient costs, combined with the considerable risk of chronicity and how the disorder disproportionately affects the young, means that AN comes at a high cost to society [Citation9,Citation10].
Current treatments for AN are largely psychological, combined with nutritional rehabilitation [Citation11]. For younger, adolescent patients, family based interventions have had promising results [Citation12,Citation13], though with limited evidence for its superiority relative to other treatments [Citation14]. For adult patients, low remission rates, and high levels of attrition and relapse suggest that current treatment options in general are sub-optimal [Citation11]. However, the last decade has seen great advances in evidence-base on treatments for AN, with several large trials investigating a variety of new interventions [Citation11].
Nevertheless, under restricted budgets, the economic impact of potential new treatments must also be considered. This requires that the cost-effectiveness (CE) of interventions is assessed, together with the associated consequences of their implementation on the healthcare budget. For decision- and policymakers, such information can provide valuable insights on the implications of adopting new treatments. One way of attaining this information is to develop a health economic model, which synthesizes available evidence.
Overall, the evidence base on the CE of potential interventions for AN is limited – while both unmet treatment needs and the potential for substantial cost savings at the population level remain high [Citation5,Citation9]. As far as the authors are aware, only two health economic models are available in the current literature that looks at AN specifically [Citation15,Citation16]. There are also two CE models where AN is included with other EDs. However, as these focus on screening [Citation17] and prevention [Citation18], they might not be suitable for modeling interventions targeting patients already diagnosed with AN.
As for the two AN specific CE models, both are subject to limitations that might make them less ideal for modeling CE beyond the clinical context for which they were intended. The cost-modeling analysis by Crow and Nyman [Citation15] only measures effectiveness in terms of mortality and does not provide any estimates of uncertainty around its results. Le et al. [Citation16] provide a transparent and reproducible Markov model for estimating the CE of a family based intervention for AN. However, as this model is highly specific, in that it targets only adolescent girls with AN of short duration, it might not be applicable to older or more general cohorts of patients with AN. Moreover, it might also lack the flexibility to model a large variety of potential interventions.
Flexible health economic models have previously been developed for other psychiatric conditions, such as depression [Citation19] and psychosis [Citation20], and could represent promising tools for making CE analyses more accessible. With the growing demand for transparent and comparative CE estimates for interventions targeting EDs [Citation21], we propose that a flexible, user-friendly CE model for AN could be a useful addition to future research.
The aim of this paper is to introduce the Trimbos Institute cost-effectiveness model for Anorexia Nervosa (AnoMod-TI), a flexible modeling tool for assessing the CE of interventions for AN – and to do so in a comprehensive and transparent manner. Here we describe the process of developing the model, following, where applicable, the consolidated health economic evaluation reporting standards statement (CHEERS) [Citation22]. AnoMod-TI will also be demonstrated by estimating the CE of a hypothetical treatment example for patients with AN.
2. Development of the model
AnoMod-TI assumes a Dutch viewpoint and, in accordance with the Dutch guidelines for pharmacoeconomic research [Citation23], adopts a societal perspective. The Markov model approach [Citation24–26], also known as state transition modeling, was considered appropriate for the purpose of modeling long-term AN and was therefore adopted as the underlying model structure of AnoMod-TI. Markov modeling is a popular approach to decision analysis and can be a powerful tool for economic evaluation of healthcare interventions. It consists of exhaustive and mutually exclusive health states, through which notional patients move via a transition probability matrix.
The guidelines for good research practice for health economic modeling from the International Society for Pharmacoeconomics and Outcomes Research (ISPOR) [Citation27] informed the process of further developing the model.
2.1. Model design and structure
The clinical staging model developed by Steinglass et al. [Citation28] was our primary source for conceptualizing the disease course of AN. Based on further review of the clinical literature, in tandem with expert interviews, the conceptual structure of AnoMod-TI was simplified to the point where it could be supported with epidemiological evidence – while still maintaining a satisfying level of face validity, as determined by three experts with extended experience from both clinical practice and research in the field of AN.
The clinical staging model developed by Steinglass et al. [Citation28] identifies six distinct stages of AN: subsyndromal, early full syndrome, full syndrome, partial remission, persistent AN and remission. It does not include recovery. Although there is no hard-line distinction between remission and recovery in the current research literature on ED, it was found central, for the purposes of transparency, to attempt some differentiation between these categories in developing this model. In general, recovery implies a sustained period of symptom absence after which treatment can be discontinued or focused on prevention of subsequent episodes [Citation29]. Psychiatric recovery can be difficult to operationalize [Citation29], and remains in a developing stage in the field of AN [Citation30,Citation31]. While many patients with AN can reach an extended period of considerable improvement, many still experience long-term residual symptoms [Citation30,Citation32–34].
Given the problematic nature of recovery as an outcome category, it might be more appropriate to classify meaningful improvements in AN symptomatology only at the level of remission, which typically does not imply any discontinuation of treatment or require any arbitrary classification of when long-term absence of symptoms becomes absence of illness. Based on this, as well as consensus from experts, it was decided to not include recovery as a possible outcome in AnoMod-TI, and instead only focus on remission. The omission of recovery differentiated our model from other Markov models of AN [Citation16,Citation18].
Another important detail carried forward from the work by Steinglass et al. [Citation28], was the centrality of including both partial remission and remission in the clinical staging model. Arguably, this gradation avoids potential conflation of slight or temporary improvement with reliable and more persistent change (or vice versa) – while also avoiding the issue of recovery. This distinction was incorporated in AnoMod-TI through the inclusion of two levels of remission – partial (PR) and full remission (FR). The final conceptual structure underlying AnoMod-TI can be viewed in .
Figure 1. Conceptual model.
The conceptual model was actualized using Microsoft® Excel® (release 16.5) for Microsoft (Microsoft Corporation, Seattle, WA, USA). AnoMod-TI is designed to run two treatment arms (cohorts) in parallel (comparator and intervention) for which outcomes are then compared. Users are free to enter relevant data (i.e. treatment costs, effectiveness relative to relevant control group) for any alternative intervention for which they want to assess CE (relative to the comparator). The intervention runs on top of the comparator, meaning that as long as no additional input is provided for the intervention, all incremental outcome measures (i.e. the difference between intervention and comparator) will be zero. See section 2.2.1 for a detailed overview of the parameters constituting the model. In clinical terms, these represent our assumptions about the effectiveness of the comparator treatment.
Out of the box, each cohort of AnoMod-TI is populated by (1000) patients who have received clinical treatment but who still qualify for AN and who receive clinical treatment. As such, all patients start in the AN stage. In the first cycle, patients can either stay in the AN stage, or transition to either PR, FR or death (D). In all subsequent cycles, it is also possible to stay in PR, FR or D; to move from PR to FR; to move from PR or FR to D; to move backwards from FR to PR, FR to AN or PR to AN (see supplementary material). Any intervention added to the model will affect the transition probability between states and outcome is calculated by valuing the time in each state (see also section 2.2 and 2.4).
The simulated cohort starts at age 18, in line with the mean age of onset reported by Volpe et al. [Citation35]. Cycle length is six months. Due to the sparsity of long-term data on which to validate model outcome, time-horizon was set to twenty years. Given the relatively short cycle length, a half-cycle correction was not applied. Experts agreed that twenty years would be sufficient to capture costs and effects of interventions targeting AN.
2.2. Model parameters
As is common in decision-analytic modeling, model parameters were obtained from several different sources [Citation36]. Data regarding transition probabilities from one health state to another, as well as the quality of life associated with each health state, was obtained from existing literature. Cost estimates were based on existing literature and expert input. As an estimation of the validity of input data obtained from existing literature, expert’s opinions about the quality and transferability of the data (to the Dutch context) was elicited. All expert input were elicited through semi-structured interviews.
2.2.1. Transition probabilities
Khalsa et al. [Citation37] have developed a framework of standardized criteria for relapse, recovery and remission in AN, which has attracted support by other researchers in the field [Citation38]. This framework was adopted as a guideline for selecting epidemiological data to populate the model ().
Table 1. Model characteristics.
Table 2. Annual cost and utility values associated with each health state.
A study by Kordy et al. [Citation39], which reported longitudinal data (2.5 years) on 233 AN patients following clinical treatment, was found to be one of the few large European clinical studies of good quality (as determined by Khalsa et al. [Citation37]) that relied on similar operationalizations as recommended by Khalsa et al. [Citation37] – and was chosen as primary source for estimating all transition probabilities from the state AN (except AN to D).
Probabilities of dying (transitions to D) were modeled according to age specific mean mortality rates and estimated based on general mortality statistics in the Netherlands [Citation40]. Excess mortality probability of AN was based on the standardized mortality ratio (SMR) reported by Arcelus et al. [Citation41]. It was assumed that the excess mortality probability would only apply to the state of AN, and not for patients in any of the remission states.
A cohort study by Berends et al. [Citation42], in which 83 weight-restored AN patients enrolled in a relapse prevention program were followed for 18 months, was used to estimate the probabilities of transitioning back (relapsing) from FR to either PR or AN. The probability of transitioning back from PR to AN, was estimated based on Kordy et al. [Citation39].
As the majority of relapse occurs in the first two years following clinical treatment [Citation38], some adjustment of the modeled relapse probabilities in subsequent years was required. There is a sparsity of more recent studies that have documented AN relapse beyond the first few years following treatment. Based on expert input, and studies looking at relapse rates over time [Citation43,Citation44], it was assumed that all relapse probabilities following the second year would be reduced by between 70–90%.
Similarly, as we had no empirical evidence for this, expert input was also sought to determine an adjusted estimate for the probability of transitioning from PR to FR. Expert input and consensus suggested that the probability of PR to FR would likely be around twice that of transitioning from AN to FR. We had no reason to assume that this general adjustment would be different across time.
Taking the expert input as a starting-off point, the final transition probabilities for both PR to FR and of transitioning backwards from PR or FR after two years were calibrated using weights (see for final estimates and corresponding standard errors), which were incrementally adjusted until outcomes at 20 years mapped, as close as possible, on to those reported by Fichter et al. [Citation33] (see section 2.3 below). These weights can be easily adjusted by users of AnoMod-TI.
2.2.2. Costs and utilities
In accordance with the Dutch guidelines for pharmacoeconomic research, a societal perspective was adopted; and costs and effects were discounted at 4% and 1.5% respectively [Citation23]. All costs are expressed in 2021 euros, based on unit cost prices reported in the Dutch guidelines for economic research [Citation45].
Due to a sparsity of relevant data, expert input was the main source for estimating healthcare system use, and thereby costs of patients with AN in the Dutch context. Experts provided a mean, minimum and maximum estimate for units of annual resource use (e.g. mean, minimum and maximum number of annual visits to a psychiatrist or days in hospital; a parameter which could then be used to estimate a BETA-pert distribution; see section 2.4.1. below) among Dutch patients with AN and patients in FR or PR. Healthcare system costs were then calculated by multiplying these estimates with unit cost prices from the Dutch guidelines [Citation45] and converted to half-year estimates. Both resource use estimates, as well as unit cost prices, can be easily adjusted by users of AnoMod-TI.
Due to a lack of evidence, no patient and family costs were included in the model. However, future users of AnoMod-TI are free to include their own estimates of these costs, as the cost category is still included in the model structure, just left empty for the current demonstration.
Costs in other sectors (absenteeism and presenteeism) were estimated based on the corresponding cost category calculated for the TAU group in a CE study by Egger et al. [Citation46] and converted to 2021 Euros using Statistics Netherlands consumer price index [Citation47]. As no evidence was found for costs in other sectors associated with PR, it was assumed, based on expert input, that these were about half (50%) of those associated with AN. No costs in other sectors were assigned to the state FR. Baseline measurements from Egger et al. [Citation46] also provided the utility score (quality adjusted life years; QALY) for the AN state. For the utility score, mean score from the study’s intention-to-treat analysis (ITT) was used, as estimates from complete cases were remarkably high – while the ITT estimate was found comparable to other sources [Citation6].
Due to a lack of evidence, expert input guided the selection of proxy estimates of the utility values for PR and FR. Experts proposed that the utility score for FR would likely be comparable to that of the general population, while the utility score for PR would likely be somewhere between FR and AN. Using the recent study by Le et al. [Citation6], it was decided to adopt the utility score from the ‘No ED’ group as a proxy for FR, and the utility score from the OSFED (other specified eating disorder) group as a proxy for PR. Costs and utility scores can be viewed in .
2.3. Operational validation/model outcomes
The Assessment of the Validation Status of Health Economic decision models (AdViSHe) [Citation48], a checklist developed for the purpose of evaluating and establishing confidence in health economic decision models informed our efforts to validate the model. Due to the lack of comparable models in the literature, cross-validation of model outcomes was not feasible. Similarly, validation using alternative input data was also not pursued. Instead, model outcomes were validated based on empirical data and expert opinion (i.e. face validity and external validity).
The longitudinal study by Fichter et al. [Citation33], in which (mean) 20 years follow up data on 112 patients with AN were reported, served as the main source for validating model outcomes (). While this study did not contribute any direct inputs to the model, it was the main source (beyond expert input) for the calibration of two parameters.
Table 3. Validation of modeled outcome after 20 years.
The proportion of AN and No ED (remission) reported at year 20 by Fichter et al. [Citation33] was 10% and 39%, respectively. These figures are in line with estimates from AnoMod-TI (14% AN and 39% FR; see ). The proportion of patients in PR (4%), was much lower than our estimate (46%). However, it should be noted that PR is not a clinical diagnostic category, and that the definition of PR used by Fichter et al. [Citation33] was different from ours. Of the 112 patients with AN followed by Fichter et al. [Citation33], 43% were (by 20 years of follow up) re-diagnosed as Eating Disorder Not Otherwise Specified (EDNOS). By assuming that the categories of PR and EDNOS in Fichter et al. [Citation33] could be collapsed, namely that patients with AN who are later re-diagnosed as EDNOS can be considered to be in a state of partial remission, this sum proportion (47%) is identical to our estimate for PR (47%).
2.4. Model output
Results in AnoMod-TI are expressed as total healthcare costs, QALYs and life years per treatment arm (comparator vs intervention). The incremental cost-effectiveness ratio (ICER) is calculated as follows:
(Costs intervention – Costs comparator)/(QALYS intervention – QALYS comparator). As such, the ICER represents the incremental costs per QALY gained.
2.4.1. Probabilistic sensitivity analysis (PSA)
Parameter uncertainty in AnoMod-TI is captured by using different probability distributions and examined through PSA [Citation25]. For the cost estimates associated with each health state, the gamma distribution was used for cost estimates for which we had empirical evidence, and the BETA-pert distribution for cost estimates based on expert opinion. For hazard ratios, the lognormal distribution was used. For the utility values, which are assumed to be bound between 1 and 0, the beta distribution was chosen. Transition probabilities are also bound between 1 and 0, however, since all transitions probabilities associated with one health state should sum to 1 (in order to account for all patients, and also avoiding adding ‘new’ patients to the model), the Dirichlet distribution (which is essentially a multivariate beta distribution) was used for these parameters.
With probability distributions assigned to all parameters, the built-in PSA macro can be activated – which will re-run AnoMod-TI 1,000 times. For each run a random draw is taken from the parameter distributions for every parameter, leading to 1,000 different ICERs. These 1,000 simulations are then plotted on a cost-effectiveness plane (CE-plane) to visualize the uncertainty of the ICER estimate. Finally, a cost-effectiveness acceptability curve (CEAC) is constructed for the costs per QALY gained in which the likelihood that the intervention is cost-effective given different thresholds for the willingness-to-pay (WTP) is presented.
2.4.2. Deterministic sensitivity analysis
Uncertainty associated with model parameters that cannot be included in PSA (e.g. discount rates for health outcomes or costs), can be explored through deterministic one-way sensitive analysis by adjusting relevant values and then observing its effect on model outputs [Citation36].
3. Model testing
To demonstrate AnoMod-TI, it was applied to a theoretical treatment example where all patients categorized as either having AN or being in PR in the first two years of entering the model, receive an additional weekly follow-up session with a psychologist and a mental health nurse. The additional (healthcare) cost of this intervention is incorporated in the model by adding to the first four cycles (each consisting of 26 weeks), 26 times the unit cost of one psychologist session and one mental health nurse session to the healthcare cost of each patient in either the AN or PR state in the intervention cohort. In this hypothetical scenario, it is assumed that this intervention is associated with a 15% increase in the probability of improvement (going from AN to PR or FR, or from PR to FR), and a corresponding 10% decrease in the probability or relapsing from PR to AN, during the period (two years) in which the treatment is provided. This effect is incorporated in the model by assigning, respectively, a 1.15 and 0.9 hazard ratio (HR) to the above-mentioned probabilities for the intervention, relative to the comparator. To model uncertainty around these HRs, a tentative standard error (SE) of 0.15 was added to each.
Running AnoMod-TI with these inputs resulted in the CE-plane and CEAC presented in . On average, adding this (hypothetical) intervention to comparator resulted in a (discounted; see section 2.2.2) per-patient QALY increase of 0.031; a per-patient cost of €1,320; and an ICER of € 42,581 over a 20-year time horizon (). The CEAC suggests that at a WTP (per QALY) threshold of €80,000, there is a 53% probability of this intervention being cost effective, and 47% probability that the comparator is CE. Only at a WTP of €60,000 (and below) is it more likely that the comparator is more CE than the intervention. According to the Dutch guidelines, WTP thresholds vary between €20,000 to €80,000 per QALY according to the disability weight of a disorder [Citation49]. Given the high disease burden of AN, it is not unlikely that a WTP that approaches the upper limit of the range will be considered for priority-setting decision.
Figure 2. Incremental cost-effectiveness plane.
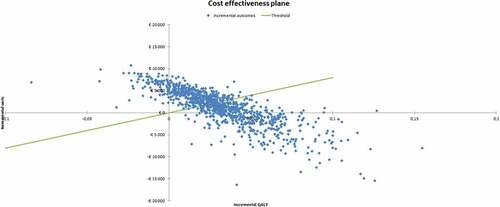
Figure 3. Cost-effectiveness acceptability curve.
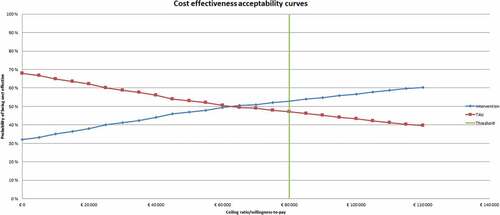
Table 4. Cost-effectiveness estimated by incremental costs per QALY, based on 1,000 PSA simulations.
For the purpose of demonstrating the application of a direct one-way sensitivity analysis, the model was run again with UK discount rates, which are 3.5% for both health outcomes and costs [Citation50]. This yielded a slightly lower ICER of €36,870 – illustrating how structural, context dependent features of the model will also influence results.
4. Discussion
We have presented AnoMod-TI, a flexible health economic modeling tool that can be used by researchers and decision makers to assess the CE of interventions targeting AN. To the best of our knowledge, this is the only health economic model in the current literature developed specifically for this purpose. We have also provided a brief example of how the model can be applied – with results illustrating how a relatively costly intervention with only modest effects can still be cost-effective.
Beyond usability and interpretability, we suggest that the main strength of AnoMod-TI lies in its clinical relevance – and applicability for future studies. By adopting the proposed standardized conceptual framework proposed by Khalsa et al. [2017], and by including clinical experts in the model building process, we have aimed to develop a model with high clinical pertinence.
Nevertheless, important limitations apply to our model and to our modeling approach. First, an important aspect of the framework by Khalsa et al. [Citation37] is that it integrates both physical and psychological measures in defining clinical outcomes in AN. As most clinical research on AN has tended to operationalize AN outcomes somewhat differently, and also wavered in which domain outcome criteria are applied, whether they are physical (such as BMI), psychological (such as the EDE-Q or other outcome rating scales) or some combination of the two, AnoMod-TI might not be ideal for estimating CE based on input parameters from older studies. For future research however, if a standardized integrated framework for operationalizing outcome measures in AN (such as that proposed by Khalsa et al. [Citation37]) is adopted by more clinical studies, the applicability of AnoMod-TI could be high.
Second, there is a paucity of large, high-quality studies with extended follow-up that are also compatible with the stages and operationalizations adopted in AnoMod-TI. Moreover, given the variability in terms of definitions, context and follow-up time in previous research, it was also not an option to pool data across studies. As such, the empirical evidence in our model is based on a limited number of sources. Nevertheless, by pursuing relevance and quality in those few studies that were eventually selected; by validating model outcomes on actual data, and by relying on AN experts with clinical experience as our main source for validating model inputs, we have worked toward making AnoMod-TI as robust as possible.
Third, reducing complex phenomena, such as AN, down to a simplified model requires several assumptions to be made. Some assumptions are at the methodological level, related to the modeling strategy that is pursued. For instance, being a Markov-Model, AnoMod-TI assumes that disease-related transition probabilities are stable over time and does not consider the impact of individual patient characteristics on transition probabilities (i.e. except for age-adjusted mortality probabilities). Prognosis might, however, be dependent on key patient-specific factors such as symptom severity, comorbidity or age of onset. While techniques such as micro-simulations can mitigate some of these constraints of the Markov model, these require substantially more data – which was not available to us. It is also likely that certain aspects of the disease course of AN, such as the probability of relapse being highest in the first 24 months following treatment, is less compatible with the Markovian assumption of transition probabilities being stable over time. However, by modeling two separate classes of period-dependent relapse probabilities (before and after 2 years), we have made an effort to account for this in AnoMod-TI.
Other assumptions are more qualitative and relate to the relative fit between the empirical data and the model. While support from experts regarding choice of source material for transition probabilities was generally high, there was some debate about the validity of the study used for estimating some of the relapse probabilities. More specifically, as the participants in Berends et al. [Citation42] cohort study on relapse and relapse prevention had been included based on standards and criteria for recovery that were notably higher than in other studies, there was some concern about the representativeness of this study population and the validity of the reported relapse rates.
Another important assumption pertains to the model’s liminal state of PR. While it was clearly important (from a clinical perspective) to be able to include a category for patients that fall somewhere between a clinical diagnosis of AN and remission, PR is not a diagnostic entity and difficult to operationalize. Validating our modeled outcomes on observed data, revealed that AnoMod-TI performed quite well at estimating the number of remitted and persistent AN cases after 20 years (). However, almost 50% of our simulated patients ended up in the third category of PR. Our decision to compare/validate the modeled outcome of PR patients with a collapsed category comprised of both PR and EDNOS (patients with AN who were later re-diagnosed as eating disorder not otherwise specified) from the study by Fichter at al. [Citation33] was met with only partial support from experts.
Fourth, it should also be noted that AnoMod-TI was developed based on empirical data generated under the DSM-IV. The diagnostic criteria for AN are different under the DSM-5 [Citation51]. However, this is of limited consequence for our model as all operationalizations are based on clinical outcomes and not DSM criteria. From a budget impact perspective, however, it is likely to have a consequence in that the prevalence of AN might be different under the DSM-5. It is for instance likely that many of the patients with ED, who under the DSM-IV were diagnosed as EDNOS, would under the DSM-5 be diagnosed as AN [Citation52].
Fifth, AnoMod-TI was constructed from a Dutch perspective, and might not generalize fully to other countries. Model inputs are largely derived from studies conducted in Germany and the Netherlands. For use outside of the Netherlands, but in countries where the underlying epidemiology of the model is still considered applicable, cost and utility inputs can be easily adjusted to adapt the model to another context. Future researchers could investigate the transferability of model outputs to other countries and to determine necessary changes for increasing the applicability of AnoMod-TI across different contexts.
5. Conclusion
AN is a severe and debilitating psychiatric disorder for which there are currently only limited treatment options. While new treatments might be on the horizon, their economic impact, which is usually not assessed as part of clinical studies, should also be considered. AnoMod-TI could serve as a useful tool for researchers looking to incorporate estimates of cost-effectiveness in future studies, or policymakers looking to evaluate the budget impact of new treatment packages for AN. AnoMod-TI can be used for various interventions (i.e. psychological, medical, weight restoration) aimed at either treating AN or preventing relapse from a state of PR or FR. Moreover, AnoMod-TI is made freely available (upon request to the authors) and built to be both easy to use and easy to interpret.
Declaration of interest
The authors have no other relevant affiliations or financial involvement with any organization or entity with a financial interest in or financial conflict with the subject matter or materials discussed in the manuscript apart from those disclosed.
Reviewer disclosures
Peer reviewers on this manuscript have no relevant financial or other relationships to disclose.
Author contributions
V Svendsen, J Lokkerbol and B Wijnen were involved in all stages of developing the model and producing the article. S Evers, U Danner and A Jansingh provided expert input throughout and were all substantially involved in critically reviewing and revising both the model and the contents of the manuscript. All authors agree for the final version of the manuscript to be published.
Supplemental Material
Download MS Word (13.2 KB)Supplementary material
Supplemental data for this article can be accessed online at https://doi.org/10.1080/14737167.2022.2119130
Additional information
Funding
References
- Treasure J, Zipfel S, Micali N, et al. Anorexia nervosa. Nat Rev Dis Primers. 2015 Nov 26;1(1):15074.
- Zipfel S, Giel KE, Bulik CM, et al. Anorexia nervosa: aetiology, assessment, and treatment. Lancet Psychiatry. 2015 Dec;2(12):1099–1111.
- van Eeden AE, van Hoeken D, Hoek HW. Incidence, prevalence and mortality of anorexia nervosa and bulimia nervosa. Curr Opin Psychiatry. 2021 Nov 1;34(6):515–524.
- Stoving RK, Andries A, Brixen K, et al. Gender differences in outcome of eating disorders: a retrospective cohort study. Psychiatry Res. 2011 Apr 30;186(2–3):362–366.
- Striegel Weissman R, Rosselli F. Reducing the burden of suffering from eating disorders: unmet treatment needs, cost of illness, and the quest for cost-effectiveness. Behav Res Ther. 2017 01;88:49–64.
- Le LK, Mihalopoulos C, Engel L, et al. Burden and health state utility values of eating disorders: results from a population-based survey. Psychol Med. 2021 01; 51(1):130–137.
- Stuhldreher N, Wild B, König HH, et al. Determinants of direct and indirect costs in anorexia nervosa. Int J Eat Disord. 2015 Jan;48(1):139–146.
- Keski-Rahkonen A, Mustelin L. Epidemiology of eating disorders in Europe: prevalence, incidence, comorbidity, course, consequences, and risk factors. Curr Opin Psychiatry. 2016 11;29(6):340–345.
- Bode K, Götz von Olenhusen NM, Wunsch EM, et al. Population-based cost-offset analyses for disorder-specific treatment of anorexia nervosa and bulimia nervosa in Germany. Int J Eat Disord. 2017 Mar;50(3):239–249.
- Stuhldreher N, Konnopka A, Wild B, et al. Cost-of-illness studies and cost-effectiveness analyses in eating disorders: a systematic review. Int J Eat Disord. 2012 May;45(4):476–491.
- Brockmeyer T, Friederich HC, Schmidt U. Advances in the treatment of anorexia nervosa: a review of established and emerging interventions. Psychol Med. 2018 06;48(8):1228–1256.
- Couturier J, Kimber M, Szatmari P. Efficacy of family-based treatment for adolescents with eating disorders: a systematic review and meta-analysis. Int J Eat Disord. 2013 Jan;46(1):3–11.
- Halvorsen I, Ø R. User satisfaction with family-based inpatient treatment for adolescent anorexia nervosa: retrospective views of patients and parents. J Eat Disord. 2019;7(1):12.
- Fisher CA, Skocic S, Rutherford KA, et al. Family therapy approaches for anorexia nervosa. Cochrane Database Syst Rev. 2019 05;5: CD004780 DOI:10.1002/14651858.CD004780.pub4.
- Crow SJ, Nyman JA. The cost-effectiveness of anorexia nervosa treatment. Int J Eat Disord. 2004 Mar;35(2):155–160.
- Le LK, Barendregt JJ, Hay P, et al. The modeled cost-effectiveness of family-based and adolescent-focused treatment for anorexia nervosa. Int J Eat Disord. 2017 12; 50(12):1356–1366.
- Wright DR, Austin SB, LeAnn Noh H, et al. The cost-effectiveness of school-based eating disorder screening. Am J Public Health. 2014 Sep;104(9):1774–1782.
- Le LK, Barendregt JJ, Hay P, et al. The modelled cost-effectiveness of cognitive dissonance for the prevention of anorexia nervosa and bulimia nervosa in adolescent girls in Australia. Int J Eat Disord. 2017 07; 50(7):834–841.
- Lokkerbol J, Wijnen B, Ruhe HG, et al. Design of a health-economic Markov model to assess cost-effectiveness and budget impact of the prevention and treatment of depressive disorder. Expert Rev Pharmacoecon Outcomes Res. 2020 Nov;21(5):1031–42. • Similar applications of health economic models within psychiatry.
- Wijnen BFM, Thielen FW, Konings S, et al. Designing and testing of a health-economic Markov model for prevention and treatment of early psychosis. Expert Rev Pharmacoecon Outcomes Res. 2020 Jun;20(3):269–279.
- Le LK, Hay P, Mihalopoulos C. A systematic review of cost-effectiveness studies of prevention and treatment for eating disorders. Aust N Z J Psychiatry. 2018 04;52(4):328–338.
- Husereau D, Drummond M, Petrou S, et al. Consolidated health economic evaluation reporting standards (CHEERS) statement. BMJ. 2013 Mar;346:f1049.
- Nederland Z. Richtlijn voor het uitvoeren van economische evaluaties in de gezondheidszorg [Guideline for conducting economic assessments in health care]. Diemen: Zorginstituut Nederland; 2015. Dutch.
- Sonnenberg FA, Beck JR. Markov models in medical decision making: a practical guide. Med Decis Mak. 1993 Dec 01;13(4):322–338.
- Briggs A, Sculpher M, Claxton K. Decision modelling for health economic evaluation. New York: Oxford University Press; 2006.
- Briggs A, Sculpher M. An introduction to Markov modelling for economic evaluation. Pharmacoeconomics. 1998 Apr;13(4):397–409.
- Caro JJ, Briggs AH, Siebert U, et al. Modeling good research practices–overview: a report of the ISPOR-SMDM modeling good research practices task force–1. Value Health. 2012 Sep-Oct;15(6):796–803.
- Steinglass JE, Glasofer DR, Dalack M, et al. Between wellness, relapse, and remission: stages of illness in anorexia nervosa. Int J Eat Disord. 2020 07;53(7):1088–1096.
- de Zwart PL, Jeronimus BF, de Jonge P. Empirical evidence for definitions of episode, remission, recovery, relapse and recurrence in depression: a systematic review. Epidemiol Psychiatr Sci. 2019 Oct;28(5):544–562.
- Bardone-Cone AM, Hunt RA, Watson HJ. An overview of conceptualizations of eating disorder recovery, recent findings, and future directions. Curr Psychiatry Rep. 2018 08;20(9):79.
- Wade TD, Lock J. Developing consensus on the definition of remission and recovery for research. Int J Eat Disord. 2020 08;53(8):1204–1208.
- Bardone-Cone AM, Alvarez A, Gorlick J, et al. Longitudinal follow-up of a comprehensive operationalization of eating disorder recovery: concurrent and predictive validity. Int J Eat Disord. 2019 09; 52(9):1052–1057.
- Fichter MM, Quadflieg N, Crosby RD, et al. Long-term outcome of anorexia nervosa: results from a large clinical longitudinal study. Int J Eat Disord. 2017 09; 50(9):1018–1030.
- Tomba E, Tecuta L, Crocetti E, et al. Residual eating disorder symptoms and clinical features in remitted and recovered eating disorder patients: a systematic review with meta-analysis. Int J Eat Disord. 2019 07; 52(7):759–776.
- Volpe U, Tortorella A, Manchia M, et al. Eating disorders: what age at onset? Psychiatry Res. 2016 Apr;238:225–227.
- Drummond M,F, Sculpher MJ, Claxton K. Methods for the economic evaluation of health care programmes. New York: Oxford University Press; 2015.
- Khalsa SS, Portnoff LC, McCurdy-McKinnon D, et al. What happens after treatment? A systematic review of relapse, remission, and recovery in anorexia nervosa. J Eat Disord. 2017;5(1):20.
- Berends T, Boonstra N, van Elburg A. Relapse in anorexia nervosa: a systematic review and meta-analysis. Curr Opin Psychiatry. 2018 11;31(6):445–455.
- Kordy H, Krämer B, Palmer RL, et al. Remission, recovery, relapse, and recurrence in eating disorders: conceptualization and illustration of a validation strategy. J Clin Psychol. 2002 Jul;58(7):833–846.
- Statline. Sterfte; geslacht, leeftijd (op 31 December) en burgerlijke staat 1950-2014. [Mortality; gender, age (on December 31) and marital status 1950-2014] 2015. Available from: https://opendata.cbs.nl/statline/#/CBS/nl/dataset/37530NED/table?fromstatwebDutch
- Arcelus J, Mitchell AJ, Wales J, et al. Mortality rates in patients with anorexia nervosa and other eating disorders. A meta-analysis of 36 studies. Arch Gen Psychiatry. 2011 Jul;68(7):724–731.
- Berends T, van Meijel B, Nugteren W, et al. Rate, timing and predictors of relapse in patients with anorexia nervosa following a relapse prevention program: a cohort study. BMC Psychiatry. 2016 09; 16(1):316.
- Herzog DB, Dorer DJ, Keel PK, et al. Recovery and relapse in anorexia and bulimia nervosa: a 7.5-year follow-up study. J Am Acad Child Adolesc Psychiatry. 1999 Jul;38(7):829–837.
- Strober M, Freeman R, Morrell W. The long-term course of severe anorexia nervosa in adolescents: survival analysis of recovery, relapse, and outcome predictors over 10-15 years in a prospective study. Int J Eat Disord. 1997 Dec;22(4):339–360.
- Hakkaart-van Roijen L, Van der Linden N, Bouwmans C, et al. Kostenhandleiding. Methodologie van kostenonderzoek en referentieprijzen voor economische evaluaties in de gezondheidszorg In opdracht van Zorginstituut Nederland Geactualiseerde versie [Cost guide, methodology of cost research and reference prices for economic evaluations in health care, commissioned by the national health care institute, updated version]. 2015. Dutch
- Egger N, Wild B, Zipfel S, et al. Cost-effectiveness of focal psychodynamic therapy and enhanced cognitive-behavioural therapy in outpatients with anorexia nervosa. Psychol Med. 2016 12; 46(16):3291–3301.
- CBS. Consumer prices; price index 2022. Available from: https://www.cbs.nl/en-gb/figures/detail/83131eng
- Vemer P, Corro Ramos I, van Voorn GA, et al. AdViSHE: a validation-assessment tool of health-economic models for decision makers and model users. Pharmacoeconomics. 2016 Apr;34(4):349–361.
- RVZ. Zinnige en duurzame zorg 2006 [Sensible and sustainable care 2006]. Available from: https://www.raadrvs.nl/binaries/raadrvs/documenten/publicaties/2006/06/07/zinnige-en-duurzame-zorg/Advies_-_Zinnige_en_duurzame_zorg.pdfDutch
- Watson I, Bouvy J, Dent R, et al. CHTE methods review: discounting 2020. Available from: https://www.nice.org.uk/Media/Default/About/what-we-do/our-programmes/nice-guidance/chte-methods-consultation/Discounting-task-and-finish-group-report.docx
- Ernst V, Bürger A, Hammerle F. Prevalence and severity of eating disorders: a comparison of DSM-IV and DSM-5 among German adolescents. Int J Eat Disord. 2017 11;50(11):1255–1263.
- Fairburn CG, Cooper Z. Eating disorders, DSM–5 and clinical reality. Br J Psychiatry. 2011;198(1):8–10.