
ABSTRACT
Objective
Changes to the Medicaid Drug Rebate Program (MDRP) determination of Medicaid Best Price (MBP) enables Value-based purchasing arrangements (VBPAs) to address financial uncertainty. This study estimates the likely effectiveness of MDRP-enabled VBPAs for chronically dosed medicines.
Methods
Monte Carlo simulations examined: Multiple Best Prices and Bundled Sales MBP approaches authorized under MDRP and a third National Pooling approach using payment misalignment; needed payer size for practical participation; and the resulting potential number of covered lives under a VBPA as evaluation metrics.
Results
Both Multiple Best Prices and National Pooling enable VBPAs for 95% of scenarios (including all 5i chronic products with ≥1,000 treated patients per year), with 75% of those with payment misalignment ≤9%. National pooling for retail drugs has less participation and worse misalignment (5i: 95% contracted, 75% ≤9% misalignment; retail: 71%, 66%). Bundled Sales performed worst (5i: 40%, 75% ≤9%; retail: 31%, 88%) due to rebate volatility risk of breaking best price and Average Manufacturer Price impact. Medicaid sees worse misalignment for the 60% drug performance scenarios because of comparison to the statutory rebate (23.1%).
Conclusion
The Multiple Best Prices approach has the lowest misalignment and could be applied to most chronic therapies, even rare ones.
1. Introduction
1.1. The historical medicaid best price challenge
Patients may face barriers in accessing medicines due to uncertainties regarding their real-world effectiveness and the resulting financing challenges to payers [Citation1]. Healthcare needs payment innovations to address these patient access issues. Value-based purchasing arrangements (VBPAs: outcomes-based contracts where payment is tied to reaching pre-determined goals) can support this [Citation1–4]. VBPAs can address uncertainty but face multiple implementation challenges, from outcomes measurement to regulatory barriers in the US and worldwide [Citation5–11].
The Medicaid Drug Rebate Program (MDRP) historically has inhibited VBPAs in the commercial payer marketplace through the Medicaid Best Price (MBP) mechanism by which it uses private sector drug prices to establish mandatory drug rebates for the public Medicaid program [Citation11–13]. Medicaid Best Price rules determine rebates that a developer must pay to a state Medicaid plan for each unit of the therapy used by its Medicaid beneficiaries. That rebate, in most cases, is the larger of either (i) the statutory rebate: 23.1% of Average Manufacturer Price (AMP; the volume-weighted average price for all unit sales in a given quarter) or (ii) the ‘best price’ rebate: the difference between AMP and the lowest price paid by any commercial buyer [Citation14,Citation15]. An additional required rebate occurs if a drug price increase exceeds an inflationary limit. Our previous paper provides a more detailed description and illustration of how AMP is calculated and the mandatory drug rebate is determined [Citation16].
A critical historical challenge posed by MDRP VBPAs, especially for rare diseases, is that the largest performance rebate for a drug not meeting performance expectations could set the standard rebate for all Medicaid patients, even for the majority who likely receive substantial benefits from the drug. This occurs if a deep outcomes-based rebate received by a single commercial payer with only a single treated patient results in a net price lower than the statutory minimum rebate; that net price for that single patient would establish the Medicaid Best Price rebate applied to all treated Medicaid patients in that calendar quarter regardless of their individual outcomes.
In December 2020, CMS (US Centers for Medicare and Medicaid Services, the US public payer for those over the age of 65 and those with low incomes) finalized a new rule to address these and other issues for drug VBPAs, which took effect on 1 July 2022. Additional reforms to the MDRP also have been proposed [Citation14].
1.2. MDRP reforms affect durable and chronic therapies
A previous analysis focused on MDRP reform’s potential impacts on VBPAs for durable therapies, wherein a single administration provides a multi-year effect, creating financing challenges under traditional payment models [Citation16]. That prior analysis suggested that the CMS Multiple Best Prices approach produced the lowest payment misalignment (defined as the percentage difference between the simulated net drug cost and the ideal value-based amount) of the three simulated approaches (Multiple Best Prices, Bundled Sales, and National Pooling, Box 1). National Pooling was easier and less costly to implement than Multiple Best Prices and performed nearly as well on the misalignment metric, except for the ultra-orphan scenarios (those with 200 patients per year). However, National Pooling would require legislative change to enable its more aggregate pooling method and require a method change to exclude VBPAs from Average Manufacturer Price calculations to avoid reducing the rebate amounts Medicaid would receive. The CMS Bundled Sales MDRP approach performed poorly on the misalignment criteria and increased rebate volatility, which would likely deter drug developers from offering VBPAs to all but the largest payers.
The CMS VBPA rules apply to all Covered Outpatient Drugs, not just durable therapies, so the question of how the various Medicaid Best Price approaches perform for chronic therapies is critical for payment innovation across the majority of the drug armamentarium.
This paper describes the extent to which the 2020 CMS Rule reforms, and the additional proposed National Pooling MBP reform, address legacy MBP challenges for chronic therapies – those requiring multiple administrations over months and perhaps a lifetime. We specifically seek to understand whether reform approaches may encourage commercial payer VBPA adoption, align payments with therapeutic benefits, and allow developers to assume more financial risk while mostly holding Medicaid harmless, financially and operationally.
We first inventory the reform approaches and qualitatively assess their ability to resolve the MBP challenges for chronic therapies. We then model the impact of the reforms on drug developers, commercial payers, and state Medicaid programs via Monte Carlo simulations. We conclude with suggestions for further research and additional policy actions suggested by simulation results, which would improve VBPA feasibility and fairness [Citation17,Citation18].
The EU and Asia share some of these challenges within their regulatory frameworks. For instance, timeframes can be limited by regulation, constitution, or supra-national (EU) treaty [Citation19,Citation20]. While this paper focuses on US-specific mechanisms, the issues often apply more broadly with the statistical volatility of value-based contracting for rare conditions applying universally.
Box 1. MDRP Medicaid best price approaches
CMS Rule – multiple best prices: Developers report the best price available via contract (e.g. claim is not required to trigger the discount) in a quarter in each performance tier across all commercial entity contracts using a particular VBPA design. Medicaid plans must make a priori opt-in to the VBPA design to obtain the financial terms. However, the developer determines whether to report under Multiple Best Prices or Bundled Sales.
CMS Rule – bundled sales: Developers report the lowest average price realized in a quarter in any single contract with a commercial entity using a particular VBPA design. The developer determines whether to report under Multiple Best Prices or Bundled Sales.
Proposed reform – national pooling: Developers report the best average price realized in a quarter across all VBPA contracts with commercial entities using any VBPA design. Medicaid plans do not need to track outcomes because the VBPA reductions are included in the standard rebate calculation.
2. Methods
2.1. Identifying factors to include in the simulation
Similar to our prior research [Citation16], we first performed a targeted review of published and gray literature on VBPAs in PubMed, Google Scholar, and Google. The search topics included (i) value-based, performance-based, or outcomes-based risk-sharing and contracting and (ii) chronic disease therapies. The search was conducted in 2021 and included English-language results from 2015–2020. Based on this literature, we adapted our analytic framework [Citation16] to create a discussion guide for primary research comprising one-hour teleconference interviews with 15 experts from Medicaid Managed Care Organizations and Managed Medicaid; developers; commercial payers; academics; and legal experts (See Supplementary Appendix 1).
Interviewees in the qualitative phase were asked about familiarity with four types of risks that could underpin contracting: performance (product efficacy uncertainty), adherence (patients continuing with their treatment as prescribed), actuarial (volatility in how many patients are treated in a given reporting period), and budget impact risks (risks to balance sheets). Performance risks were the most cited basis for VBPAs; for several interviewees, adherence fell under this definition, as they had worked with contracts based on treatment discontinuation, a proxy for performance. Therefore, in the model, we combine adherence and performance risks under the moniker of performance risk. Actuarial risk – the uncertainty around how many claims may arise in a given period – was less resonant as a driver but still of high interest. Budget impact risk had low resonance.
For specific impediments, interviewees were taken through a list of specific contracting impediments. Of these, only Medicaid Best Price reporting was consistently upheld as an obstacle and an obstacle that needed to be overcome for contracting innovation to continue. Some interviewees raised anti-trust regulations, but all other impediments, including Health Insurance Portability and Accountability Act (HIPAA) restrictions, were said to be navigable.
2.2. Model structure
Excel-based microsimulation models that included contracting and coverage, payment misalignment (the percentage difference between the simulated net drug cost and the ideal value-based amount), and volatility (variation in the misalignment across the 10,000 Monte Carlo iterations). Simulations were conducted across a range of reimbursement scenarios and VBPA reforms.
AMP is impacted under the bundled sales and national pooling approach but not by the Multiple Best Prices approach. Per current AMP regulations, rebates to payers are not included in the AMP calculation for retail drugs but rebates are included in AMP for 5i products (those that include inhalation, infusion, instilled, implanted, or injectable drugs and which are not usually dispensed through a retail community pharmacy). However, under the Multiple Best Prices approach, VBPAs are excluded from all AMP calculations, whereas in the Bundled Sales and National Pooling approaches VBPAs are included. Since AMP determines the mandatory rebates paid to Medicaid plans, these differing treatments required separating 5i and retail drug modeling for the Bundled Sales and National Pooling reform approaches but enabled combining 5i and retail drugs in a single simulation treatment for the Multiple Best Prices reform approach.
For this analysis of chronic therapies, we modeled patient populations as low as 200 and then logarithmically expanded from 1,000 to 1,000,000 treated patients with a single branded therapy. Chronic therapy VBPAs were presumed to cover 12 months of therapy, with patient response evaluated at the end of that period and performance rebates evenly applied to the entire therapy spend over the 12 months. The model considered two scenarios for performance rebates: 50% or 100% for inadequate treatment benefit. Rebate levels were selected to illustrate full rebating for product failure (100% rebate level; completely links product performance to payment under a VBPA) and partial rebating for product failure (50% rebate level; only partially links product performance to payment under a VBPA).
The model includes two levels of drug performance: a level in which the therapeutic achieves satisfactory performance for 60% of patients, with 40% receiving an inadequate benefit, and a level in which the therapeutic achieves 90% satisfactory performance. These two levels, consistent with the prior paper, were chosen to illustrate the difference between higher and lower-efficacy products as well as situations in which lower adherence reduces aggregate product efficacy.
The model includes each of the 57 largest plans in the US. Plans smaller than 500,000 lives were excluded [Citation21]. Our implicit assumption is that the excluded, smaller than 500,000 life plans, will fail the participation thresholds of either the number of potential lives, rebate volatility, or both. This does not mean we assume no coverage for the approximately 42 million people in this remainder; merely that they will be covered under status quo rebate contracts. For Medicaid simulations we included all 51 Medicaid plans (50 states plus Washington D.C.), with each plan treated as a unified population for VBPA contracting.
The model assumes that plans and developers will only enter into VBPAs when in each quarter, there is: 1) at least a 25% chance of a case occurring and 2) less than a 1% risk of the VBPA exceeding the statutory Best Price rebate (breaking Best Price). While arbitrary cutoffs, they reflect that: a minimum number of expected patients are needed to justify the negotiation, tracking, and adjudication of VBPA costs, and developers will guard against a windfall Medicaid rebate due to small population statistical variability. Both figures were determined to be reasonable based on the qualitative interviews. Furthermore, our prior work showed little difference in results between 1% and 10% ‘breaking best price’ developer risk thresholds [Citation16].
Detailed model structure and parameterization are shown in the Supplementary Appendix Table A-1 to Table A-5.
3. Results
3.1. Simulation – uptake of VBPAs in the commercial market
shows the relative performance of the reform approaches to provide access to VBPAs (VBPA availability) across all of scenarios modeled. I.e. each curve, at each point, shows the average across, e.g. the scenarios for National Pooling Retail with 1,000 treated patients per product – 8 models, each in turn made up of simulations for 57 plans, for 456 scenario-payer combinations in total. Results are normalized to the number of lives covered by the best-performing reform approach, Multiple Best Prices. Since Multiple Best Prices results in contracts and coverage for 90% of all possible lives in the 57 simulated plans, the other reforms are presented in terms relative to that best coverage.
Figure 1. VBPA coverage of simulated plans (including their Administrative Service Only (ASO) lives) in the commercial market for each MDRP reform.
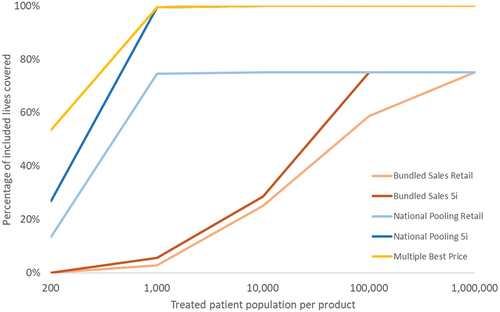
Simulation results suggest clear differences between the Multiple Best Prices, National Pooling, and Bundled Sales approaches, even in scenarios with the highest treated patient populations. The Multiple Best Prices approach supports the broadest use of commercial VBPAs, enabling the most VBPAs overall, including when smaller patient pools are involved (works reasonably well with 200 annual patients) and reach a steady state at 1,000 annual treated patients or above.
Bundled Sales have the lowest percentage of total simulated (included) lives covered of the three approaches, breaking above 20% coverage at 10,000 treated patient scenarios. Importantly, a much larger pool of patients is required to enable VBPAs than other approaches – for 5i products, VBPA contracting doesn’t peak until 100,000 commercially treated lives, and for retail drugs, it doesn’t peak until one million lives with 75% of included lives covered under a VBPA.
National Pooling performs intermediately well on the percentage of included lives covered metric National Pooling generally falls between the Bundled Sales approach and the Multiple Best Prices approaches but are closer to the Multiple Best Prices results. National Pooling covered lives peak at the 1,000 treated life scenarios, similar to Multiple Best Prices. National Pooling access to VBPAs is similar to Multiple Best Prices for 5i drugs. Retail drugs, on the other hand, only reach a maximum of 75% of included lives covered under a VBPA compared to Multiple Best Prices. This peak is the same as achieved under the Bundled Sales approach, with the key difference that the peak is reached at much smaller patient populations.
Several factors drove the eligible percentage of covered lives in a VBPA. Primary among those, including all commercial lives opposed to only fully insured lives, dramatically expanded the availability of VBPAs under all reform approaches by enlarging the plan pool sizes. It reduced the number of plans assumed not to enter into a VBPA because of <25% likelihood of encountering a case.
VBPAs were more widely available for the 90% drug performance scenarios than the 60% drug performance scenarios for both Bundled Sales and National Pooling. Drug performance did not affect VBPA availability under the Multiple Best Prices approach. Finally, further separation in the results emerges between 5i and retail drugs, with 5i products having greater coverage due to retail drugs not including VBPA rebates in AMP while 5i products do. This results in VBPA rebates for retail drugs more easily exceeding the mandatory minimum MDRP rebate, discouraging developers from offering the VBPA rebates (See The historical Medicaid Best Price Challenge, above). The Multiple Best Prices reform does not affect AMP differentially between 5i and retail drugs.
Across all scenarios, the Multiple Best Prices reform enables VBPAs under more circumstances for more plans resulting in the simulations projecting the highest number of covered lives available for VBPAs. National Pooling matches Multiple Best Prices for 5i products treating 1,000 or more patients per year and exceeds the Bundles Sales availability for retail therapies for all treated patient sizes up to 1,000,000, where Bundled Sales finally matches its performance. Both of the other reform approaches dominate Bundles Sales for 5i therapies.
3.2. Simulation – commercial payment misalignment
are heatmaps of abridged results, containing select plans based on pool (covered lives) sizes representing the largest, smallest, median, and the two most closely approximating the 25th and 75th percentiles. Commercial plans are numbered in rank order with pool size under the plan number. States are numbered alphabetically with state name and number of Medicaid beneficiaries beneath. The heatmaps display each cell in priority: first, NC-P (Not Contracted – Patient) indicates scenarios in which the 25% probability threshold for a case in a quarter is not met through a combination of plan size and condition population; second, NC-BP (Not Contracted – Best Price) when contracts would not arise because a greater than 1% chance that the performance rebate would lead to a Medicaid rebate windfall due to performance rebate statistical volatility; and, finally for those cells with a VBPA a color-coded misalignment level. Colors represent closeness to the ideal target payment, with 0% being perfect alignment (dark green) and greater than or equal to 21% or less than or equal to −21% being very high misalignment (dark red; purple, respectively). Alignment at 0% means that payments are perfectly matched with performance. Payment misalignment greater than zero represents overpayments by health plans. Payment misalignment less than zero represents health plan underpayments.
Figure 2. Payment misalignment results across all scenarios, commercial payers. Red shading represents misalignment that would be bad for commercial plans, whereas blue/purple shading represents misalignment that would be bad for developers (NA).
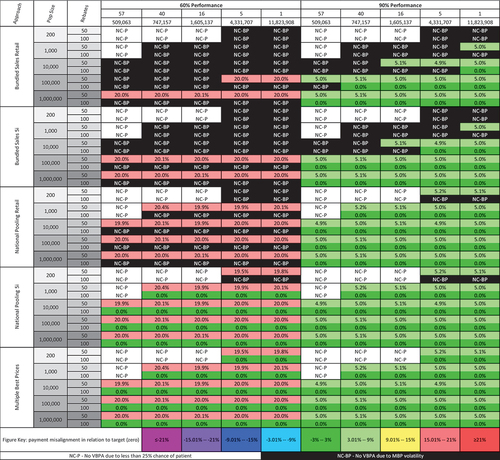
Figure 4. Payment misalignment results with AMP Reform under Bundled Sales 5i & National Pooling 5i approaches, Medicaid payers.
Due to the priority ordering in each row, any white NC-P cells to the left of black NC-BP cells would also fail the 1% risk threshold.
Each heatmap is further divided horizontally into repeating sections of reform approach, treated patient population size, and performance-rebate level; and vertically into two average therapeutic performance levels (60% and 90%) within which plans are ordered by the number of covered lives (largest, 75th percentile, median, 25th percentile, smallest). shows the commercial plans with Medicaid states shown in .
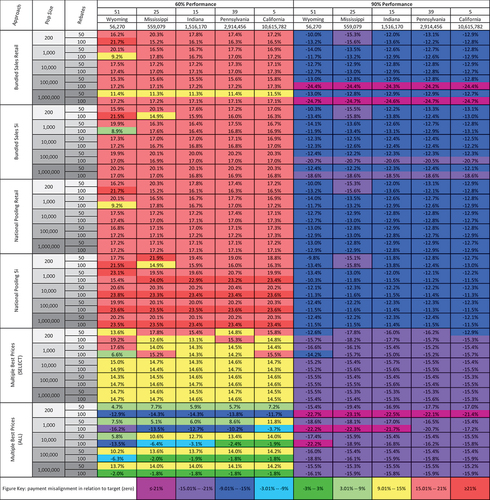
Figure 3. Payment misalignment across all scenarios, Medicaid payers.

A heatmap of payment misalignment across all scenarios for select commercial plans is shown in . The results represent an individual plan’s payment misalignment for a given scenario.
Bundled Sales 5i generates the most NC-BP cells, whereas Multiple Best Prices generates none. Note that each method possesses the same pattern of NC-P cells in the smaller population scenarios for the smaller plan sizes.
For commercial payers entering into VBPA contracts, the Bundled Sales approach achieved the lowest contracting coverage, while Multiple Best Prices achieved the highest. National pooling performs in between the two options. These granular results provide a sample of the data summed in . The Multiple Best Prices approach, which by design cannot induce a Medicaid rebate windfall, achieved the most contracted scenarios (84 of 100 possible cells, 84%), with the Bundled Sales Retail approach achieving contracts in only 31% of scenarios (31 of 100 cells) and Bundled Sales 5i contracting in 36% of scenarios (36 of 100 cells). National Pooling Retail contracted in 59% of scenarios (59 of 100 cells), and National Pooling 5i met contracting criteria in 80% of displayed scenarios (80 of 100 cells).
When contracted, in the 60% therapeutic performance contract scenarios for retail products, both Bundled Sales and National Pooling reform approach had 0% of contracted scenarios having ≤9% misalignment (green cells; 0 of 7 cells, 0 of 19 cells, respectively). The Multiple Best Prices reform approach had 50% of contracted scenarios having ≤9% misalignment (green cells; 21 of 42 cells). When examining partial success, National Pooling for retail products mitigated approximately 50% of patient failures (e.g. approximately 20% misalignment in 100% (red cells, 19 of 19 cells) of contracted scenarios, same as Bundled Sales for retail products 100% (7 of 7 cells). However, Bundled Sales did not achieve contracting for treated population sizes lower than 100,000, whereas National Pooling did.
In the 90% therapeutic performance contract scenarios for retail products, all reform approaches had 100% of contracted scenarios having ≤9% misalignment (green cells; 24 of 24 cells for Bundled Sales, 40 of 40 cells for National Pooling, and 42 of 42 cells for Multiple Best Prices).
In the 60% therapeutic performance contract scenarios for 5i products, Bundled Sales again had 0% of contracted scenarios having ≤9% misalignment (green cells; 0 of 10 cells), while National Pooling had 47.5% of contracted scenarios having ≤9% misalignment (green cells; 19 of 40 cells). Multiple Best Prices had 50% of contracted scenarios having ≤9% misalignment (green cells; 21 of 42 cells). When examining partial success, National Pooling mitigated approximately 50% of patient failures (e.g. approximately 20% misalignment) in 52.5% (red cells, 21 of 40 cells) of contracted scenarios, in contrast to Bundled sales 100% (10 of 10 cells).
In the 90% therapeutic performance contract scenarios for 5i products, again, all reform approaches had 100% of contracted scenarios having ≤9% misalignment (green cells; 26 of 26 cells for Bundled Sales, 40 of 40 cells for National Pooling, and 42 of 42 cells for Multiple Best Prices).
Multiple Best Prices performed the best across all scenarios considering both availabilities of VBPA contracting and payment misalignment. VBPAs are available in all but the smallest population Multiple Best Prices scenarios. Alignment is perfect under the 100% performance rebate scenarios.
For retail drugs and 60% therapeutic performance scenarios, Multiple Best Prices significantly outperform National Pooling in terms of both VBPA availability and payment misalignment. For retail drugs and 60% therapeutic performance scenarios using National Pooling, VBPAs are generally available for 50% performance rebates but not for 100% performance rebates. For retail drugs with 90% therapeutic performance, VBPAs are widely available under National Pooling; National Pooling and Multiple Best Prices have equivalent payment misalignment. For 5i products, payment misalignment is equivalent between National Pooling and Multiple Best Prices.
Overall, Bundled Sales performed worst due to the low availability of VBPAs contracts due to rebate windfall risk (rebate volatility). VBPAs are not available for most retail scenarios where therapeutic performance outcomes are satisfied 60% of the time, and there is limited VBPA availability in 90% of therapeutic performance scenarios. There is also some VBPA availability for 5i products with large numbers of commercially treated patients, but payment misalignment remains high at 20%. Under 90% therapeutic performance outcomes, VBPAs have limited availability for annual patient sizes of 1,000 and 10,000.
Payment misalignment is predominantly impacted by therapeutic performance, administration route, plan size, number of treated patients/condition population size, and performance rebate structure. The best alignment can be seen with the 90% therapeutic performance column versus the 60% therapeutic performance column. This is unsurprising as the population average performance rebate of 10% is below the 23.1% statutory minimum rebate. Thus the probability of the discount exceeding the minimum and inducing a Medicaid windfall rebate is low.
Drug administration routes also played an important role – VBPAs are more widely available for physician-administered than retail drugs. Discounts for physician-administered drugs count toward AMP, which reduces Medicaid discounts. Additionally, plan size also was impactful – small plans were unlikely to enter into VBPAs due to their lower probability of exceeding the 25% chance of encountering a case. Small plans also have a greater chance of exceeding statutory best price rebate levels due to the statistical volatility of encountering a cluster of patients receiving poor therapeutic outcomes – thus reducing developer incentives to contract (does not apply to the Multiple Best Prices reform approach). Likewise, the number of treated patients played an important role – better alignment is seen with higher patient population sizes.
Small-treated patient populations also have a greater likelihood of exceeding the statutory best price, again reducing developer incentives to contract (does not apply to the Multiple Best Prices reform approach). Finally, differences were seen in the performance rebate – there was greater VBPA penetration with 50% performance rebate scenarios but higher payment misalignment compared to 100% performance rebate scenarios. The simulations suggest that except for the Multiple Best Prices approach, the likelihood of entering into a commercial payer VBPA contract and the ability of the VBPAs that are executed to align payments with the patient value received accurately is situationally dependent.
3.3. Simulation – Medicaid payment misalignment
presents payment misalignment results for five select state Medicaid agencies ordered by enrollee size separated by 60% and 90% therapeutic performance scenarios. The states range from the smallest to the largest with states closest to the median and quartile boundaries between with the enrollee numbers beneath the state name. Compared to the commercial plans, Medicaid plans see fewer scenarios with strong alignment (2% [10 of 480] versus 42% [113 of 266 contracted] dark green cells). The overall lower payment misalignment in the 90% contract performance scenarios is due to the statutory minimum 23.1% rebate regardless of VBPA arrangement performance.
Blue/purple shading is good for Medicaid but happens because of statutory and AMP, not ‘directly’ VBPAs. Red shading is bad for Medicaid; showing Multiple Best Prices is the only approach that is generally worth pursuing, with National Pooling coming close.
Multiple Best Prices, with all states participating directly, performed the best in terms of payment misalignment across state Medicaid programs, regardless of size. However, payment misalignment depended on the rebate and therapeutic performance, with a divergence between 60% and 90% therapeutic performance scenarios. As with the commercial plans, the scenarios with a 50% performance rebate and 60% therapeutic performance performed more poorly compared to the 100% performance rebate scenarios.
In the Multiple Best Prices under Select Participation (Select States) scenarios, the original 9 states receiving authorization from CMS to engage in VBPAs through a State Plan Amendment (SPA states) may execute VBPAs while the remaining state Medicaid plans do not. This approach had the second-lowest misalignment, outperforming National Pooling and Bundled Sales for 60% therapeutic performance scenarios. In the Complete Participation approach, adding the non-SPA Medicaid plans (All States) would improve (lower) misalignment for the 60% therapeutic performance scenarios but slightly worsen misalignment in the 90% product performance scenarios.
In contrast to the commercial market, for 5i products, Bundled Sales outperform National Pooling Sales in most scenarios because National Pooling has a secondary effect of lowering AMP, which leads to a lower absolute rebate amount, increasing payment misalignment. AMP drops under National Pooling because: more commercial VBPAs exist (fewer NC-BP black scenarios in ); the VBPAs have lower net prices (especially in the 100% performance rebate scenarios); the VBPAs are then included in the AMP calculation. Supplementary Appendix Table A-6 shows payment misalignment drops under National Pooling because VBPAs are included in the AMP calculation.
Bundled Sales 5i performed slightly worse on payment misalignment than Multiple Best Prices, where only the 9 SPA states directly contract. This occurs because Bundled Sales do not facilitate a large number of VBPAs in the commercial market. Thus AMP remains high (but not quite as high as AMP in Multiple Best Prices). In both cases (Multiple Best Prices limited to 9 states, Bundled Sales), nonparticipating states would receive the statutory minimum.
Thus, under current AMP rules for 5i products, Medicaid plans directly participating in Multiple Best Prices VBPA arrangements would achieve better payment alignment than those opting to receive the statutory minimum Medicaid rebate due to both the VBPA effectiveness AND the resulting lower AMP under the National Pooling 5i or the Bundled Sales 5i methods. States not directly participating are also better off with the Multiple Best Prices approach, under current AMP rules for 5i products, because they will receive larger absolute rebates as the Multiple Best Prices approach excludes commercial VBPA arrangements from the AMP calculation. And if the larger payers also received larger traditional rebates, excluding larger payers may increase AMP, and so the absolute rebate amount for nonparticipating Medicaid states. Bundled Sales and National Pooling perform equivalently for retail drugs.
Medicaid misalignment was comparatively higher than commercial misalignment for 90% contract outcome satisfaction given the expected statutory 23.1% rebate Medicaid receives (different baseline of comparison than commercial plan misalignment). In most instances, the payment misalignment is negative. Conversely, payment misalignment is positive when contract outcomes are satisfied 60% of the time.
3.4. AMP reform analysis
To better understand the impact of the distinct 5i and retail drug AMP calculation methods on the National Pooling approach, we repeated the payment misalignment analysis for Medicaid 5i products using the retail drug AMP calculation method. Under the retail drug method, VBPAs are excluded from AMP calculations, thus avoiding the AMP drop that occurs under the 5i AMP calculation. presents the results of this AMP reform analysis.
Reforming the National Pooling AMP calculation to mimic AMP calculations for retail drugs would improve National Pooling 5i product misalignment for the 60% therapeutic performance scenarios to roughly match the misalignment of Multiple Best Prices with the 9 SPA states. Those two methods already performed similarly without AMP reform for the 90% product performance scenarios. The nine individual states with SPAs perform better than the National Pooling; however, our model assumes risk aversion to best price exceeding the statuary minimum, and the results could improve if developers go above this benchmark.
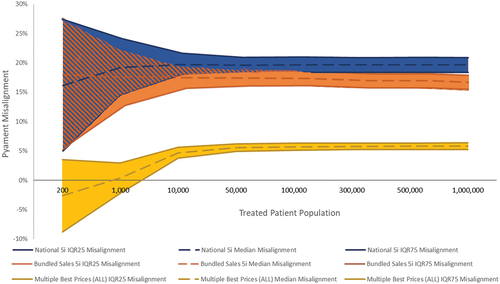
3.5. Misalignment variance
Variation in the misalignment across all scenarios is an important measure of VBPA predictability and important to examine, given the prior analysis focused on median payment misalignment. presents the variance in payment misalignment by treated population, comparing 60% therapeutic performance scenarios for Multiple Best Prices, National Pooling, and Bundled Sales approaches for 5i products. Variance in includes the median (dashed line) and upper and lower IQRs (Interquartile Range; solid lines). While the financial impact of this variance is present in all the reform approaches, Multiple Best Prices direct participation has the least variance and is closer to the x-axis (0% payment misalignment). Variance is comparable between Bundled Sales and National Pooling reform approaches, with overall variance reduced above 10k treated patients.
Figure 5. Variance analysis of payment misalignment by population size for National Pooling 5i, Bundled Sales 5i, and Multiple Best Prices (ALL) approaches.
4. Discussion
4.1. Summary of findings
This analysis includes elements different from our prior analysis regarding curative/durative therapies, specifically: including larger patient populations, the introduction of retail drugs as well as 5i products, expanded AMP considerations, and the obvious difference between ongoing dosing versus one-time administration therapies. Despite these different elements, the proposed reform approaches perform similarly between durable and chronically dosed therapies.
Bundled Sales is an unattractive approach as it performed poorly at most treated patient population sizes, consistent with and extending our prior durable therapies work. This is a fundamental statistics-driven challenge that policy tweaks cannot address.
Considering both availability and best misalignment performance, our simulations suggest that the Multiple Best Prices approach with all states directly contracting is the best solution for all stakeholders, including commercial payers, Medicaid payers, and developers. However, to achieve low misalignment, Multiple Best Prices does require developers to offer large rebates (larger than current statutory rebates and as much as 100%) for those instances when their products do not provide expected patient benefits.
However, without substantial personnel and data collection infrastructure development, many Medicaid plans will likely not be capable of directly participating in VBPAs. Addressing current state infrastructure concerns will require policies that either:
(1) Focus on expanding Medicaid VBPA contracting capability with dedicated resources and funding. Our analysis suggests a potentially large return under this approach.
(2) Create a centralized outcome reporting capability that has states contract on pooled outcomes. This lowers operational burden for developers, commercial plans, and state Medicaid.
However, even without such Medicaid VBPA capability enhancements, the Multiple Best Prices approach with only select states participating remains the second-best option for Medicaid.
A second challenge for the Multiple Best Prices approach may arise from developer concerns regarding VBPA flexibility. The requirement to offer each Medicaid state each VBPA version may impede VBPA customization for commercial plans by adding administrative complexity, implicitly disclosing competitive information, and in the view of some developers, requiring them not merely to offer the VBPA but to overcome whatever VBPA implementation challenges any individual state plan encounters. Interviewees indicated that a likely response to this incentive would be either offering a single VBPA structure in the commercial market or pursuing alternative performance-driven designs which avoid MDRP reporting, such as warranty models. Neither developers nor commercial payers expressed pleasure with this lack of practical VBPA flexibility against a historical background of substantial customization for each major commercial contract. In contrast to stated policy objectives, the Multiple Best Prices approach, as currently interpreted, may reduce payment innovation. Clarifying and reducing the specific obligations developers incur in describing the VBPAs available to states through the MDRP and the level of implementation support developers must provide to states to implement the VBPA would aid the adoption of VBPAs, and so the achievement of the payment innovation policy goals underlying them.
National Pooling presents a compromise between Bundled Sales having poor availability and misalignment but relative implementation ease and Multiple Best Prices with better performance but perceived commercial plan inflexibility and the inability of many states to participate directly.
National Pooling only achieves 75% retail availability for retail drugs compared to Multiple Best Prices. Still, it reaches that maximum at 1,000 treated patients, which makes it a viable approach for many therapies and plans.
For 5i products, National Pooling performs well for both commercial and Medicaid plans. However, to not reduce absolute rebate amounts to Medicaid, AMP reform to exclude VBPAs would be needed, as well as legislative action to allow national aggregation reporting of all similar commercial VBPAs rather than individual contract MDRP reporting. If enabled, National Pooling would allow more, smaller payers and Medicaid plans to participate in VBPAs through lower administrative costs and higher availability from lower MDRP rebate volatility reducing developer financial risk. National pooling would also enable developer flexibility to customize VBPAs to individual commercial plan preferences.
Finally, ultra-rare therapies will continue to face impediments that VBPAs could reduce by allowing annual rather than quarterly reporting to increase the number of cases and so reduce idiosyncratic volatility. Creating national registries, or similar outcomes tracking infrastructure, would reduce individual payer and developer implementation costs and encourage VBPA availability use.
4.2. Limitations
The input factors to include in the model were identified via targeted literature review and interviews. It is possible that some factors of practical significance were missed. A formal review of academic and gray literature may identify candidate enhancements for future simulations.
For products whose current MDRP rebate exceeds the statutory minimum, our simulations do not apply because our analysis enforces an assumption that developers would not offer a VBPA if the likelihood of exceeding the statutory minimum rebate exceeded one percent. In addition to that assumption, we assume that a 25% chance of encountering a treated patient in a quarter creates sufficient benefits to overcome VBPA transaction costs. These judgment-informed but arbitrary assumptions might not reflect real-world practice.
The evaluation metrics we employ (payment misalignment, number of participating plans, and potential number of VBPA-covered lives) are only a few of the metrics that could be used to judge VBPA performance. The VBPA scenarios we simulate are similarly limited to a few of the many that could be envisioned. We encourage others to examine additional designs with alternative performance tiering, rebate, and product performance levels.
5. Conclusion
Value-Based Purchasing arrangements provide a tool to mitigate the financial risk that uncertain drug performance poses to payers by sharing that risk with the drug developers. The recent Medicaid Drug Rebate Program rule for VBPAs enables increased adoption of these arrangements by reducing the financial risk and rebate volatility for developers and payers alike. Additional targeted refinements to pooling and AMP rules, increased experience, and administrative capabilities to reduce VBPA transaction costs would further enable the adoption of payment innovation. VBPAs can help transform therapeutic payment from expected value pricing to reimbursement driven by actual value received by patients.
6. Expert opinion
The MDRP Bundled Sales approach performed poorly overall, suggesting that it is not a viable approach. The Multiple Best Prices approach outperforms both alternative approaches. Still, issues remain, including (1) A lack of flexibility in the commercial market and (2) the inability of many states to participate directly due to infrastructure limitations. With modest additional reforms, the National Pooling approach could become a viable alternative that provides additional flexibility needed by the market. Additional actions that would benefit all VBPA mechanisms include:
Investment in national outcomes tracking platforms to reduce the incremental cost for any single therapy to be included in a VBPA.
Investment in state Medicaid and smaller payer capabilities to negotiate and administer VBPAs directly or through the encouragement of private sector firms to develop expertise, scale, and systems to do so on their behalf.
Amending MDRP to move from a quarterly to an annual report for therapies with <10,000 treated patients per year to reduce rebate volatility and administrative burden.
Declaration of interest
C Quinn: Reports financial support from a National Pharmaceutical Council research grant in support of this work. M Ciarametaro was employed by the National Pharmaceutical Council when this research was conducted. B Sils was employed by the National Pharmaceutical Council when this research was conducted. S Phares was employed by the National Pharmaceutical Council when this research was conducted. M Trusheim: Reports financial support from a National Pharmaceutical Council research grant in support of this work and other financial interests, including personal fees outside the scope of this work from Co-Bio Consulting LLC, Merck & Co., and Novartis. The authors have no other relevant affiliations or financial involvement with any organization or entity with a financial interest in or financial conflict with the subject matter or materials discussed in the manuscript apart from those disclosed.
Reviewer disclosures
One peer reviews is an employee of and holds stock in Takeda Pharmaceutical Company Limited (no direct conflicts with the work conducted in this study). Peer reviewers on this manuscript have no other relevant financial relationships or otherwise to disclose.
Author contributions
C Quinn: Wrote Manuscript, Designed Research, Performed Research, Analyzed Data, and Contributed New Analytical Tools. M Ciarametaro: Wrote Manuscript, Designed Research, Performed Research, Analyzed Data, and Contributed New Analytical Tools. B Sils: Wrote Manuscript, Designed Research, Performed Research, Analyzed Data, and Contributed New Analytical Tools. S Phares: Wrote Manuscript and Analyzed Data. M Trusheim: Wrote Manuscript, Designed Research, Performed Research, Analyzed Data, and Contributed New Analytical Tools. All authors approved the final version of the manuscript for publication.
Supplemental Material
Download MS Word (55 KB)Acknowledgments
We would like to thank Amanda Green for her contributions to the simulations and analysis as well as to all those who participated in the MBP framework refinement primary research interviews conducted as part of this research.
Supplementary material
Supplemental data for this article can be accessed online at https://doi.org/10.1080/14737167.2023.2193331
Additional information
Funding
References
- Tufts NEWDIGS. Precision financing solutions for durable/potentially curative therapies. [Internet]. Center for biomedical system design, institute for clinical research and health policy studies. Tufts Med Center. 2019 [Cited 2022 Mar 15]. Available from. https://newdigs.tuftsmedicalcenter.org/precision-financing-solutions-for-durable-potentially-curative-therapies/
- Gottlieb S, Kk P. A fair plan for fairer drug prices | health affairs forefront [Internet]. [Cited 2022 Mar 15]. Available from: https://www.healthaffairs.org/do/10.1377/forefront.20160711.055778/full/.
- Garrison LP, Towse A, Briggs A, et al. Performance-based risk-sharing arrangements—good practices for design, implementation, and evaluation: report of the ISPOR good practices for performance-based risk-sharing arrangements task force. Value in Health. 2013;16:703–719.
- AMCP Partnership Forum. Advancing value-based contracting. J Manag Care Spec Pharm. 2017;23:1096–1102.
- Tufts NEWDIGS. In: Policy actions for enabling precision financing Solutions [Internet]. Center for biomedical system design, institute for clinical research and health policy studies. Tufts Medical Center. 2021 [Cited 2022 Mar 15]. Available fromhttps://newdigs.tuftsmedicalcenter.org/wp-content/uploads/2021/02/P4C-Policy-Actions-201123.pdf
- Garrison LP, Jackson T, Paul D, et al. Value-based pricing for emerging gene therapies: the economic case for a higher cost-effectiveness threshold. J Manag Care Spec Pharm. 2019;25:793–799.
- Wenzl M, Chapman S. Performance-based managed entry agreements for new medicines in OECD countries and EU member states: how they work and possible improvements going forward [Internet]. 2019 [Cited 2022 Mar 15]. Report No.: 115. Available from: https://www.oecd-ilibrary.org/social-issues-migration-health/performance-based-managed-entry-agreements-for-new-medicines-in-oecd-countries-and-eu-member-states_6e5e4c0f-en.
- Neumann PJ, Chambers JD, Simon F, et al. Risk-sharing arrangements that link payment for drugs to health outcomes are proving hard to implement. Health Aff (Millwood). 2011;30:2329–2337.
- Ward AS, Linthicum MT, Drozd M, et al. Regulatory, legal uncertainties are barriers to value-based agreements for drugs. Health Affairs Blog. 2016;November 4.
- Goodman C, Villarivera C, Gregor K, et al. Regulatory, policy, and operational considerations for outcomes-based risk-sharing agreements in the. U S Market: Opportunities for Reform JMCP. 2019;25:1174–1181.
- White J. Medicaid “best price” approach to drug costs needs an upgrade [Internet]. STAT. 2017 [Cited 2023 Mar 8]. Available from: https://www.statnews.com/2017/11/10/drug-pricing-medicaid-value-based/.
- Sachs R, Bagley N, Lakdawalla DN. Innovative contracting for pharmaceuticals and medicaid’s best-price rule. J Health Polit Policy Law. 2018;43:5–18.
- Verma S. CMS’s proposed rule on value-based purchasing for prescription drugs: new tools for negotiating prices for the next generation of therapies. Health Affairs Blog. Internet]. 2020 [Cited 2023 Mar 8];June 17. Available from.;. https://www.healthaffairs.org/do/10.1377/forefront.20200617.728496/full/
- Garfield R, Dolan R. Costs and savings under federal policy approaches to address medicaid prescription drug spending [Internet]. KFF. 2021 Cited 2023 Mar 8;2021: Available from. https://www.kff.org/medicaid/issue-brief/costs-and-savings-under-federal-policy-approaches-to-address-medicaid-prescription-drug-spending/
- Glossary of common industry terms. [Internet]. Drug Pricing Lab. [Cited 2023 Mar 8] . Available from: https://www.drugpricinglab.org/tools/glossary/.
- Quinn C, Ciarametaro M, Sils B, et al. Medicaid best price reforms to enable innovative payment models for cell and gene therapies. Expert Rev Pharmacoecon Outcomes Res. 2022;0:1–13.
- MIT NEWDIGS FoCUS Project. Toolkit overview: precision financing solutions [Internet]. Paying for Cures. [Cited 2023 Mar 8]. Available from: https://payingforcures.mit.edu/toolkit-overview/precision-financing-solutions/.
- Trusheim MR, Cassidy WM, Bach PB. Alternative state-level financing for hepatitis C treatment—the “Netflix model.” JAMA. 2018;320:1977–1978.
- van Overbeeke E, Michelsen S, Toumi M, et al. Market access of gene therapies across Europe, USA, and Canada: challenges, trends, and solutions. Drug Discov Today. 2021;26:399–415.
- APEC. APEC Action Plan. On Rare Diseases [Internet]. 2018 [Cited 2023 Mar 8]. Available from: https://www.apec.org/docs/default-source/satellite/Rare-Diseases/APEC_ActionPlan.pdf.
- Fingertip FormularyTM Suite [Internet]. Decision Resources Group. [cited 2020 Jan 1]. Available from: https://decisionresourcesgroup.com/solutions/drg-knows-formulary/.