Abstract
The inhibitory effects of a black tea extract on fatty acid synthase were measured through inhibition kinetics. The Keemun black tea extract showed more potent inhibitory activity on fatty acid synthase than green tea extract. Additionally, the inhibitory ability of the black tea extract depended on the extracting solvent and the conditions used. Only 10–23% of the inhibitory activity from the black tea was extracted by the general method of boiling with water. The results suggested that the main fatty acid synthase inhibitors in black tea might be theaflavins. Which were more potent than epigallocatechin gallate or C75. The reaction site on the fatty acid synthase and the inhibition kinetics for the extract were different from those of epigallocatechin gallate or C75. In addition, Keemun black tea extract significantly reduced food intake, body weight and blood triglyceride of diet-induced obesity SD rats via oral administration.
1 Introduction
As reported by the World Health Organization in 1998, about 250 million adults around the world are obese, and at least 500 million adults are overweight [Citation1]. Obesity is associated with many diseases such as the type II diabetes [Citation2], cardiovascular disease [Citation3] and certain kinds of cancer [Citation4]. Therefore, medical treatment of obesity may become necessary when prevention is not possible.
Fatty acid synthase (acyl-CoA: malonyl-CoA C-acyltransferase (decarboxylating, oxoacyl- and enoyl-reducing and thioester-hydrolyzing), EC 2.3.1.85, ab. FAS) catalyzes the de novo synthesis of fatty acids from acetyl-CoA and malonyl-CoA in the presence of the reducing substrate NADPH [Citation5]. It was reported that FAS may play a role in the control of feeding behavior, and that the treatment of mice with the synthetic FAS inhibitor C75 can result in reduced appetite and dramatic weight loss. The accumulation of the substrate malonyl CoA through the inhibition of FAS appears to inhibit the expression of neuropeptide Y that promotes ingestion [Citation6,Citation7]. Therefore, FAS is a potential therapeutic target for obesity.
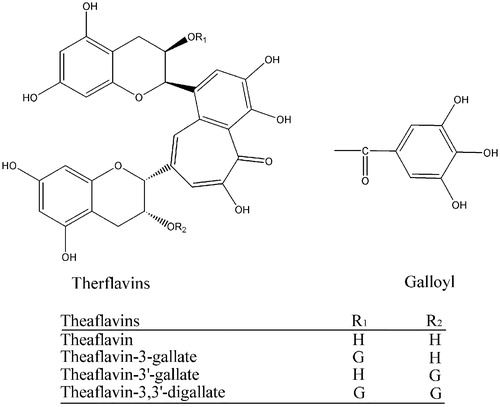
Tea (Camellia sinensis) is one of the most prevalent beverages in the world. Generally, bioactive components in black tea are different from those in green tea due to the different manufacturing methods. In the manufacturing process of black tea, a large proportion of monomeric flavan-3-ols such as catechins undergo oxidative polymerization in the presence of polyphenol oxidase leading to the formation of theaflavins, thearubigins, and other oligomers during a process commonly known as “fermentation”. These chemicals are responsible for the taste and the dark brown color of black tea. The theaflavins (TFs) are a mixture of theaflavin, theaflavin-3-gallate, theaflavin-3′-gallate, and theaflavin-3,3′- digallate, with structures shown in [Citation8].
Figure 1 Structure of theaflavins.
It has been reported that green tea can reduce body weight [Citation9,Citation10]. As shown in our previous work [Citation11], green tea and some catechin such as epigallocatechin gallate (EGCG) and epicatechin gallate (ECG) from green tea were inhibitors of FAS [Citation12,Citation13].
Here for the first time we report that a Chinese black tea contains FAS inhibitors and theaflavins may exert the main inhibitory effect. Moreover, our work shows that the black tea extract (BTE) can reduce body weight, food intake and triglyceride (TG) blood content of rats through oral intubations.
2 Materials and methods
The preparation, storage and use of chicken liver FAS was performed as described previously [Citation14]. The final purified enzyme was homogeneous on polyacrylamide gel electrophoresis in the presence and absence of SDS. Acetyl-CoA, malonyl-CoA, NADPH and theaflavins (purity>80%) were purchased from Sigma. Keemun black tea and green teas were purchased from Zhang yi yuan tea shop at Qianmen, Beijing, which is one of the most famous, highly reputed tea shops in China. All other reagents were local products of analytical grade.
The enzyme and reagents concentrations were determined by absorption measurements using the extinction coefficients according to the method previously described [Citation14].
The black tea leaf was extracted as follows. Crushed black tea leaf (1 g) was put in 20 ml solvent and stirred for 2 h at room temperature to get the BTE; the dry weight was 221 ± 8.8 mg after volatilizing solvent and drying at 120°C for 2 h.
Activities of FAS for the overall reaction (OA), ketoacyl reduction (KR) and enoyl reduction (ER) were determined with an Amersham Pharmacia Ultrospec 4300 pro UV–Vis Spectrometer at 37°C by following the decrease in NADPH at 340 nm. The assay solution used for these reactions has been described previously [Citation12]. The reaction mixture for the overall reaction contained 100 mM potassium phosphate buffer, pH 7.0, 1 mM EDTA 3 μM acetyl-CoA, 10 μM malonyl-CoA, 35 μM NADPH and 10 μg FAS in a total volume of 2.0 ml. The ketoacyl reduction assay mixture contained 40 mM ethyl acetoacetate, 35 μM NADPH, 1 mM EDTA and 10 μg FAS in 100 mM potassium phosphate buffer, pH 7.0. The enoyl reduction reaction mixture contained 40 mM ethyl crotonate, 35 μM NADPH, 1 mM EDTA and 60 μg FAS in 10 mM potassium phosphate buffer, pH 6.3.
The inhibitor solution (1–10 μl) was added to the assay mixture, followed by the FAS solution to start the reaction in a total volume of 2 ml. The activity of FAS was assayed as Ai, and the control activity with same solvent only was assayed as A0, and the Ai/A0 was the relative activity. This inhibition was caused by the non-covalent fast combination of inhibitor with enzyme and was usually reversible. The concentration of inhibitor for half inhibition (IC50) was obtained from a plot of residual activity versus inhibitor concentration.
After the enzyme solution was mixed with inhibitor solution (in 50% ethanol for BTE) with the ratio of 50:1 (v/v), aliquots were taken to measure activity at the indicated time intervals. It was checked that 1% ethanol did not cause any changes in FAS activity at the indicated time intervals. The activity of native enzyme was used as the control. The time course of remaining activity was obtained because of its characteristic time-dependence and this inhibition was chiefly irreversible due to the covalent reaction of the inhibitor with the enzyme. The rate constant kobs of inactivation was obtained from the slope of a semilog plot of the time course.
The mature rats for experiments were the third generation animals of S-D (Sprague-Dawley) close type obtained from the Research Center of Experimental Animal, Beijing. After being fed with a high-calorie diet for 10 days, the weight of each rat was around c. 320 g. During the course of the experiment, the rats were fed with standard diet in the Animal Center of Academy of Chinese Military Medical Sciences. Extracted with the optimal solvents (50% ethanol solution v/v), the BTEs were evaporated at room temperature, and then dispersed in double distilled water of the same volume. The mixtures were centrifuged, and the supernatant stored at 4°C ready for use in the experiment. The supernatant contained more than 35% of the inhibitory activity of the extracts the in optimal solvent. The fenfluramine pills (antiobesity drugs), a product of Shanghai Institute of Pharmaceutical Industry, were crushed, dissolved in double distilled water (1 mg/ml), and then stored at 4°C for use.
A total of 30 rats were weighed and randomized into 3 groups. The weight and food intake of the rats were measured every other day and food intake was calculated on the same day that the rats were weighed. Three groups were dosed with 2 ml distilled water as control, fenfluramine as positive control and Keemun BTE aqueous solution per rat per day via oral intubations, respectively over a period of 10 days. The animals were then fasted, for about 12 h until they were euthanized following the protocol for experimental animals in the Biology Department, Graduate School of CAS. After anaesthetizing, the arterial blood was collected, placed into a pre-labelled tube (10 mg/ml EDTA, 0.9% NaCl) and mixed. The mixture was centrifuged at 2000 rpm for 60 s and the supernatant was stored in an ice-box. The blood sugar [Citation15], cholesterol [Citation16,Citation17], triglyceride [Citation18] and low density lipoprotein [Citation19,Citation20] were measured. The same procedure was repeated for all rats in all groups. At the same time of taking the blood samples, the whole rat liver in each group was rapidly weighed and cooled with ice. Cold extracting buffer (0.1 M potassium phosphate buffer, 0.07 M KHCO3, 1 mM EDTA, 1 mM DTT, 1% glycerol and pH7.8) was added to the livers of each group. The mixture was homogenized, centrifuged twice (initially at 8000 rpm for 30 min, and then at 18000 rpm for 60 min), and the FAS activity of the supernatant measured.
Statistical analysis was performed using SPSS10.0 for Windows. Differences in mean values between groups were estimated by Student's t-test. Data was expressed as mean ± standard error of mean.
3 Results
3.1 Reversible inhibition on FAS by Keemun BTE
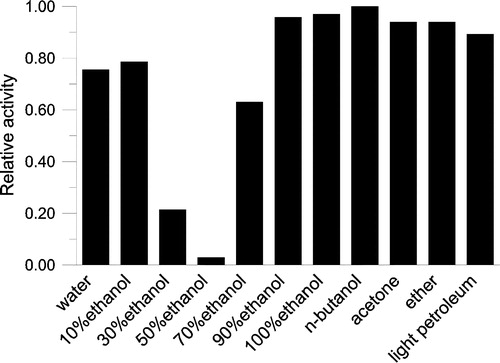
Different solvents with various polarities were tested to extract Keemun black tea. The results in showed that 50% ethanol solution was the optimal solvent for extracting the FAS inhibitor from Keemun black tea leaf.
Figure 2 Extracting efficiency by different solvents. Keemun black tea (1 g) was dipped in 10 ml different solvents respectively with stirring for 2 hours and the extracts were collected. The extract solution (1 μl) was added to the assay system for OA activity before initiating the reaction by FAS. The final enzyme concentration was 0.02 μM. The relative activity of FAS was measured.
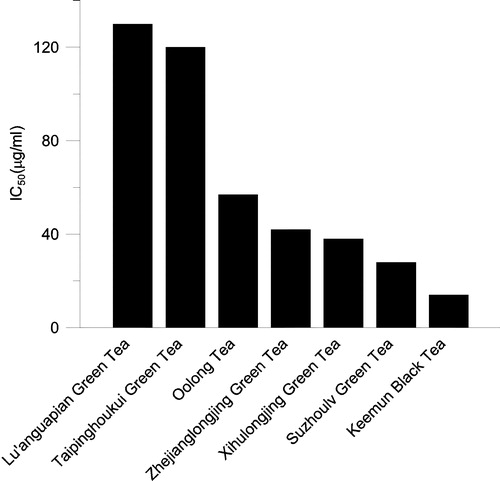
The IC50 values of extracts with 50% ethanol from several kinds of well known Chinese tea are shown in . The data indicated that Keemun black tea extract, which is a famous tea and produced in the southern Anhui province of China, exhibited stronger inhibitory ability on FAS than those of green teas.
Figure 3 Half-inhibition concentration (IC50) on FAS of extracts with 50% ethanol from several well known Chinese teas. The final enzyme concentrations was 0.02 μM.
Some other factors including temperature and time of extraction and tea leaf form were tested and the results are shown in . It was found that the solvent used was the most important factor, whereas temperature and time were secondary ones. Whether or not the tea leaf was crushed seemed to be of little consequence.
Table I. Extraction efficiency of Keemun black tea under different conditions.
What is very interesting is that the most general method of extraction with boiling water is not the optimal method to produce potent FAS inhibition. The data listed in shows that the IC50 values of the BTEs which were obtained with boiling water for 10–720 minutes was higher (less potent) than those of the BTEs which were obtained with 50% ethanol by 4.3–10 fold. This result means that only 10–23% of the effective inhibitors of FAS were extracted out from the black tea leaf by boiling water.
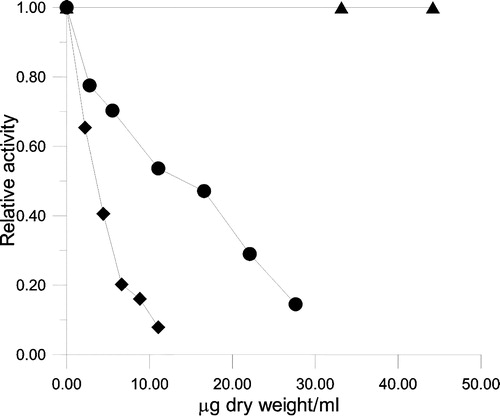
The inhibitory activity of Keemun BTE on the OA, KR and enoyl reduction of FAS is shown in . KR and ER are two of the seven serial partial reactions of FAS. The IC50 values of Keemun BTE were 3.1 μg dry weight/ml and 14.4 μg dry weight/ml for OA and KR respectively, while the extract did not exhibit an obvious inhibitory effect on ER. The IC50 value on KR was 5-fold that on OA. This ratio was lower than that of EGCG which is the main inhibitor of FAS existing in green tea [Citation12].
Figure 4 Inhibition of FAS by different concentrations of Keemun BTE. The relative activity of the OA (♦), KR (•), and ER (▴) was measured. The final enzyme concentrations were 0.02 μM for OA, 0.02 μM for KR, and 0.12 μM for ER.
3.2 Irreversible inhibition on FAS by Keemun BTE
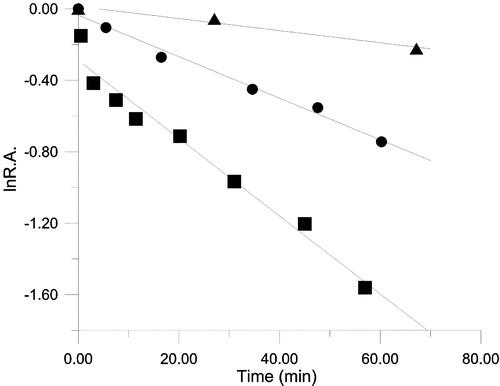
Keemun BTE exhibited time-dependent inhibition of FAS (). With a BTE concentration of 100.6 μg dry weight/ml, kobs values were 0.021, 0.012 and 0.0034 min− 1 for OA, KR and ER respectively. The less than 2-fold difference in the inactivation rate between OA and KR suggests that the inhibition is mainly related to β-ketoacyl reductase activity.
Figure 5 The inhibitory time course for OA (♦), KR (•) and ER (▴) of FAS in the presence of BTE. The FAS solution and BTE (in 50% ethanol) were mixed in the ratio 50:1 (v/v) in 0.1M phosphate buffer pH7.0, the final concentration of FAS and BTE being 1.9 μM and 100.6 μg dry weight/ml respectively, and aliquots were taken to assay remaining activity in these three reactions at the indicated time intervals. R.A. = relative activity to control.
The result of substrate protection on the inhibition of the BTE is given in and it is seen that the apparent rate constant was only reduced by about 30–40% by preincubation with each substrate. Therefore, all the substrates had no obvious protection effect.
Table II. Rate constants for inactivation of FAS by Keemun BTE with protection by three substrates.
3.3 Reversible inhibition of FAS by TFs
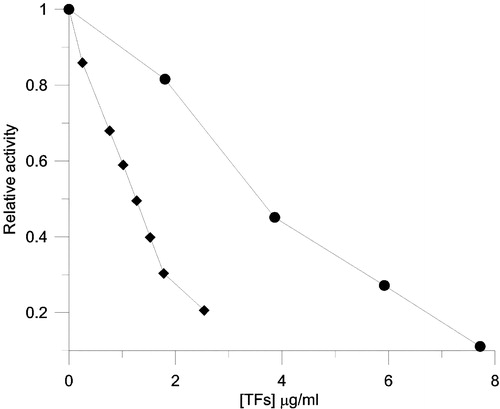
In the manufacturing process of black tea most gallated catechins, which are the major FAS inhibitors in green tea, undergo oxidative polymerization. However, inhibitory ability remains or even increases in black tea. Therefore, TFs known as a major product of fermentation of tea were tested as FAS inhibitors. The inhibitory activities of TFs on the OA and KR are shown in . The IC50 values of TFs were 1.27 μg/ml (1.77 μM) and 3.58 μg/ml (5.00 μM) for the OA and KR respectively. The IC50 value of TFs for OA was much lower than that of EGCG and cerulenin which was reported as 24 μg/ml (52 μM) and 20 μg/ml (53.7 μM) for OA respectively [Citation12,Citation21].
Figure 6 Inhibition of FAS by different concentrations of TFs. The relative activity of the OA (♦), KR (•) was measured. The final enzyme concentration was 0.02 μM, and TFs concentrations were 0–2.6 μg/ml (3.63 μM) for OA and 0–7.7 μg/ml (10.7 μM) for KR.
3.4 Irreversible inhibition of FAS by TFs
The kinetics time course of inactivation on OA and KR in the presence of 26.5 μM (19 μg /ml) TFs is shown in . The rate constant kobs was 0.01 and 0.004 min− 1 respectively. The results of substrate protection on the inactivation of FAS by 34.9 μM TFs are listed in . The inactivation was slowed by NADPH. The result suggested that this time-dependent inactivation may be related to NADPH binding site on the β-ketoacyl reductase domain.
Figure 7 The time course for inhibition of OA(▪) and KR(•) of FAS in the presence of TFs. The FAS and TFs solution were mixed in 0.1M phosphate buffer pH7.0, the final concentration of FAS and TFs were 1.9 μM and 26.5 μM respectively, and aliquots were taken to assay the relative activity of these two reactions at the indicated time intervals. R.A. = relative activity to control.
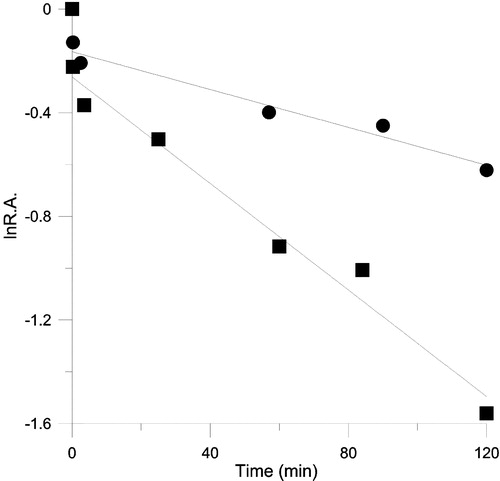
Table III. Rate constants for inactivation of FAS by TFs with and without substrate protection.
The dependence of the inactivation rate on TFs concentration was examined. In these experiments TFs concentrations of 12.5–37.5 μg/ml (17.4–52.3 μM) were employed. The plot of kobs vs [TFs] is shown in . This plot showed a hyperbola and the double reciprocal plot () was a straight line. This result exhibited saturation kinetics, suggesting that inactivation of FAS by TFs was an affinity labeling reaction involving two steps. The first step involves reversible association of inactivator with the specific site of enzyme; then the enzyme-inactivator complex (E − I) undergoes irreversible chemical modification to give inactive EI as in Equation (1).
where k is the first-order rate constant of the modification reaction, Ks is the dissociation constant of the E − I complex. While k is rate-limiting, Ks is the apparent half-saturation constant. The plot of 1/kobs vs 1/[I] shown in was linear and was fitted to Equation (2).
Values for Ks of 29.2 μg/ml (40.7 μM) and k of 0.035min− 1 were calculated from .
Figure 8 The time course for inhibition of FAS by different concentrations of TFs. The concentration of FAS in the inactivation system was 2.0 μM. (A) Observed first-order rate constants for different concentrations of TFs. (B) Plot of 1/Kobs versus 1/[TFs].
![Figure 8 The time course for inhibition of FAS by different concentrations of TFs. The concentration of FAS in the inactivation system was 2.0 μM. (A) Observed first-order rate constants for different concentrations of TFs. (B) Plot of 1/Kobs versus 1/[TFs].](/cms/asset/aed5d4ac-5787-4548-82e5-d91b04028bd4/ienz_a_114867_f0008_b.jpg)
3.5 Inhibition kinetics of the BTE and TFs
The inhibition kinetics of Keemun BTE on OA and KR of FAS for each substrate were studied. The inhibition by BTE represented a mixed pattern of competitive with noncompetitive inhibitor against substrate NADPH, and showed noncompetitive inhibition against the substrate acetyl CoA or malonyl CoA. Ki values were obtained through secondary plots of slopes or Y-axis intercepts of Lineweaver–Burk plots vs [I], where Ki is the dissociation constant of the enzyme-inhibitor complex. The inhibition patterns and Ki values are listed in . For substrate NADPH the results showed that the binding of NADPH to FAS partly affected the binding of the inhibitor. For substrate acetyl CoA or malonyl CoA the noncompetitive pattern showed that the substrate did not affect the binding of the inhibitor to the enzyme.
Table IV. Inhibition patterns and parameters for EGCG, Keemun BTE and TFs.
For the β-ketoacyl reductase the Lineweaver–Burk plot showed that BTE was a competitive inhibitor against substrate NADPH so that the inhibitors may compete with substrate NADPH for the same binding sites on β-ketoacyl reductase.
The same experiments for TFs were performed and similar kinetics results were obtained. The inhibition patterns and Ki values of the BTE, TFs and EGCG are summarized in . It was found that the inhibition patterns of BTE for each substrate were the same as those for TFs, and their inhibition patterns against acetyl CoA were both different from EGCG. The Ki values of TFs were much less than that for EGCG indicating that TFs bound to FAS much more tightly than EGCG did.
3.6 The effects of Keemun BTE on body weight, food intake and blood lipid in rats
The body weight of rats dosed with fenfluramine solution and Keemun BTE decreased substantially are 10 days (). Mean values for body weight change of the control group and dosed groups showed a significantly difference (P < 0.01). The mean values for body weight decreased approximately 18.7 g (6%) and 13.8 g (4%) for the groups dosed with BTE and fenfluramine respectively over 10 days.
Figure 9 The effects on body weight and food intake by Keemun BTE and fenfluramine. The results are expressed as means ± s.e. of 10 SD rats. (A)The effect on the body weight over 10 days (B) The effect on the average food intake over 10 days. **P < 0.01vs. Control group, n = 10.
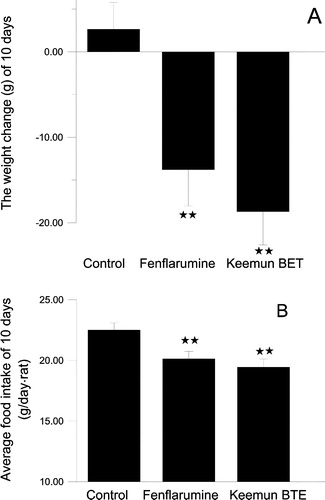
The average food intake values for the two dosed groups also significantly decreased over 10 days (). The mean values of food intake decreased approximately 13% and 10% for the groups dosed with Keemun BTE and fenfluramine respectively over 10 days. The reduction of food intake was consistent with that of the reduction in body weight.
The results of analysis for glucose, triglycerides, cholesterol and LDL plasma levels, and FAS activity in the rat livers are listed in . The data showed that only the mean value of triglycerides for the group dosed with BTE when compared with that of the control group (P = 0.039) showed a significant difference (76 ± 8%), whereas the plasma other indexes did not. FAS activities of each group were obviously different. The FAS activities in the liver of the groups dosed with fenfluramine and the BTE were 73 ± 6% and 59 ± 10% respectively when compared with that of the control group. It is possible that BTE inhibits liver FAS activity of rats after oral intubation.
Table V. Lipid index in plasma and FAS activity in liver analysis for rats.
4 Discussion
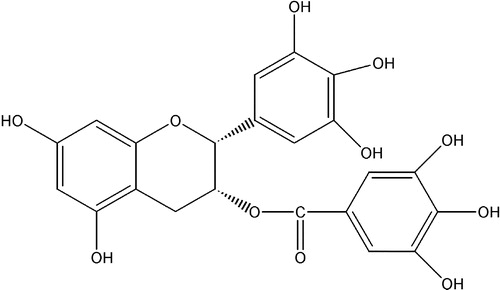
It was reported that gallated catechins in green tea are inhibitors of FAS [Citation12], and that EGCG, which is the main gallated catechin in green tea (structure shown in ), can reduce the body weight of mice [Citation9]. During the manufacturing process of black tea, most of catechins in tea leaves are oxidized to form the various quinones such as theaflavins and thearubigens [Citation22]. Does the ability of inhibiting FAS and reducing body weight still remain in black tea? Our results showed that Keemun black tea can inhibit FAS and reduce body weight significantly. Taking into consideration that black tea is more popularly consumed than green tea in the world, these results are encouraging and some black teas could be promising in their application as antiobesity food or beverage in the future.
Figure 10 Structure of EGCG.
The extraction method significantly affects the efficiency of extracting FAS inhibitors from Keemun black tea. The optimum solvent for extraction was 50% ethanol which is over 4-fold more efficient than boiling water. It is worth noting that the optimum extraction method is not the generally used method with boiling water. This result suggested that the use of black tea for fat-reduction may need to be improved and optimized.
The potent inhibition of FAS by TFs and the similar inhibition kinetics patterns given by TFs and BTE suggested that TFs may be the main effective components responsible for the FAS inhibitory activity of black tea. The reversible inhibitory potency of TFs is one order of magnitude greater than that of EGCG and cerulenin. The IC50 of TFs, EGCG and cerulenin were 1.27 μg/ml (1.77 μM), 24 μg/ml (52 μM) [Citation12] and 20 μg/ml (53.7 μM) [Citation21] respectively. The irreversible inhibitory potency of TFs is close to that of C75. The kobs/[I] of TFs was 0.377 min− 1mM− 1 (0.01 min− 1/0.0265 mM), and the parameters for the fast phase and slow phase of C75 were 1.02 and 0.134 min− 1mM− 1 (0.326 min− 1/0.32 mM and 0.043 min− 1/ 0.32 mM) respectively [Citation12]. TFs seems to be more promising than EGCG and C75 because of their high activity and innoculous nature.
The inhibition behavior of TFs is different from that of EGCG or C75. The proportion of the inhibition of ketoacyl reaction in that of OA for TFs is lower than that for EGCG calculated from their IC50 values [Citation12]. The inhibition pattern of TFs against acetyl CoA is different from that of EGCG. C75 does not exhibit reversible inhibition even though the C75 concentration is very high [Citation12]. Inhibition by C75 is a second-order reaction instead of affinity labeling which is exhibited by TFs. However the structures of TFs are distinct from that of EGCG and C75 so that, TFs are considered as a new type of FAS inhibitor.
The effect of C75, a synthetic inhibitor of FAS, on the expression of key orexigenic and anorexigenic neuropeptide was studied, and the results indicated that C75 primarily acts on the signal pathway leading to the expression of neuropeptide Y and agouti-related protein in lean and obese mice [Citation23]. Our work showed that the body weight, food intake and FAS activity of the rat liver all decreased when treated with Keemun BTE which provides a clue that some links might exist among food intake, body weight and FAS activity.
It has been reported that the increase in malonyl CoA is the primary reason for the inhibition of some key neuropeptides [Citation6,Citation7]. Since it is self-evident that the inhibition of FAS can lead to an increase in its substrate malonyl CoA, theoretically all FAS inhibitors can reduce food intake and body weight if these compounds can pass through the barriers and reach their target. All the main known FAS inhibitors such as C75, cerulenin and EGCG behave in this way. Here we showed that Keemun BTE significantly reduced body weight and food intake of SD rats and the extract contains a new type of FAS inhibitor. Therefore, it is reasonable to consider FAS as an effective fat-reducing target.
Acknowledgements
This work is supported by the Grant 30270324 of China National Science Foundation and the Procter & Gamble Company.
Related Research Data
References
- Bray GA. Contemporary diagnosis and management of obesity 1998, Newtown
- Serrano Rios M. Eur J Clin Invest 1998; 28(Suppl 2)14–17, discussion 17–18
- Goran MI, Ball GD, Cruz ML. J Clin Endocrinol Metab 2003; 88: 1417–1427
- Calle EE, Rodriguez C, Walker-Thurmond K, Thun MJ. N Engl J Med 2003; 348(17)1625–1638
- Smith S. FASEB J 1994; 8(15)1248–1259
- Loftus TM, Jaworsky DE, Frehywot GL, Townsend CA, Ronnett GV, Lane MD, Kuhajda FP. Science 2000; 288(5475)2379–2381
- Bouchard C. N Engl J Med 2000; 343(25)1888–1889
- Balentine DA, Wiseman SA, Bouwens LC. Crit Rev Food Sci Nutr 1997; 37(8)693–704
- Kao YH, Hiipakka RA, Liao S. Endocrinology 2000; 141(3)980–987
- Dulloo AG, Seydoux J, Girardier L, Chantre P, Vandermander J. Int J Obes Relat Metab Disord 2000; 24(2)252–258
- Tian WX, Li LC, Wu XD, Chen CC. Life Sci 2004; 74(19)2389–2399
- Wang X, Tian W. Biochem Biophys Res Commun 2001; 288(5)1200–1206
- Wang X, Song KS, Guo QX, Tian WX. Biochem Pharmacol 2003; 66(10)2039–2047
- Tian WX, Hsu RY, Wang YS. J Biol Chem 1985; 260(20)11375–11387
- Trinder P. Ann Clin Biochem 1969; 6: 24–27
- Allain CC, Poon LS, Chan CS, Richmond W, Fu PC. Clin Chem 1974; 20(4)470–475
- Roeschlau P, Bernt E, Gruber W. Z Klin Chem Klin Biochem 1974; 12(5)226
- Nagele U, Wahlefeld AW, Ziegenhorn J. Methods of enzymatic analysis3rd edn, HU Bergmeyer, 1985; 8: 12–18
- Expert Panel. Arch Intern Med 1988; 148(1)36–69
- Expert Panel. JAMA 1993; 269(23)3015–3023
- Vance D, Goldberg I, Mitsuhashi O, Bloch K. Biochem Biophys Res Commun 1972; 48(3)649–656
- Graham HN. Prev Med 1992; 21(3)334–350
- Shimokawa T, Kumar MV, Lane MD. Proc Natl Acad Sci USA 2002; 99(1)66–71