
Abstract
Early stages of avascular necrosis of the femoral head (AVNFH) can be conservatively treated with hyperbaric oxygen therapy (HBOT). This study investigated how HBOT modulates inflammatory markers and reactive oxygen species (ROS) in patients with AVNFH. Twenty-three male patients were treated with two cycles of HBOT, 30 sessions each with a 30 days break between cycles. Each session consisted of 90 minutes of 100% inspired oxygen at 2.5 absolute atmospheres of pressure. Plasma levels of tumor necrosis factor alfa (TNF-α), interleukin 6 (IL-6), interleukin 1 beta (IL-1β) and ROS production were measured before treatment (T0), after 15 and 30 HBOT sessions (T1 and T2), after the 30-day break (T3), and after 60 sessions (T4). Results showed a significant reduction in TNF-α and IL-6 plasma levels over time. This decrease in inflammatory markers mirrored observed reductions in bone marrow edema and reductions in patient self-reported pain.
Introduction
Avascular Necrosis of the femoral head (AVNFH) is a musculoskeletal condition resulting from reduced blood perfusion of the bone tissue. The natural progression of the disease often results in degenerative joint disease or complete joint dissolutionCitation1. Pathophysiology of AVNFH can be a result of both traumatic and atraumatic factorsCitation2. Currently, AVNFH is typically treated using more invasive interventions such as core decompression or total hip replacement. Ongoing studies are examining new avenues for more conservative treatments, one of which is hyperbaric oxygen therapy (HBOT). HBOT has been found to be a safe and effective therapeutic modality for management of patients with early stages of AVNFH, reducing self-reported pain scores, localized edema, and lesion size upon radiographic imagingCitation3,Citation4.
While the mechanism of action underlying the observed therapeutic effects of HBOT is not fully understood, it is known that the physio-chemistry that drives the action is a result of two factors: 100% inspired oxygen and exposure to elevated atmospheric pressure. Increased environmental pressure results in a higher number of molecules diffusing from the alveoli into the capillaries in the lungs. This coupled with 100% inspired oxygen results in a higher level of oxygen dissolved in the plasma. As a result, more oxygen is then diffused or transported to the surrounding body tissuesCitation5.
A proposed mechanism of action for HBOT is the resulting increase in reactive oxygen species (ROS) formation which serve as signaling molecules for multiple intracellular cascadesCitation6–8. A rat model developed by Asano et al. showed that HBOT elevated levels of basic fibroblast growth factor, hepatocyte growth factor, vascular endothelial growth factor, and growth response protein-1 stimulating angiogenesis and increasing blood perfusion in ischemic hind limbsCitation9. Similar tissue regenerative properties were seen by Milovanova et al. who demonstrated the ability of HBOT to stimulate vasculogenic stem cell growth and differentiationCitation10. The increase in these protein levels and differentiation of cells may be linked to ROS’s ability to initiate downstream changes in several transduction cascades such as stem/progenitor cell mobilisation from bone marrow and lowering monocyte chemokine synthesis, which ultimately lead to wound neovascularisation and improved post-ischemic tissue survival, respectivelyCitation8,Citation11.
To date, there is limited information on the molecular mechanism of HBOT action on patients with AVNFH. Key players in bone turnover include specific cytokines osteoprotegerin (OPG), receptor activator of NF-kB (RANK), and of its ligand (RANKL). Any disturbance in the OPG/RANKL/RANK equilibrium will result in a shift to either bone resorption or formation.
Previous studies have indicated interaction between inflammatory factors and the OPG/RANK/RANKL homeostasisCitation12,Citation13. In particular, the interrelations of interleukin 6 (IL-6) and interleukin 1 beta (IL-1β), RANKL, and tumor necrosis factor alfa (TNF-α), highlight the interplay in bone resorption in the pathophysiology of AVNFHCitation13. The aim of our study is to investigate HBOT effect on the ROS production in AVNFH patients and its alteration of inflammatory cytokines levels.
Material and methods
Patient selection
The study involved 23 male patients () with unilateral femoral head necrosis, including post-traumatic femoral head necrosis, post steroid therapy femoral head necrosis, femoral condyles necrosis and other aseptic bone necrosis. Patients with others underlying pathologies were excluded from this study. Informed consent was obtained from all patients before the start of the study. This study was approved by the Institutional Ethics Committee of the University of Padova and was conducted in accordance with the ethical standards of the Helsinki Declaration. Every patient had a plain X-ray of the hip in two projections (anterior and lateral) and then had magnetic resonance imaging (MRI) to stage their pathology according to the Ficat classificationCitation14 and previously publishedCitation3,4. Ficat and Arlet proposed the original classification of avascular necrosis in 1964 before the advent of MRI; it is staged based on plain X-ray. Stage I is pre-radiologic finding, presenting with pain only, and is the earliest clinical manifestation of the syndrome. The crescent sign is a late Ficat stage II finding, a linear subcortical lucency representing a fracture line and impending femoral head collapse. Stages I–II were described as early stages and Stages III and IV were classified as late stages.
Table 1. Demographic features and levels of severity of disease of patients with ANFH.
Working protocol
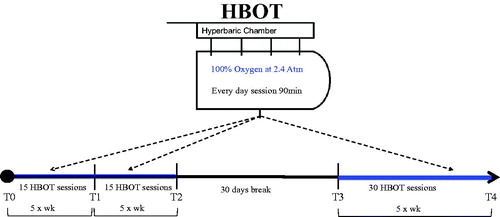
As previously describedCitation3,Citation15, patients were exposed to 100% inspired oxygen at 2.5 atmospheres absolute in a multiplace pressure chamber for 90 min using an overboard demand regulator and oral-nasal mask. All patients received 30 treatments of HBOT for 5 days a week for a period of 6 weeks. After a 30-day break, a second 30 HBOTs cycle was given ().
Figure 1. Experimental design of working protocol with timeline of blood samples collection.
Blood sample collection
Blood samples were drawn from the antecubital vein. A total of 5 ml were collected in heparinized vacutainer tubes (Becton Dickinson and Company, UK). Plasma was separated by centrifuge at 1000 g for 10 min at 4 °C. Blood samples were collected at specific points during patient treatment to analyse IL-1β, IL-6 and TNF-α plasma levels as well as ROS generation as graphically represented in . Blood was collected prior to initiation of HBOT (T0), after 15 sessions of HBOT (T1), after 30 sessions of HBOT (T2), after the 30-day break between HBOT cycles (T3), and after patient completion of HBOT (T4).
Quantification of plasma levels of inflammatory markers
IL-1β, IL-6 and TNF-α plasma levels were determined by ultrasensitive ELISA immunoassays (R&D Systems, Minneapolis, MN, USA), according to the manufacturer’s instructions. A nine well micro-plate was pre-coated with monoclonal antigen specific antibodies designed to target our inflammatory markers of interest (IL-1β, IL-6 or TNF-α), three plates per antigen for a positive and negative control standards to ensure there was no cross contamination. Standards and samples (∼200 µL) were pipetted into the wells and the immobilized antibody bound any antigen of interest present. Following the washing procedure, an enzyme-linked, antibody specific, polyclonal antibody was added to the wells. After subsequent washing, a substrate solution was added to the wells and color developed in proportion to the amount of cytokine bound at the initial step. The signal was then spectrophotometrically measured at a wavelength of 450 nm. Plasma levels of inflammatory markers in pg/mL were then calculated according to optical density of each well. This process was repeated for the plasma isolated from each blood sample taken and aggregated for each specific point of measure (T0, T1, T2, etc.) for comparison.
ROS detection
A X-band electron paramagnetic resonance (EPR) instrument (E-scan-Bruker BioSpin, GmbH, MA) was used for determination of ROS. The instrument is designed to function with very low concentrations of paramagnetic species in small (50 µL) samples. For each recruited participant, the ROS production rate was determined by means of a recently implemented EPR methodCitation16,Citation17. Determination involved analyse 50 µL plasma samples treated with a CMH (1-hydroxy-3-methoxycarbonyl-2,2,5,5-tetramethylpyrrolidine) probe solution (1:1), in order to transform ROS into more stable radical species that are EPR detectable. 50 µL of the obtained solution was then put in a glass EPR capillary tube (Noxygen Science Transfer & Diagnostics, Germany) that was placed inside the cavity of the E-scan spectrometer for data acquisition.
Acquisition parameters were inclusive of a microwave frequency of 9.652 GHz; modulation frequency of 86 kHz; modulation amplitude of 2.28 G; sweep width of 60 G, microwave power of 21.90 mW, number of scans was 10; and receiver gain was equivalent to 3.17·10. Sample temperature was first stabilized and then kept at 37 °C by the temperature and gas controller Bio III unit, interfaced to the spectrometer. Spectra were recorded and analysed using the Win EPR software (2.11 version) supplied by Bruker. EPR measurements allowed us to obtain a relative quantitative determination of ROS production rate in samples. All data were, in turn, converted into absolute concentration (µmol·min−1) by adopting CP• (3-Carboxy-2,2,5,5-tetramethyl-1-pyrrolidinyloxy) stable radical as an external reference. This process was also repeated for the plasma isolated from each blood sample taken and aggregated for each specific point of measure (T0, T1, T2, etc.) for comparison.
Statistical analysis
Data were analysed using repeated Shapiro-Wilk-s tests. Experimental data were compared using ANOVA repeated measures with Tukey-s multiple comparison test to further check the among-groups significance. Data are presented as means ± SD All p values were two sided and a p value < .05 was considered statistically significant.
Results
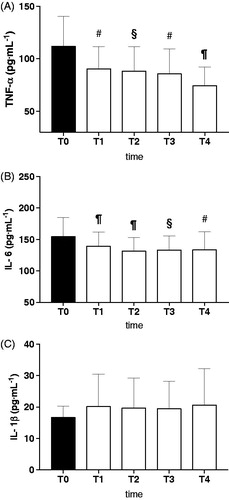
A significant reduction in TNF-α levels from T0 (111.87 ± 28.74 pg·mL−1) to T1 (90.32 ± 21.26 pg·mL−1; p < .01) was observed (). Significant reductions were also seen between T0 and T2 (88.25 ± 23.32 pg·mL−1; p < .001), T3 (85.77 ± 23.72 pg·mL−1; p < .01) and T4 (74.46 ± 11.81 pg·mL−1; p < .001). Similarly, significant reductions in IL-6 levels were seen between T0 (154.47 ± 30.52 pg·mL−1) and T1 (139.14 ± 22.82 pg·mL−1; p < .0001), T2 (131.69 ± 21.44 pg·mL−1; p < .001), T3 (133.04 ± 22.50 pg·mL−1; p < .001), and T4 (133.38 ± 29.00 pg·mL−1; p < .001) (). No significant change in IL-1β plasma levels were seen in any subjects (). Of note, as previously described within the literature, calculated baseline plasma cytokine levels indicate an elevated inflammatory state in patients with AVNFH when compared to normal healthy individualsCitation18,Citation19.
Figure 2. Effects of HBOT on plasma levels (pg·mL−1) of: (A) TNF-α, 9B) IL-6 and 9C) IL-1β in ANFH patients are shown. T0 before the beginning of the first HBOT cycle of treatments (filled bars), T1: after 15 HBOT, T2: after 30 HBOT, T3: beginning of the second HBOT cycle after a 30 days break, T4: end of the second HBOT cycle (empty bars). Data are presented as mean ± SD. Significance of differences: P < .05 (*), P < .01 (#), P < .001 (§), P < .0001 (¶).
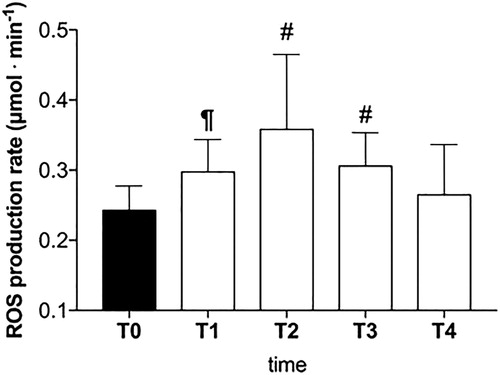
ROS production increased from T0 (0.24 ± 0.03 µmol·min−1) to T1 (0.29 ± 0.05 µmol·min−1; p < .01) and T2 (0.35 ± 0.10 µmol· min−1; p < .01), however, this was followed by a gradual return to baseline values (T3: 0.30 ± 0.05 µmol·min−1, and T4: 0.26 ± 0.07 µmol·min−1).
Discussion
In patients with AVNFH, reduced repair capacity and altered bone remodeling play an important role in progression and severity of the disease. Therefore, returning cytokines to homeostatic levels may result in treatment by modulating the interaction of IL-1β, IL-6 and/or TNF-α with OPG/RANK/RANKL.
Abu-Amer and colleagues described two isoforms of TNF-α receptors. Type 1 (p55r) was found to promote osteoclastogenesis, while Type 2 (p75r) was found to suppress osteoclastogenesisCitation20,Citation21. We hypothesize that HBOT leads to reduced levels of TNF-α decreasing binding of TNF-α to the p55r Type 1 receptor, thus decreasing the activation of NF-kBCitation13. Moreover, Kurokouchi and colleagues found TNF-α to increase the expression of IL-6 genesCitation22. As a result, lower levels of TNF-α resulting from HBOT exposure could explain the reduction in IL-6 levels as shown in .
In vivo studies of IL-6 found that in transgenic mice with overexpressed IL-6 there is greater bone turnover, reduced osteoblasts, and increased osteoclasts leading to osteopeniaCitation23. Correspondingly, IL-6 deficient mice displayed reduced osteoclasts and lower levels of bone erosionCitation24. In the inflammatory process, monocytes/macrophages produce IL-6, which can directly stimulate pre-osteoclast cells to differentiate and activateCitation13. IL-6 also stimulates stromal/osteoblastic cells to produce effectors, which will then promote osteoclastic differentiationCitation13.
IL-1β is one of the highly expressed and driving cytokines in inflammation. Although belonging to a structurally different cytokine class, IL-1β resembles many of the biological activity of TNF-α. Increased IL-1β levels result in downstream activation of NF-kB and c-jun N-terminal kinase which has an important role in multinucleation and bone resorptionCitation20,Citation25–28. Although IL-lβ and TNF-α have been reported to show identical effects on osteoblast-mediated osteoclastic bone resorption they have contrasting effects on bone formation through osteoblastic differentiation in bone metabolism.
IL-1β enhances and TNF- α inhibits bone morphogenetic protein (BMP) -2 (osteogenin), or -4 (osteoinductive protein-l) -induced alkaline phosphatase (marker of osteoblastic differentiation) activityCitation29. In the osteolytic process, TNF-α acts principally on osteoclasts precursors while IL-1β increase bone resorption indirectly through the production of RANKL whose plasma levels have been reported to be unaffected by HBOTCitation15,Citation30. However, HBOT does seem to induce upregulation of serum OPG production. This increase may reflect a compensatory response linked to the trend of IL-1β concentration as OPG secretion is induced by IL-1βCitation31.
HBOT enhances healing of necrotic wounds by stimulating angiogenesis, fibroblast proliferation, osteoblast proliferation, and collagen formation. These mechanisms are stimulated by modulation of oxygen sensitive transcription factors as well as ROS-mediated signaling pathways themselvesCitation8. ROS levels increased between start of treatment (T0) and after 15 treatments of hyperbaric oxygen (T1) due to the hyperoxia expositionCitation32. Thereafter this increase in ROS subsided after 30 treatments and was no longer witnessed in the later stages (T2, T3, T4). One possible explanation is that the first HBOT cycle exerts a preconditioning activity by upregulating the endogenous antioxidant and detoxification capacity, enhancing cellular protection against the subsequent oxidative stress damageCitation5–7,Citation20. These protective effects could be attributed to a more effective antioxidant production and activity, which occur during HBOT treatments.
The current study has potential limitations. A larger sample size, with a more homogenous clinical sample and additional pro and anti-inflammatory markers would be helpful to confirm our results. Moreover, information on transcription factors expression and specific target genes involved in cellular response to such treatments could help to better elucidate the detailed aspects of the intricate and complex link between the inflammatory, oxidative stress pathways and HBOT.
Finally, more clinical and basic researches are requested to better understand HBOT’s molecular mechanisms of action to gain evidences for this treatment to improve protocols and achieve greater resolution for patients.
Conclusions
This study shows that HBOT results in an anti-inflammatory action in patients with AVNFH. In AVNFH, HBOT results in a decreased amount of circulating TNF-α and IL-6 (). HBOT acting on IL-1β, TNF-α, and IL-6, key bone-resorbing cytokines and their synergistic effects, could ultimately lead to beneficial resolution for the patient. Moreover the decrease in inflammatory markers mirrored the reductions in visible edema upon radiographic imaging and reductions in patient pain previously observed within the literature. The initial observed increase in ROS production enhances healing of necrotic tissues inducing antioxidant production and detoxification activity too ().
Figure 3. Effect of HBOT on plasma level of ROS production (μmol·min−1) in ANFH patients is shown. T0 before the beginning of the first HBOT cycle of treatments (filled bar), T1: after 15 HBOT, T2: after 30 HBOT, T3: beginning of the second HBOT cycle after a 30 days break, T4: end of the second HBOT cycle (empty bars). Data are presented as mean ± SD. Significance of differences: P < .05 (*), P < .01 (#), P < .0001 (¶).
Disclosure statement
No potential conflict of interest was reported by the authors.
Related Research Data
References
- Aaron R, Gray R. “Osteonecrosis: etiology, natural history, pathophysiology, and diagnosis” In: Allaghan JJ, Rosenberg AG, Rubash H, editors. The adult hip. Philadelphia: Lippincott Williams & Wilkins; 2007:465–476.
- Weinstein RS. Glucocorticoid-induced osteoporosis and osteonecrosis. Endocrinol Metab Clin North Am 2012;41:595–611.
- Camporesi EM, Vezzani G, Bosco G, et al. Hyperbaric oxygen therapy in femoral head necrosis. J Arthroplasty 2010;25:118–23.
- Vezzani G, Camporesi EM, Mangar D, et al. Beneficial effect of hyperbaric oxygenation in avascular necrosis of the femoral head. Gazz. medica Ital Arch per le Sci mediche 2018;177:72–78.
- Camporesi EM, Bosco G. Mechanisms of action of hyperbaric oxygen therapy. Undersea Hyperb Med 2014;41:247–52.
- Bosco G, Yang Z, Nandi J, et al. Effects of hyperbaric oxygen on glucose, lactate, glycerol and anti-oxidant enzymes in the skeletal muscle of rats during ischaemia and reperfusion. Clin Exp Pharmacol Physiol 2007;34:70–6.
- Morabito C, Bosco G, Pilla R, et al. Effect of pre-breathing oxygen at different depth on oxidative status and calcium concentration in lymphocytes of scuba divers. Acta Physiol 2011;202:69–78.
- Thom SR. Oxidative stress is fundamental to hyperbaric oxygen therapy. J Appl Physiol 2009;106:988–95.
- Asano T, Kaneko E, Shinozaki S, et al. Hyperbaric Oxygen Induces Basic Fibroblast Growth Factor and Hepatocyte Growth Factor Expression, and Enhances Blood Perfusion and Muscle Regeneration in Mouse Ischemic Hind Limbs. Circ J 2007;71, 405–11.
- Milovanova TN, Bhopale VM, Sorokina EM, et al. Hyperbaric oxygen stimulates vasculogenic stem cell growth and differentiation in vivo. J Appl Physiol 2009;106:711–28.
- Vezzani G, Iezzi M, Rizzato A, et al. Effects of hyperbaric oxygen exposure on mobilization of endothelial progenitor cells in healthy volunteers. Acta Medica Mediterr 2017;33.
- Mohamad JA, Kwan MK, Merican AM, et al. Early results of metal on metal articulation total hip arthroplasty in young patients. Med J Malaysia 2004;59: Suppl F:3–7.
- Kurokouchi K, Kambe F, Yasukawa K, et al. TNF-alpha increases expression of IL-6 and ICAM-1 genes through activation of NF-kappaB in osteoblast-like ROS17/2.8 cells. J Bone Miner Res 1998;13:1290–9.
- Ficat RP. Idiopathic bone necrosis of the femoral head. Early diagnosis and treatment. J Bone Joint Surg Br 1985;67:3–9.
- Vezzani G, Quartesan S, Cancellara P, et al. Hyperbaric oxygen therapy modulates serum OPG/RANKL in femoral head necrosis patients. J Enzyme Inhib Med Chem 2017;32:707–11.
- Mrakic-Sposta S, Gussoni M, Montorsi M, et al. A quantitative method to monitor reactive oxygen species production by electron paramagnetic resonance in physiological and pathological conditions. Oxid Med Cell Longev 2014;2014:306179.
- Mrakic-Sposta S, Vezzoli A, Malacrida S, et al. Methods to detect oxidative stress during acute or chronic high-altitude exposure. High Alt Med Biol 2014;18:303–4.
- Di Iorio A, Ferrucci L, Sparvieri E, et al. Serum IL-1beta levels in health and disease: a population-based study. ‘The InCHIANTI study]’. Cytokine 2003;22:198–205.
- Fernandez-Real JM, Vayreda M, Richart C, et al. Circulating interleukin 6 levels, blood pressure, and insulin sensitivity in apparently healthy men and women. J Clin Endocrinol Metab 2001;86:1154–9.
- Steeve KT, Marc P, Sandrine T, et al. IL-6, RANKL, TNF-alpha/IL-1: interrelations in bone resorption pathophysiology. Cytokine Growth Factor Rev 2004;15:49–60.
- Abu-Amer Y, Erdmann J, Alexopoulou L, et al. Tumor necrosis factor receptors types 1 and 2 differentially regulate osteoclastogenesis. J Bill Chem 2000;275:27307–10.
- Ohshima S, Saeki Y, Mima T, et al. Interleukin 6 plays a key role in the development of antigen-induced arthritis. Proc Natl Acad Sci 1998;95:8222.
- De Benedetti F, Rucci N, Del Fattore A, et al. Impaired skeletal development in interleukin-6–transgenic mice: a model for the impact of chronic inflammation on the growing skeletal system. Arthritis Rheum 2006;54:3551–63.
- Greenfeder SA, Nunes P, Kwee L, et al. Molecular cloning and characterization of a second subunit of the interleukin 1 receptor complex. J Biol Chem 1995;270:13757–65.
- Baud V, Liu ZG, Bennett B, et al. Signaling by proinflammatory cytokines: oligomerization of TRAF2 and TRAF6 is sufficient for JNK and IKK activation and target gene induction via an amino-terminal effector domain. Genes Dev 1999;13:1297–308.
- Jimi E, Nakamura I, Duong LT, et al. Interleukin 1 induces multinucleation and bone-resorbing activity of osteoclasts in the absence of osteoblasts/stromal cells. Exp Cell Res 1999;247:84–93.
- Polzer K, Joosten L, Gasser J, et al. Interleukin-1 is essential for systemic inflammatory bone loss. Ann Rheum 2010;69:284–90.
- Panagakos FS, Jandinski JJ, Feder L, Kumar S. Effects of plasminogen and interleukin-1β on bone resorption in vitro. Biochimie 1994;76:394–7.
- Nakase T, Takaoka K, Masuhara K, et al. Interleukin-1 beta enhances and tumor necrosis factor-alpha inhibits bone morphogenetic protein-2-induced alkaline phosphatase activity in MC3T3-E1 osteoblastic cells. Bone 1997;21:17–21.
- Obando-Pereda GA, Fischer L, Stach-Machado DR. Titanium and zirconia particle-induced pro-inflammatory gene expression in cultured macrophages and osteolysis, inflammatory hyperalgesia and edema in vivo. Life Sci 2014;97:96–106.
- Tipton DA, Seshul BA, Dabbous MK. Effect of bisphosphonates on human gingival fibroblast production of mediators of osteoclastogenesis: RANKL, osteoprotegerin and interleukin-6. J Periodontal Res 2011;46:39–47.
- Camporesi EM, Bosco G. Hyperbaric oxygen pretreatment and preconditioning. Undersea Hyperb Med 2014;41:259–63.