
 ?Mathematical formulae have been encoded as MathML and are displayed in this HTML version using MathJax in order to improve their display. Uncheck the box to turn MathJax off. This feature requires Javascript. Click on a formula to zoom.
Abstract
Sphingosine kinase 1 (SphK1) is a promising therapeutic target against several diseases including mammary cancer. The aim of present work is to identify a potent lead compound against breast cancer using ligand-based virtual screening, molecular docking, MD simulations, and the MMPBSA calculations. The LBVS in molecular and virtual libraries yielded 20,800 hits, which were reduced to 621 by several parameters of drug-likeness, lead-likeness, and PAINS. Furthermore, 55 compounds were selected by ADMET descriptors carried forward for molecular interaction studies with SphK1. The binding energy (ΔG) of three screened compounds namely ZINC06823429 (–11.36 kcal/mol), ZINC95421501 (–11.29 kcal/mol), and ZINC95421070 (–11.26 kcal/mol) exhibited stronger than standard drug PF-543 (–9.9 kcal/mol). Finally, it was observed that the ZINC06823429 binds tightly to catalytic site of SphK1 and remain stable during MD simulations. This study provides a significant understanding of SphK1 inhibitors that can be used in the development of potential therapeutics against breast cancer.
1. Introduction
Breast cancer is the most commonly diagnosed cancer among women worldwide. A majority of patients diagnosed with breast cancer go on to develop symptoms of post-traumatic stress disorder, and in most of these cases the symptoms persist for at least a yearCitation1. Pain, fatigue, arm morbidity, and postmenopausal symptoms were among the most common symptoms are reported by breast cancer patientsCitation2. The recognition and treatment of these symptoms are main issues since these symptoms impair health-related quality of life. It can strike at any age, but it is commonly diagnosed in middle-aged womenCitation3. According to International Agency for Research on Cancer (IARC) of World Health Organization (WHO), there were 2.09 million cases of breast cancer reported globally, out of which 627,000 deaths have been occurred in 2018. The estimated numbers of new cases of breast cancer in 2018 in the USA were 268,670 with total 41,400 deathsCitation4. The breast cancer mortality rates have been declined in the past few years owing to early diagnosis and advancement in treatmentsCitation5.
The present medication such as endocrine therapy for the different subtypes of breast cancer is utilised for the treatment and prevention of oestrogen-receptor-positive (ER+) breast carcinomaCitation6. The ER + and human epidermal growth factor receptor 2 (HER-2) sub types breast cancer are treated by tamoxifen and monoclonal antibody, respectivelyCitation7–10. Endocrine therapy is the most effective and least toxic treatment for breast cancer, but it poses challenges. The major challenges are late recurrence, drug resistance, painful injection, and lack of complianceCitation11. The increase in the utilisation of endocrine agents has brought about the improvement of procedures to prevent and eradicate mammary cancer. About 30% of both ER + and progesterone-receptor-positive (PR+) tumours are not susceptible to endocrine treatmentCitation12. There are limitations in predicting the efficacy of endocrine treatment for hormone receptor expression alone. Therefore, the combination therapies are utmost needed to reduce the chemo-resistance.
It has been reported that sphingosine-1-phosphate (S1P), a sphingolipid bioactive molecule that mediates various biological processes plays a key role in breast carcinomaCitation13. The process starts when S1P is produced intracellularly by two sphingosine kinases such as sphingosine kinase 1 (SphK1) and SphK2 with autocrine and paracrine action called “inside out signaling”Citation14,Citation15. The action of SphK1 is mediated by few developmental factors such as oestradiol (E2), epidermal growth factor (EGF), vitamins and cytokines IL1, and IL6Citation14,Citation16. The active transport of S1P from the cell takes place with the help of oestradiol (E2) via ATP binding cassette transporter A1 (ABC A1), ATP binding cassette transporter C1 (ABC C1), and ATP binding cassette transporter G2 (ABC G2)Citation17. The S1P regulates various biological processes such as cell development, anti-apoptosis, intrusion, angiogenesis, and expansion after attaching to five selective G protein-coupled receptor (GPCRs) located on the plasma membrane (S1P1-5). This in turn stimulates ERK1/2 prompting downstream signalling that is a crucial step for metastasis of breast cancerCitation14. Apart from regulating ERK1/2 pathway, it also mediates PI3K/AKT signalling pathwayCitation18.
It has been well documented that high expression of SphK1 is associated with different subsets of breast carcinoma such as ER+, HER 2, and TNBC, thereby resulting the worse prognosis and resistance to available antitumour therapiesCitation19,Citation20. Various inhibitors of SphK1 such as PF-543, SK1-5c, Belanocarpol, RB-005, and VPC96091 have been designed so far, but to identify the finest one having plausible bioavailability, pharmacokinetic, and pharmacodynamic properties is yet to be developedCitation16,Citation21–23.
The main objective of present work is to identify a potent lead compound against breast cancer using several computational approaches such as the ligand-based virtual screening (LBVS)Citation24–26, molecular dockingCitation27–29, molecular dynamics (MD) simulationsCitation30–33, and the molecular mechanics (MM) Poisson–Boltzmann surface area (MMPBSA) calculationsCitation34. The molecular interaction studies of predicted lead molecules with target protein SphK1 were also carried out in order to check the strength of drug binding. The results were further compared with known inhibitor PF-543Citation35, and the best drug was identified. This study may provide valuable insight leading to improved treatment of patients with breast cancer.
2. Methodology
2.1. SphK1 protein preparations
The 3D structure of SphK1 in complex with PF-543 (4V24) was obtained from RCSB Protein Data Bank (http://www.rcsb.org)Citation36. The coordinates of heteroatoms were removed to prepare the protein for molecular docking. The energy of SphK1 was minimised by applying the CHARMm force field. The active site of SphK1 was located for ligand binding where the inhibitor PF-543 was co-crystallisedCitation36.
2.2. Ligand based virtual screening
SwissSimilarityCitation37, a novel web-based tool that offers ultra-high-throughput virtual screening from various repositories of chemical compounds such as DrugBankCitation38, Ligand ExpoCitation39, ChEMBLCitation40, ChEBICitation41, GLASSCitation42, the Human Metabolome Database (HMDB)Citation43, and ZINC databasesCitation44 was used to perform LBVS. The predictions were based on five different 2D and 3D search techniques, namely molecular fingerprints (FPs), electroshape, spectrophores, shape IT, and align IT. The screening by these approaches are based on similarity score such as 1 for similar and 0 for dissimilar compounds.
2.3. Drug likeness, lead likeness, and PAINS
Different filters were applied to predict hits based on Lipinski’s RO5Citation45,Citation46, VeberCitation47, GhoseCitation48, EganCitation49, MueggeCitation50, lead likeness, and pan-assay interference compounds analysis (PAINS)Citation51. In RO5, the attributes commonly found in orally active drug molecules of molecular weight (≤500 Da), hydrogen bond acceptor (≤10), hydrogen bond donor (5≤), and log P (≤5). Veber et al. improved the RO5 with the addition of two more properties including the number of rotatable bonds (≤10) and PSA (≤140 Å2).
Moreover, the RO5 fails to explain the basic highlights found in drugs or non-drugs. Therefore, Ghose et al. expanded this work in view of processed physicochemical properties. They set up the accompanying criteria such as A log P (–0.4 to 5.6), molar refractivity (40–130), molecular weight (160–480), and the number of atoms (20–70). Further, Muegge et al. assigned a score due to the presence of structural fragments on a molecule that are typically found in drugs. The molecules with a score ranging from 2 to 7 were classified as drugs. Two main criteria namely SLogP (≤6) and TPSA (≤132 Å2) were further included in Egan filtration. All the drug likeness, lead likeness, and pan assay interference studies of ligands and standard molecule were carried out using SwissADME toolCitation52.
2.4. ADME and toxicity prediction
Absorption, distribution, metabolism, and excretion (ADME) and toxicity assessment are very important part of leads selection. The ADME and toxicity parameters of all compounds obtained after filtration on various parameters of drug likeness properties were checked using TOxicity Prediction by Komputer Assisted Technology (TOPKAT) module of Discovery studio 2.5. This tool predicts the toxicity using weight of the evidence parameter of carcinogenicity as per the Food and Drug Administration (FDA) and National Toxicology Program (NTP) animal model guidelines.
2.5. Molecular docking studies
AutoDock 4.2Citation53 molecular docking software was used to identify the most probable binding pose and molecular interactions of inhibitors into the active pocket of SphK1. In this trend, we addressed protein preparation, chain selection, and non-protein parts deletion with Discovery Studio Visualizer 2.5. For SphK1, a grid was set up with 60 × 60 × 60 points, and docking was performed by using default parameters. The ligands were docked into the active pocket of SphK1 where the inhibitor PF-543 was presentCitation36. The proper orientations of docked molecules in SphK1 were selected. The compounds having least ΔG values were treated as strong binding affinity with the target protein.
2.6. Molecular dynamics simulation
MD simulations were performed on SphK1, SphK1–PF-543, SphK1–ZINC06823429, SphK1–ZINC95421070, and SphK1–ZINC95421501 at 300 K at the MM level executed by GROMACS 5.1.2Citation54 utilising the GROMOS96 43a1 force-field. The ligands were extracted from the docked complexes utilising gmx grep module. The topology and force-field parameter files of the ligands were obtained by PRODRG serverCitation55. The charges in the topology file were manually corrected. The topologies were generated for SphK1 utilising pdb2gmx modules of gromacs and PF-543, ZINC06823429, ZINC95421070, and ZINC95421501 using PRODRG server were merged together.
The extra ligand atoms were combined in the complex topologies with default parameters. The SphK1, SphK1–PF-543, SphK1–ZINC06823429, SphK1–ZINC95421070, and SphK1–ZINC95421501 were soaked in a cubic box of water molecules with a dimension of 10 Å, i.e. setting the edge 10 Å from the molecule periphery utilising the gmx editconf module for creating boundary conditions and gmx solvate module for solvation. The Simple Point Charge (spc216) water model was used to solvate the system. The charges on the SphK1, SphK1–PF-543, SphK1–ZINC06823429, SphK1–ZINC95421070, and SphK1–ZINC95421501 complexes were neutralised by addition of Na+ and Cl– ions using gmx genion module to maintain neutrality, preserving a physiological concentration of 0.15 M. Further, energy groups were used to examine the interaction of SphK1 with PF-543, ZINC06823429, ZINC95421070, and ZINC95421501. The system was then minimised using 1500 steps of steepest descent. Finally, system temperatures were raised from 0 to 300 K during their equilibration period (100 ps) at a constant volume under periodic boundary conditions.
The systems were equilibrated using NVT ensemble (constant number of particles, volume, and temperature at 100 ps) and NPT ensemble (constant number of particles, pressure, and temperature at 100 ps). In both cases, the Cα backbone atoms of the original crystal structure were limited with all other atoms permitted to move freely. After the equilibration phase, the particle-mesh was applied following Ewald method. The resulting path was analysed utilising gmx energy, gmx rms, gmx confirms, gmx rmsf, gmx gyrate, make_ndx, gmx hbond, gmx do_dssp, gmx covar, gmx anaeig, gmx sham, and gmx sasa utilities of GROMACS. The plots of the 3D models were readied utilising PyMol and VMD (Visual Molecular Dynamics)Citation56. The details of MD simulation method were previously describedCitation57–61.
2.7. MMPBSA calculation
Molecular mechanics Poisson–Boltzmann surface area, a strategy to appraise interaction free energies was used to study bimolecular interactions. The binding energy was calculated utilising MMPBSA protocols implemented in the g_mmpbsa packageCitation62. A protein–ligand snapshot of MD trajectories between 40 and 50 ns was extracted from the stable region of every complex. The aim was to incorporate high throughput MD simulations with their binding energy calculations. The binding energies were figured utilising following equation:
(1)
(1)
where GComplex, GProtein, and GLigand signify the total free energy of the binding complex, total free energies of the individual protein, and total free energies of the individual ligand, respectively. Besides, the free energy for each individual entity can be given by:
(2)
(2)
where “x” is the protein or ligand or protein–ligand complex. EMM is the average MM potential energy in a vacuum. Temperature (T) and entropy (S) jointly denote the entropic contribution to the free energy in a vacuum and the Gsolvation is the free energy of solvation. The vacuum potential energy (EMM) is the sum of bonded as well as non-bonded interactions, and it is calculated based on the MM force-field parameters.
(3)
(3)
where Ebonded is bonded interactions consisting of bond, angle, dihedral, and improper interactions. The non-bonded interactions (Enon-bonded) include both electrostatic (Eelec) and van der Waals (EvdW) interactions and are modelled using a Coulomb and Lennard-Jones (LJ) potential function, respectively. The free energy of solvation is well defined by the energy required to transfer a solute from vacuum into the solvent. In the MMPBSA method, it is calculated using an implicit solvent model. The solvation free energy (Gsolvation) is defined as:
(4)
(4)
where Gpolar and Gnon-polar are the electrostatic and non-electrostatic contributions to the solvation free energy, respectively.
3. Results
3.1. Ligand-based virtual screening
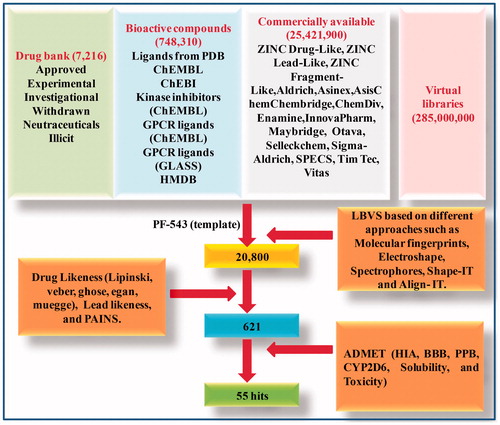
LBVS approach was employed to filter compounds so as to build the SphK1 inhibitor library. The PF-543, a potent inhibitor of SphK1 was used as input molecule to extract small molecules similar to SphK1 inhibitor from the constructed libraries using virtual screening strategies. LBVS identified 20,800 hits from various molecular and virtual libraries including DrugBank, Ligand Expo, ChEMBL, ChEBI, GLASS, HMDB, and ZINC databases as shown in .
Figure 1. The flowchart showing the ligand-based virtual screening of compounds.
3.2. Drug likeness, lead likeness, and PAINS study
All 20,800 compounds and PF-543 were subjected to drug likeness, lead likeness, and PAINS analyses. We have identified 621 hits that obeyed all the parameters of drug likeness, lead likeness, and PAINS analyses (), but the drug PF-543 failed at two parameters, namely ghose filtration and lead likeness. The result of top 10 compounds and PF-543 fulfilling the drug likeness features is shown in .
Table 1. Analysis of drug like properties of top 10 compounds and PF-543 on the basis of Lipinski’s RO5.
3.3. ADMET screening
The selected compounds were subjected to ADMET screening which includes in silico prediction of human intestinal absorption (HIA), and blood brain barrier (BBB) parameters of pharmacokinetics. Out of 621 compounds, only 492 followed the HIA and BBB criteria. The compounds which show HIA levels 0, 1, 2, and 3 reflect excellent, mild, low, and very low absorption, respectively. The BBB reflects penetration level to be very large (0), large (1), normal (2), poor (3), and limitless (4). Further, it was checked for plasma protein binding (PPB) properties of ADMET. Subsequently, 230 compounds succeeded after checking on parameter of dissolvability. Only 55 molecules were successfully depicted as non-carcinogenic. Overall process of virtual screening is summarised in .
Moreover, aforementioned compounds are tested for CYP2D6 metabolism in which 232 compounds were observed to be nonsuppressor of Cytochrome P4502D6 showing the Bayesian score of less than 0.162. After ADMET analysis, it was observed that all the 55 compounds were following all the parameters of ADMET. This information unravelled that these compounds have excellent absorption level. Additionally, 10 compounds have high penetration level and the remaining 45 compounds have medium penetration level. It was also discovered that all the 55 compounds were not bound to plasma proteins indicating good bioavailability. Each of the 55 compounds were observed to be noninhibitors of CYP2D6 suggesting that these can be utilised in the liver. In the event of solubility level, all 55 compounds were following great dissolvability levels 3 and 2. With regard to toxicity, all selected compounds were found to be non-carcinogenic and non-mutagenic. Furthermore, ADMET analysis of PF-543 was found comparable to the predicted compounds. ADMET analyses of top 10 compounds along with standard molecule PF-543 are shown in .
Table 2. ADMET calculation of top 10 compounds and PF-543.
3.4. Molecular docking analysis
In order to check the binding interaction of 55 ligands with SphK1, molecular docking studies was carried out using AutoDock tools. The illustrated data uncovered that ΔG values of three compounds, namely ZINC06823429, ZINC95421501, and ZINC95421070 were observed to be higher than the standard drug PF-543. Moreover, ZINC06823429 was found to have greater binding energy (–11.36 kcal/mol) as compared with other drugs including PF-543 (–9.90 kcal/mol). Therefore, it is of great importance that the predicted compound namely ZINC06823429 might be used as potent inhibitor of SphK1. The docking results of top 10 compounds and standard PF-543 is summarised in .
Table 3. Docking analysis of top 10 compounds and comparison with known drug.
3.4.1. Interaction with active site residues
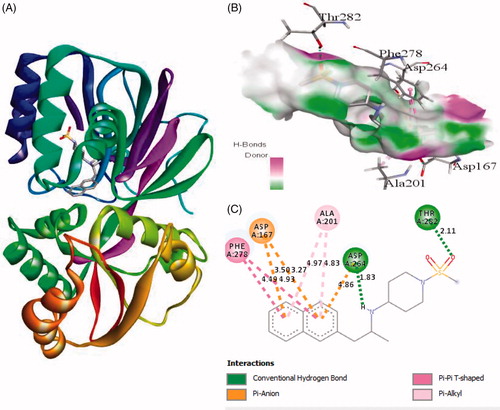
Interaction of active site residues with the three best inhibitors of SphK1 namely ZINC06823429, ZINC95421501, and ZINC95421070 was analysed and compared with standard drug PF-543. The inhibitor ZINC06823429 interacts with Phe259, Ile260, Val263, Leu354, Asp264, Gly428, Asp427, and Glu429 with distance of 4.29 Å, 4.75/3.90 Å, 4.81 Å, 5.26/1.86 Å, 2.21/2.05 Å, 2.69 Å, 1.93 Å, and 2.94 Å, respectively. It includes four conventional hydrogen bonds and several other interactions (). In case of inhibitor ZINC95421501, the interacting residues were Phe278, Asp167, Ala201, Asp264, and Thr282 with distance of 4.49/4.93 Å, 3.50/3.27 Å, 4.97/4.84 Å, 4.86/1.83 Å, and 2.11 Å, respectively (). It involved two conventional hydrogen bonds and several other interactions.
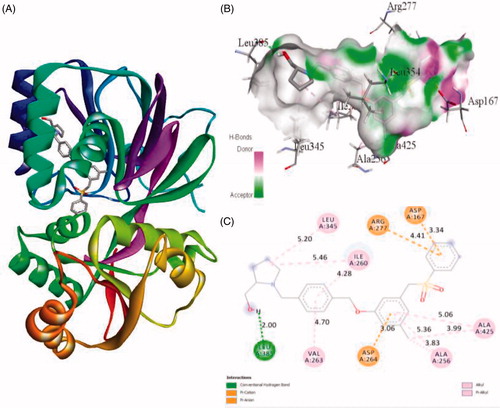
Figure 2. The binding mode of ZINC06823429 with the SphK1. (A) The overall structure of SphK1–ZINC06823429 complex showing protein in cartoon model and ligand in stick. (B) Interaction of ZINC06823429 to the SphK1 residues (stick). (C) 2D diagram of SphK1 interaction with the compound ZINC06823429. The active site residues of SphK1 interacting with ligand ZINC06823429 by four conventional H-bonds.
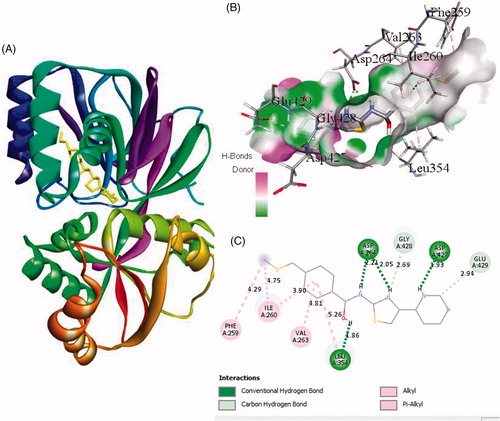
Figure 3. The binding mode of ZINC95421501 with the SphK1. (A) The overall structure of SphK1–ZINC95421501 complex showing protein in cartoon model and ligand in stick. (B) Interaction of ZINC95421501 to the SphK1 residues (stick). (C) 2D diagram of SphK1 interaction with the compound ZINC95421501. The active site residues of SphK1 interacting with ligand ZINC95421501 by two conventional H-bonds.
Similarly, the inhibitor ZINC95421070 binds with the residues Ala201, Phe278, Arg277, Asn200, Asp167, Met358, Gly166, Ile260, Val263, and Asp264 with distance of 5.18 Å, 5.88 Å, 6.00 Å, 2.53 Å, 3.36/1.95 Å, 5.70 Å, 3.45 Å, 2.77 Å, 4.38 Å, and 1.93 Å, respectively (). The inhibitor ZINC95421070 interacts with SphK1 by three conventional hydrogen bonds interactions and several other interactions. Finally, the standard drug PF-543 interacts with SphK1 with the residues Leu345, Ile260, Arg277, Asp167, Ala425, Ala256, Asp264, Val263, and Leu385 with distance of 5.20, 5.46/4.28, 4.41, 3.34, 5.06/3.99, 5.36/3.83, 3.06, 4.70, and 2.00, respectively (). It involved only one hydrogen bond interaction. Most of the interacting residues are similar in all the docked complexes.
Figure 4. The binding mode of ZINC95421070 with the SphK1. (A) The overall structure of SphK1–ZINC95421070 complex showing protein in cartoon model and ligand in stick. (B) Interaction of ZINC95421070 to the SphK1 residues (stick). (C) 2D diagram of SphK1 interaction with the compound ZINC95421070. The active site residues of SphK1 interacting with ligand ZINC95421070 by three conventional H-bonds.
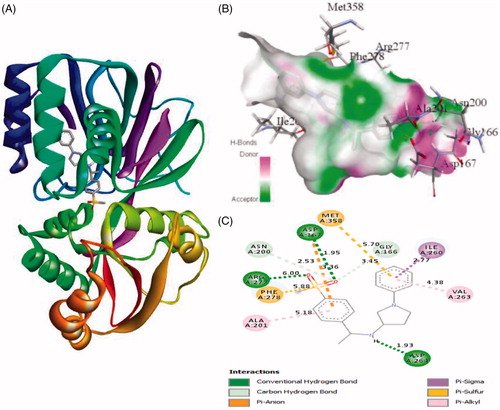
Figure 5. The binding mode of PF-543 with the SphK1. (A) The overall structure of SphK1–PF-543 complex showing protein in cartoon model and ligand in stick. (B) Interaction of PF-543 to the SphK1 residues (stick). (C) 2D diagram of SphK1 interaction with the compound PF-543. The active site residues of SphK1 interacting with ligand PF-543 by one conventional H-bonds.
3.5. Molecular dynamics simulation
3.5.1. Average potential energy of system
The average potential energy of SphK1, SphK1–PF-543, SphK1–ZINC06823429, SphK1–ZINC95421070, and SphK1–ZINC95421501 was checked prior to MD simulations to determine the stability of the systems. The constant fluctuations of temperature at 300 K for every system recommended a stable and accurate nature of MD simulations performed. An average potential energy for aforesaid system was observed to be –767,455 kJ/mol, 766,868 kJ/mol, 766,795 kJ/mol, 767,127 kJ/mol, and 766,972 kJ/mol, respectively. The potential energy for all the system was observed to be equivalent during the entire 100 ns MD process. The average potential energy of all the selected complexes is shown in .
Table 4. Calculated parameters for all the systems obtained after 100 ns MD simulations.
3.5.2. Structural deviations and compactness
Protein conformational changes are due to the binding of ligand in the active site of the proteinCitation33. Root mean square deviation (RMSD) is one of the vital parameter to determine whether the protein is stable and close to the experimental structureCitation63. The average RMSD values were observed to be 0.29 nm, 0.44 nm, 0.34 nm, 0.25 nm, and 0.27 nm for SphK1, SphK1–PF-543, SphK1–ZINC06823429, SphK1–ZINC95421070, and SphK1–ZINC95421501, respectively (). The RMSD plot suggested that the binding of PF-543 to the SphK1 leads to high structural deviations from 0.29 nm to 0.44 nm. Likewise, the structural deviations from 0.29 nm to 0.34 nm were also reported in case of SphK1–ZINC06823429 (. Accordingly, the binding of ligands such as ZINC95421070 and ZINC95421501 leads to decrease in the RMSD values of SphK1. The RMSD plot suggested that inhibition of SphK1 leads to large structural deviations, and ligands PF-543 and ZINC06823429 were reported to have maximum inhibition of the SphK1. The orientations of PF-543, ZINC06823429, ZINC95421070, and ZINC95421501 were also analysed in the internal cavity of the SphK1 (. The PF-543 indicated maximum RMSD value but found to be equilibrated in the active pocket of SphK1. The ligand ZINC06823429 showed constant fluctuations throughout the MD simulations. The ligand ZINC95421070 and ZINC95421501 showed random fluctuations initially, but equilibrated after 60 ns. The RMSF of the protein upon ligand binding was plotted as function of residue number to determine the mean fluctuations of all residues during the simulation (. The graphical representation of RMSF demonstrated that the fluctuations in residues are present in SphK1 at distinct regions due to binding of these ligands. The binding of PF-543 leads to decrease in residual fluctuation at 270–280 aa, 300–350 aa, and 370–400 aa regions. The binding of ZINC06823429 leads to slightly increase in residual fluctuations throughout the 100 ns MD simulations. Accordingly, the binding of ZINC95421070 and ZINC95421501 decreases the residual fluctuations of SphK1. These all selected ligands showed different impact on SphK1.
Figure 6. Dynamics of ligands binding to the SphK1. (A) RMSD plot as a function of time. Black, red, green, blue, and yellow colours represent values obtained for SphK1, SphK1–STD, SphK1–ZINC06823429, SphK1–ZINC95421070, and SphK1–ZINC95421501, respectively. (B) Comparison of orientations of PF-543 (red), ZINC06823429 (green), ZINC95421070 (blue), and ZINC95421501 (yellow) into the active pocket of SphK1. (C) Backbone atomic fluctuations (RMSF) plot for SphK1, SphK1–PF-543, SphK1–ZINC06823429, SphK1–ZINC95421070, and SphK1–ZINC95421501. (D) Time evolution of radius of gyration (Rg) values during 100,000 ps (100 ns) of MD simulation. The Rg plot for SphK1 is shown in black. Red, green, blue, and yellow colours represent Rg plot for SphK1–PF-543, SphK1–ZINC06823429, SphK1–ZINC95421070, and SphK1–ZINC95421501, respectively.
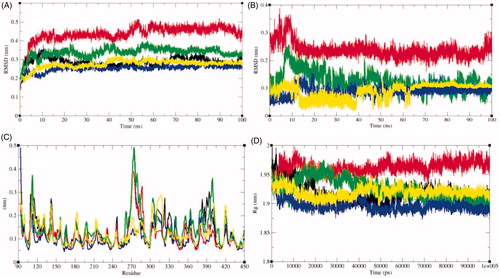
Radius of gyration (Rg) determines the stability of protein in a biological system and is connected to compactness of the protein. Due to less compact packing, the radius of gyration is supposed to be higher. The average Rg values for SphK1, SphK1–PF-543, SphK1–ZINC06823429, SphK1–ZINC95421070, and SphK1–ZINC95421501 were observed to be 1.92 nm, 1.96 nm, 1.93 nm, 1.90 nm, and 1.92 nm, respectively (). The average Rg values of SphK1 and SphK1–ZINC95421501 were found to be equal. The binding of PF-543 shows high values of Rg of SphK1. The binding of ZINC06823429 initially showed the high Rg values and thereafter a sudden decrease in Rg values was reported after 50 ns. The lowest Rg values were reported in case of SphK1–ZINC95421070 ().
3.5.3. Solvent accessible surface area
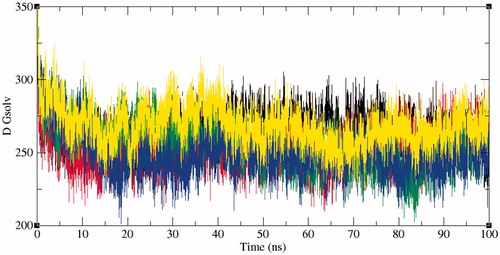
The solvent accessible surface area (SASA) is characterised by the region of a protein that is accessible to solvent molecules. The average SASA values for SphK1, SphK1–PF-543, SphK1–ZINC06823429, SphK1–ZINC95421070, and SphK1–ZINC95421501 were also observed during the 100 ns MD simulations. The average SASA values for SphK1, SphK1–PF-543, SphK1–ZINC06823429, SphK1–ZINC95421070, and SphK1–ZINC95421501 were found to be 171.74 nm2, 171.96 nm2, 168.93 nm2, 170.01 nm2, and 171.82 nm2, respectively (). The average SASA values were comparable for all the systems except a slight decrease in SASA found in case of SphK1–ZINC06823429 and SphK1–ZINC95421070. No significant changes in SASA values were reported upon binding of PF-543 and ZINC95421501 in the active pocket of SphK1 (). It can be inferred that the internal residues in the SphK1 are not accessible to solvent because of binding of PF-543 and ZINC95421501. The free energy of solvation of SphK1, SphK1–PF-543, SphK1–ZINC06823429, SphK1–ZINC95421070, and SphK1–ZINC95421501 was also calculated during SASA calculations. The average free energy of solvation of SphK1, SphK1–PF-543, SphK1–ZINC06823429, SphK1–ZINC95421070, and SphK1–ZINC95421501 was found to be 264.63 kJ/mol/nm2, 252.64 kJ/mol/nm2, 255.25 kJ/mol/nm2, 249.01 kJ/mol/nm2, and 268.47 kJ/mol/nm2, respectively (, ).
Figure 7. Solvent accessible surface area. (A) The solvent accessible surface area (SASA) as a function of time. Black, red, green, blue, and yellow colours represent values obtained for SphK1, SphK1–STD, SphK1–ZINC06823429, SphK1–ZINC95421070, and SphK1–ZINC95421501, respectively. The SASA plot was further resolved into hydrophobic and hydrophilic surface area for (B) SphK1, (C) SphK1–PF-543, (D) SphK1–ZINC06823429, (E) SphK1–ZINC95421070, and (F) SphK1–ZINC95421501, respectively.
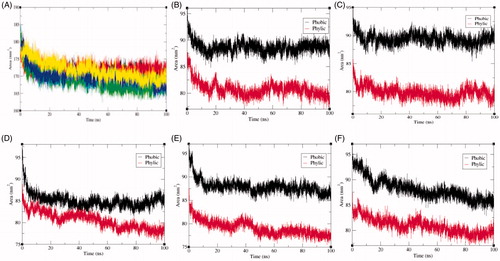
Figure 8. Free energy of solvation during SASA analysis. Free energy of solvation during SASA analysis was calculated for SphK1, SphK1–PF-543, SphK1–ZINC06823429, SphK1–ZINC95421070, and SphK1–ZINC95421501, respectively. Black, red, green, blue, and yellow colours represent the values obtained for SphK1, SphK1–PF-543, SphK1–ZINC06823429, SphK1–ZINC95421070, and SphK1–ZINC95421501, respectively.
3.5.4. Hydrogen bonds analysis
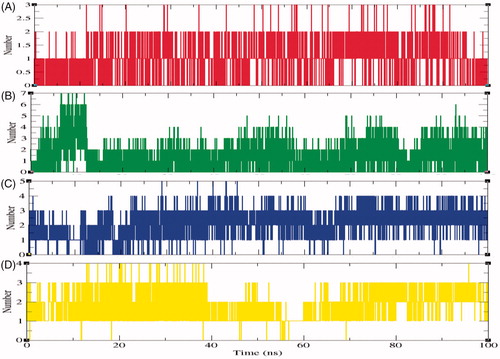
The specificity of protein and ligand interaction is governed by hydrogen bonding which is a part of molecular recognitionCitation64. To validate the stability of docked complexes, the hydrogen bonds paired with 0.35 nm amongst protein and ligands in SphK1–PF-543, SphK1–ZINC06823429, SphK1–ZINC95421070, and SphK1–ZINC95421501 were computed during the 100 ns MD simulations. It has been found that ligands such as PF-543, ZINC06823429, ZINC95421070, and ZINC95421501 form maximum 2–3, 6–7, 4–5, and 3–4 hydrogen bonds with active site residues of SphK1, respectively (). The ligand ZINC95421501 was found to have week interactions during 55–60 ns time scale.
Figure 9. The average number of hydrogen bonds as a function of time. Red, green, blue, and yellow colours represent the number of hydrogen bonds for SphK1–PF-543, SphK1–ZINC06823429, SphK1–ZINC95421070, and SphK1–ZINC95421501, respectively.
3.5.5. Secondary structure changes upon ligand binding
The secondary structure components such as α-helix, β-sheet, and loops were categorised and treated as individual components for each time step. The average number of residues took part in secondary structure formation were decreased in all cases (). The binding of ligand ZINC06823429 to the SphK1 affects much than other ligands. It may be due to proper inhibition of SphK1 or unfolding in α-helical regions. The β-sheets were not affected much in case of SphK1–PF-543 and SphK1–ZINC06823429 (). The structures of SphK1, SphK1–PF-543, SphK1–ZINC06823429, SphK1–ZINC95421070, and SphK1–ZINC95421501 were also extracted during the 100 ns MD simulations to check the position of ligands (). The docked ligands occupied the internal pocket of SphK1 during the 100 ns time scale.
Figure 10. The secondary structure plot. The graphical representation indicating the structural elements present during 100 ns MD simulations in (A) SphK1, (B) SphK1–PF-543, (C) SphK1–ZINC06823429, (D) SphK1–ZINC95421070, and (E) SphK1–ZINC95421501, respectively.
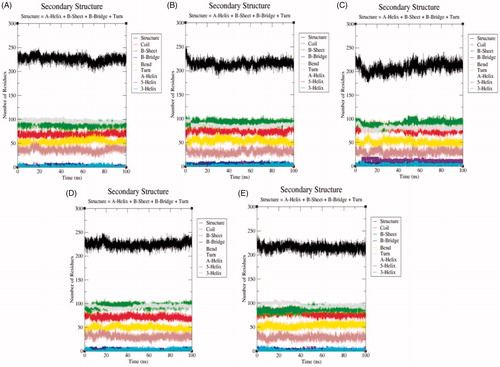
Figure 11. Position of ligands in the secondary structure framework. The secondary structure representation of SphK1 during 100 ns MD simulation in (A) SphK1, (B) SphK1–PF-543, (C) SphK1–ZINC06823429, (D) SphK1–ZINC95421070, and (E) SphK1–ZINC95421501, respectively.
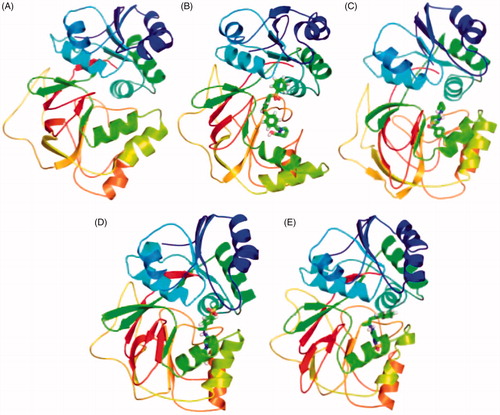
Table 5. Percentage of residues participated in average structure formation.
3.5.6. Principal component analysis
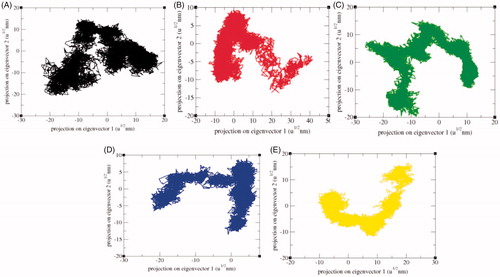
The principal component analysis (PCA) reflects the total expansion of a protein during MD simulationCitation65. The PCA for SphK1, SphK1–PF-543, SphK1–ZINC06823429, SphK1–ZINC95421070, and SphK1–ZINC95421501 was calculated. In this method, the dynamics of SphK1, SphK1–PF-543, SphK1–ZINC06823429, SphK1–ZINC95421070, and SphK1–ZINC95421501 were ascertained utilising gmxcovar module with reference to the backbone. PCA determines the average mobility of a protein thus revealing the internal structures responsible for atomic fluctuationsCitation66. The sum of eigenvalues signifies the total mobility in the system. It can be utilised to determine the flexibility of a protein under distinct conditionsCitation67. The trace of the covariance matrix and eigenvalues was found to be 313.94 nm2, 239.59 nm2, 341.45 nm2, 172.60 nm2, and 228.71 nm2 for SphK1, SphK1–PF-543, SphK1–ZINC06823429, SphK1–ZINC95421070, and SphK1–ZINC95421501, respectively. The eigenvalues were found to be increased in case of SphK1–ZINC06823429 clearly demonstrating that the irregular fluctuations in SphK1 increase due to binding of ZINC06823429. Greater eigenvalues reveal greater expansion of SphK1, i.e. low compactness and possibly denaturation. The detailed projections of eigenvectors are depicted in . The gmx anaeig module reads a set of eigenvectors and eigenvalues as input and returns to project an MD trajectory along a selected eigenvector values. The atomic fluctuations during eigenvector calculation were also reported. It indicated the random fluctuations in the atoms of SphK1 upon binding of different ligands. The 2D projection of eigenvectors indicated diverse protrusions of SphK1 upon binding with different ligands molecules (). The outcomes suggested that the distinct positions of atoms are due to conformational changes in the SphK1.
Figure 12. Principal component analysis (PCA). The PCA or essential dynamics (ED) calculated for SphK1, SphK1–PF-543, SphK1–ZINC06823429, SphK1–ZINC95421070, and SphK1–ZINC95421501, respectively. (A) The graph indicated the projection of eigenvectors in SphK1 (black), SphK1–PF-543 (red), SphK1–ZINC06823429 (green), SphK1–ZINC95421070 (blue), and SphK1–ZINC95421501 (yellow), respectively. (B) The Eigen root mean square fluctuations indicating the atomic fluctuations were also calculated for SphK1 (black), SphK1–PF-543 (red), SphK1–ZINC06823429 (green), SphK1–ZINC95421070 (blue), and SphK1–ZINC95421501 (yellow), respectively.
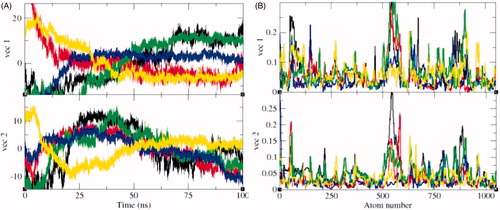
Figure 13. 2D projection of trajectories. The 2D projections of trajectories on eigenvectors showed different projections of SphK1 in case of (A) SphK1, (B) SphK1–PF-543, (C) SphK1–ZINC06823429, (D) SphK1–ZINC95421070, and (E) SphK1–ZINC95421501, respectively.
3.5.7. MMPBSA analysis
The binding energies were calculated by utilising the polar and apolar solvation criterion. This investigation set up the energies related with the binding of PF-543, ZINC06823429, ZINC95421070, and ZINC95421501 to SphK1 during the 100 ns MD simulations. The following protein–ligand energies have been computed such as vdW interaction energy, electrostatic energy, polar solvation energy, SASA energy, and average binding energy (). The polar energy and apolar energy were distinct in different cases. The protein–ligand vdW energy, protein–ligand electrostatic energy, and protein–ligand total energy were found to be lowest in case of SphK1–ZINC95421070. The final average binding energy calculations also recommended the week interaction of ZINC95421070 in the internal cavity of SphK1. The ligands ZINC06823429 and PF-543 are found to have a good binding energy values.
Table 6. Average binding energy calculation using g_mmpbsa package implemented in GROMACS for high-throughput MMPBSA calculation for protein–ligand complexes.
4. Discussion
Breast carcinoma continues to be the world’s leading cause of women’s death owing to its poor prognosis and recurrence. It has been observed that SphK1, a kinase that generates S1P, is highly elevated in multiple carcinomas including breast carcinomaCitation14. The expression level of SphK1 was examined in feline mammary tumour specimens and found that SphK1 plays an important role in feline mammary tumours and may be used as therapeutic targetCitation68. Targeting SphK1 in triple-negative MDA-MB-231 breast cancer cells decreased proliferation and survival by compromising protein kinase C activity and cytokinesisCitation69. SphK1 activity has also been linked to the effects of several microRNAs that are regulated by oestrogen receptor (ER). The miR-515-5P, a tumour suppressor shows to reduce SphK1 activity and loss of miR-515-5P. In addition, 17β-oestradiol treatment downregulated miR-515-5P levels in ER-positive compared to ER-negative breast cancersCitation70. Recently, Costales et al.Citation71 designed a small molecule that selectively targets the microRNA-515 hairpin precursor to inhibit the production of miR-515 that represses SphK1 enzyme.
Several preclinical studies have used mouse breast cancer models to investigate the effects of SphK1 inhibitors on tumour growth. A variety of sphingolipid based and nolipidic small molecule inhibitors of SphK1 have been reported and have shown cytotoxic effects in several resistant cancer cell linesCitation72. Many of the inhibitors are withdrawn from clinical trials due to their side effects and limited efficacy. A combination of the non-specific SphK1 inhibitor SKI-II with gefitinib significantly inhibited growth of xenograft MDA-MB-468 triple-negative breast cancer (TNBC) tumours, whereas neither SKI-II nor gefitinib alone had any effectsCitation73. Another SphK1 inhibitor SKI-5C significantly reduced the growth of tumours from TNBC cell line MDA-MB-231 in xenografted SCID miceCitation74. Recently, a series of amidine-based inhibitors with high selectivity for SphK1 were predicted using docking studyCitation75,Citation76. However, these inhibitors display a short half-life. A novel sphingosine competitive inhibitor PF-543 was discovered and found to inhibit SphK1 with an inhibitory constant of 3.6 nM. In 1483 head and neck carcinoma cells, which are characterised by overexpression of SphK1 and high rate of S1P production, PF-543 decreased the level of endogenous S1PCitation77. In this regard, we have chosen PF-543 as standard inhibitor of SphK1 to compare our findings. Until now, only few inhibitors are known to be effective in inhibition of SphK1 in breast carcinoma but were found to have poor pharmacokinetics profile, cytotoxic at micro molar concentration and ineffective for persistent survival rate in human trialsCitation23. Hence, it is required to identify more influential inhibitors that selectively inhibit SphK1 and lead to apoptosis and growth arrest in breast cancer cells without causing cytotoxic impact in healthy cells.
The computational strategies like virtual screening have been used widely as effective approaches in order to discover and develop new compounds. Previously, we have studied structural and conformational changes in SphK1 at different pH using various spectroscopic techniques and computational methodsCitation78. SphK1 maintains its secondary and tertiary structure in the pH range of 7.5–10.0. However, protein aggregation was observed in the acidic pH range. In the present work, we have identified a potent inhibitor of SphK1 by using several computational approaches such as LBVS, molecular docking, MD simulations, and the MMPBSA calculations. The results were compared with a known inhibitor of SphK1 called PF-543Citation77. Our analysis suggested that the LogP value of ZINC06823429 is about 3.39 and that of PF543 is approximately 5.89, respectively. Thus, the probability of ZINC06823429 being well absorbed is much better as compared to PF-543. The crystal structures of SphK1 were reported in complex with inhibitor PF-543, that will aid in the design of better SphK1 inhibitors with improved propertiesCitation36. Additionally, the ZINC06823429 followed all the properties of RO5 that makes it a drug like molecule. It has same number of hydrogen bond donor as well as hydrogen bond acceptor when compared with PF-543. In accordance with the ADMET profiling, the HIA, PPB, BBB, CYP2D6 solubility, and toxicity value of ZINC06823429 was found to be in harmony with the standard drug PF-543.
The molecular docking analysis suggested that ZINC06823429 has higher binding energy (–11.69 kcal/mol) than the PF-543 (–9 kcal/mol). The MD simulations study suggested that the binding of ZINC06823429 leads to unfolding of SphK1 at greater extent. This may be due to proper inhibition of SphK1 or unfolding of α-helical regions. The trace of the covariance matrix and Eigenvalues was higher in case of SphK1–ZINC06823429 than SphK1–PF-543 due to irregular fluctuations in SphK1 upon binding of ZINC06823429. Finally, the MMPBSA analysis suggested that the average binding energy of ZINC06823429 with SphK1 was highest among all the inhibitors. The average binding energy of SphK1–ZINC06823429 and SphK1–PF-543 was found to be –380 kJ/mol and –276 kJ/mol, respectively. Thus, to the best of our knowledge, this is the first computational predictions based on LBVS, molecular docking, MD simulations, and the MMPBSA calculations to identify a novel inhibitor that precisely target SphK1.
Although, we have performed detailed computational analysis of drug binding to SphK1, there are many possible research limitations. There are no experimental validations to support this computational prediction. The experimental validations of the present work are needed to support these data in order to perform proper clinical trials of identified drug. The results of computational analysis can have several variations when it is executed by different software using different force fields. Furthermore, the chemical libraries can be extended and side chain modifications of current drug are needed for better efficacy. There are remarkable improvements in the field of protein dynamics, still the validations of simulation methods and broad range of experimental observations are requiredCitation79. Additionally, the theoretical prediction may have several variations when it comes to experimental level such as difference in binding affinity of predicted inhibitors with SphK1. The difference may arise due to large number of possible poses of an inhibitor and different folded conformations of receptorCitation80.
5. Conclusions
The recent computational approaches were employed to study and discover new SphK1 inhibitors that could be a starting point for a promising drug candidate in the treatment of breast cancer. Various repositories of chemical compounds such as DrugBank, Ligand Expo, ChEMBL, ChEBI, GLASS, HMDB, and ZINC databases were used to perform LBVS. The screened compounds along with standard PF-543 have been taken forward to evaluate drug likeness, ADMET properties, lead likeness, and PAINS analyses. Further, docking study revealed that the ligand ZINC06823429 has greater binding energy (–11.36 kcal/mol) than PF-543 (–9.90 kcal/mol). It was subsequently strengthened by MD simulation and MMPBSA calculations to check the stability of its mode of binding and thereby inhibiting activity of SphK1. The present study predicted strong inhibitory effects of new compound that could become a starting point for future development and structure activity relationship studies for the discovery of new SphK1 inhibitors. The experimental validations are further required to support this outcome in order to perform proper clinical trials. The computational prediction may have different inhibitory effects and binding affinity of inhibitor with SphK1. The difference may arise due to large number of possible poses of an inhibitor and different folded conformations of receptor.
Disclosure statement
The authors would like to declare no conflict of interest. This article does not contain any studies with human participants or animals performed by any of the authors.
Additional information
Funding
Related Research Data
References
- Fradelos EC, Papathanasiou IV, Veneti A, et al. Psychological distress and resilience in women diagnosed with breast cancer in Greece. Asian Pac J Cancer Prev 2017;18:2545–50.
- Montazeri A. Health-related quality of life in breast cancer patients: a bibliographic review of the literature from 1974 to 2007. J Exp Clin Cancer Res: CR 2008;27:32.
- Sountharrajan S, Karthiga M, Suganya E, Rajan C. Automatic classification on bio medical prognosis of invasive breast cancer. Asian Pac J Cancer Prev 2017;18:2541–4.
- Siegel RL, Miller KD, Jemal A. Cancer statistics, 2018. CA: Cancer J Clin 2018;68:7–30.
- Eisemann N, Waldmann A, Katalinic A. Epidemiology of breast cancer – current figures and trends. Geburtshilfe Frauenheilkd 2013;73:130–5.
- Fan P, Maximov PY, Curpan RF, et al. The molecular, cellular and clinical consequences of targeting the estrogen receptor following estrogen deprivation therapy. Mol Cell Endocrinol 2015;418:245–63.
- Figueroa-Magalhães MC, Jelovac D, Connolly R, Wolff AC. Treatment of HER2-positive breast cancer. Breast 2014;23:128–36.
- Fujimoto Y, Yamaguchi K, Ueno A, et al. A case of HER2-positive breast cancer with liver metastases showing three years of complete response to combination therapy with trastuzumab plus pertuzumab. Gan To Kagaku Ryoho 2018;45:459–61.
- Apuri S. Neoadjuvant and adjuvant therapies for breast cancer. South Med J 2017;110:638–42.
- Sanchez-Spitman AB, Swen JJ, Dezentje VO, et al. Clinical pharmacokinetics and pharmacogenetics of tamoxifen and endoxifen. Expert Rev Clin Pharmacol 2019;12:523–36.
- Zheng L, Li X, Meng X, et al. Competing endogenous RNA networks of CYP4Z1 and pseudogene CYP4Z2P confer tamoxifen resistance in breast cancer. Mol Cell Endocrinol 2016;427:133–42.
- Chandarlapaty S, Chen D, He W, et al. Prevalence of ESR1 mutations in cell-free DNA and outcomes in metastatic breast cancer: a secondary analysis of the BOLERO-2 Clinical Trial. JAMA Oncol 2016;2:1310–5.
- Shimizu Y, Furuya H, Tamashiro PM, et al. Genetic deletion of sphingosine kinase 1 suppresses mouse breast tumor development in an HER2 transgenic model. Carcinogenesis 2018;39:47–55.
- Geffken K, Spiegel S. Sphingosine kinase 1 in breast cancer. Adv Biol Regul 2018;67:59–65.
- Tsuchida J, Nagahashi M, Nakajima M, et al. Breast cancer sphingosine-1-phosphate is associated with phospho-sphingosine kinase 1 and lymphatic metastasis. J Surg Res 2016;205:85–94.
- Sukocheva O, Wadham C, Holmes A, et al. Estrogen transactivates EGFR via the sphingosine 1-phosphate receptor Edg-3: the role of sphingosine kinase-1. J Cell Biol 2006;173:301–10.
- Takabe K, Kim RH, Allegood JC, et al. Estradiol induces export of sphingosine 1-phosphate from breast cancer cells via ABCC1 and ABCG2. J Biol Chem 2010;285:10477–86.
- Li J, Song Z, Wang Y, et al. Overexpression of SphK1 enhances cell proliferation and invasion in triple-negative breast cancer via the PI3K/AKT signaling pathway. Tumour Biol 2016;37:10587–93.
- Hatoum D, Haddadi N, Lin Y, et al. Mammalian sphingosine kinase (SphK) isoenzymes and isoform expression: challenges for SphK as an oncotarget. Oncotarget 2017;8:36898–929.
- Zhu YJ, You H, Tan JX, et al. Overexpression of sphingosine kinase 1 is predictive of poor prognosis in human breast cancer. Oncol Lett 2017;14:63–72.
- Byun HS, Pyne S, Macritchie N, et al. Novel sphingosine-containing analogues selectively inhibit sphingosine kinase (SK) isozymes, induce SK1 proteasomal degradation and reduce DNA synthesis in human pulmonary arterial smooth muscle cells. Medchemcomm 2013;4:1394.
- Marfe G, Mirone G, Shukla A, Stefano C. Sphingosine kinases signalling in carcinogenesis. Mini Rev Med Chem 2015;15:300–14.
- Pitman MR, Costabile M, Pitson SM. Recent advances in the development of sphingosine kinase inhibitors. Cell Signal 2016;28:1349–63.
- Al-Dabbagh MM, Salim N, Himmat M, et al. Quantum probability ranking principle for ligand-based virtual screening. J Comput Aided Mol Des 2017;31:365–78.
- Forli S, Huey R, Pique ME, et al. Computational protein–ligand docking and virtual drug screening with the AutoDock suite. Nat Prot 2016;11:905–19.
- von Behren MM, Rarey M. Ligand-based virtual screening under partial shape constraints. J Comput Aided Mol Des 2017;31:335–47.
- Lohning AE, Levonis SM, Williams-Noonan B, Schweiker SS. A practical guide to molecular docking and homology modelling for medicinal chemists. Curr Top Med Chem 2017;17:2023–40.
- Morris GM, Lim-Wilby M. Molecular docking. Methods Mol Biol 2008;443:365–82.
- Kontoyianni M. Docking and virtual screening in drug discovery. Methods Mol Biol 2017;1647:255–66.
- Liu X, Shi D, Zhou S, et al. Molecular dynamics simulations and novel drug discovery. Expert Opin Drug Discov 2018;13:23–37.
- Khan FI, Wei DQ, Gu KR, et al. Current updates on computer aided protein modeling and designing. Int J Biol Macromol 2016;85:48–62.
- Ali S, Khan FI, Mohammad T, et al. Identification and evaluation of inhibitors of lipase from Malassezia restricta using virtual high-throughput screening and molecular dynamics studies. Int J Mol Sci 2019;20:884.
- Beg A, Khan FI, Lobb KA, et al. High throughput screening, docking, and molecular dynamics studies to identify potential inhibitors of human calcium/calmodulin-dependent protein kinase IV. J Biomol Struct Dyn 2019;37:2179–92.
- Wang C, Greene D, Xiao L, et al. Recent developments and applications of the MMPBSA method. Front Mol Biosci 2018;4:87.
- Ju T, Gao D, Fang ZY. Targeting colorectal cancer cells by a novel sphingosine kinase 1 inhibitor PF-543. Biochem Biophys Res Commun 2016;470:728–34.
- Wang J, Knapp S, Pyne NJ, et al. Crystal structure of sphingosine kinase 1 with PF-543. ACS Med Chem Lett 2014;5:1329–33.
- Zoete V, Daina A, Bovigny C, Michielin O. SwissSimilarity: a web tool for low to ultra high throughput ligand-based virtual screening. J Chem Inf Model 2016;56:1399–404.
- Law V, Knox C, Djoumbou Y, et al. DrugBank 4.0: shedding new light on drug metabolism. Nucleic Acids Res 2014;42:D1091–7.
- Feng Z, Chen L, Maddula H, et al. Ligand Depot: a data warehouse for ligands bound to macromolecules. Bioinformatics 2004;20:2153–5.
- Bento AP, Gaulton A, Hersey A, et al. The ChEMBL bioactivity database: an update. Nucleic Acids Res 2014;42:D1083–90.
- Degtyarenko K, de Matos P, Ennis M, et al. ChEBI: a database and ontology for chemical entities of biological interest. Nucleic Acids Res 2007;36:D344–50.
- Chan WK, Zhang H, Yang J, et al. GLASS: a comprehensive database for experimentally validated GPCR-ligand associations. Bioinformatics 2015;31:3035–42.
- Wishart DS, Jewison T, Guo AC, et al. HMDB 3.0 – The Human Metabolome Database in 2013. Nucleic Acids Res 2012;41:D801–7.
- Irwin JJ, Sterling T, Mysinger MM, et al. ZINC: a free tool to discover chemistry for biology. J Chem Inf Model 2012;52:1757–68.
- Shahinozzaman M, Ishii T, Ahmed S, et al. A computational approach to explore and identify potential herbal inhibitors for the p21-activated kinase 1 (PAK1). J Biomol Struct Dyn 2019;1–21.
- Egan WJ, Merz KM, Baldwin JJ. Prediction of drug absorption using multivariate statistics. J Med Chem 2000;43:3867–77.
- Veber DF, Johnson SR, Cheng HY, et al. Molecular properties that influence the oral bioavailability of drug candidates. J Med Chem 2002;45:2615–23.
- Ghose AK, Viswanadhan VN, Wendoloski JJ. A knowledge-based approach in designing combinatorial or medicinal chemistry libraries for drug discovery. 1. A qualitative and quantitative characterization of known drug databases. J Comb Chem 1999;1:55–68.
- Egan WJ, Lauri G. Prediction of intestinal permeability. Adv Drug Deliv Rev 2002;54:273–89.
- Muegge I, Heald SL, Brittelli D. Simple selection criteria for drug-like chemical matter. J Med Chem 2001;44:1841–6.
- Dahlin JL, Nissink JWM, Strasser JM, et al. PAINS in the assay: chemical mechanisms of assay interference and promiscuous enzymatic inhibition observed during a sulfhydryl-scavenging HTS. J Med Chem 2015;58:2091–113.
- Daina A, Michielin O, Zoete V. SwissADME: a free web tool to evaluate pharmacokinetics, drug-likeness and medicinal chemistry friendliness of small molecules. Sci Rep 2017;7:42717.
- Rizvi SM, Shakil S, Haneef M. A simple click by click protocol to perform docking: AutoDock 4.2 made easy for non-bioinformaticians. EXCLI J 2013;12:831–57.
- Van Der Spoel D, Lindahl E, Hess B, et al. GROMACS: fast, flexible, and free. J Comput Chem 2005;26:1701–18.
- Schuttelkopf AW, van Aalten DM. PRODRG: a tool for high-throughput crystallography of protein–ligand complexes. Acta Crystallogr D Biol Crystallogr 2004;60:1355–63.
- Humphrey W, Dalke A, Schulten K. VMD: visual molecular dynamics. J Mol Graph 1996;14:33–8, 27–8.
- Gramany V, Khan FI, Govender A, et al. Cloning, expression, and molecular dynamics simulations of a xylosidase obtained from Thermomyces lanuginosus. J Biomol Struct Dyn 2016;34:1681–92.
- Khan FI, Aamir M, Wei DQ, et al. Molecular mechanism of Ras-related protein Rab-5A and effect of mutations in the catalytically active phosphate-binding loop. J Biomol Struct Dyn 2016;35:1–14.
- Khan FI, Govender A, Permaul K, et al. Thermostable chitinase II from Thermomyces lanuginosus SSBP: cloning, structure prediction and molecular dynamics simulations. J Theor Biol 2015;374:107–14.
- Khan FI, Nizami B, Anwer R, et al. Structure prediction and functional analyses of a thermostable lipase obtained from Shewanella putrefaciens. J Biomol Struct Dyn 2016;35:1–13.
- Khan FI, Shahbaaz M, Bisetty K, et al. Large scale analysis of the mutational landscape in beta-glucuronidase: a major player of mucopolysaccharidosis type VII. Gene 2016;576:36–44.
- Kumari R, Kumar R, Lynn A. g_mmpbsa – a GROMACS tool for high-throughput MM-PBSA calculations. J Chem Inf Model 2014;54:1951–62.
- Kuzmanic A, Zagrovic B. Determination of ensemble-average pairwise root mean-square deviation from experimental B-factors. Biophys J 2010;98:861–71.
- Hubbard RE, Kamran Haider M. Hydrogen Bonds in Proteins: Role and Strength. In: Encyclopediaof Life Sciences (ELS), Chichester: John Wiley & Sons, Ltd.; 2010. doi:10.1002/9780470015902.a0003011.pub2
- Maisuradze GG, Liwo A, Scheraga HA. Principal component analysis for protein folding dynamics. J Mol Biol 2009;385:312–29.
- David CC, Jacobs DJ. Principal component analysis: a method for determining the essential dynamics of proteins. Methods Mol Biol 2014;1084:193–226.
- Tiana G, Simona F, De Mori GM, et al. Understanding the determinants of stability and folding of small globular proteins from their energetics. Protein Sci 2004;13:113–24.
- Chang YC, Chuang HL, Yin JH, et al. Significance of sphingosine kinase 1 expression in feline mammary tumors. BMC Vet Res 2019;15:155.
- Kotelevets N, Fabbro D, Huwiler A, Zangemeister-Wittke U. Targeting sphingosine kinase 1 in carcinoma cells decreases proliferation and survival by compromising PKC activity and cytokinesis. PLoS One 2012;7:e39209.
- Pinho FG, Frampton AE, Nunes J, et al. Downregulation of microRNA-515-5p by the estrogen receptor modulates sphingosine kinase 1 and breast cancer cell proliferation. Cancer Res 2013;73:5936–48.
- Costales MG, Hoch DG, Abegg D, et al. A designed small molecule inhibitor of a non-coding RNA sensitizes HER2 negative cancers to herceptin. J Am Chem Soc 2019;141:2960–74.
- Plano D, Amin S, Sharma AK. Importance of sphingosine kinase (SphK) as a target in developing cancer therapeutics and recent developments in the synthesis of novel SphK inhibitors. J Med Chem 2014;57:5509–24.
- Martin JL, de Silva HC, Lin MZ, et al. Inhibition of insulin-like growth factor-binding protein-3 signaling through sphingosine kinase-1 sensitizes triple-negative breast cancer cells to EGF receptor blockade. Mol Cancer Ther 2014;13:316–28.
- Datta A, Loo SY, Huang B, et al. SPHK1 regulates proliferation and survival responses in triple-negative breast cancer. Oncotarget 2014;5:5920–33.
- Houck JD, Dawson TK, Kennedy AJ, et al. Structural requirements and docking analysis of amidine-based sphingosine kinase 1 inhibitors containing oxadiazoles. ACS Med Chem Lett 2016;7:487–92.
- Gupta P, Mohammad T, Khan P, et al. Evaluation of ellagic acid as an inhibitor of sphingosine kinase 1: a targeted approach towards anticancer therapy. Biomed Pharmacother 2019;118:109245.
- Schnute ME, McReynolds MD, Kasten T, et al. Modulation of cellular S1P levels with a novel, potent and specific inhibitor of sphingosine kinase-1. Biochem J 2012;444:79–88.
- Gupta P, Khan FI, Roy S, et al. Functional implications of pH-induced conformational changes in the Sphingosine kinase 1. Spectrochim Acta A: Mol Biomol Spectrosc 2020;225:117453.
- Papaleo E. Integrating atomistic molecular dynamics simulations, experiments, and network analysis to study protein dynamics: strength in unity. Front Mol Biosci 2015;2:28.
- Rose JA, Suyama A. Physical modeling of biomolecular computers: models, limitations, and experimental validation. Nat Comput 2004;3:411–26.