
Abstract
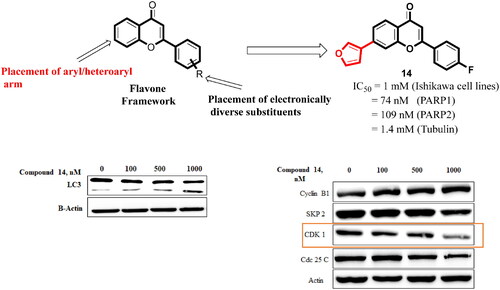
Structural tailoring of the flavone framework (position 7) via organopalladium-catalyzed C–C bond formation was attempted in this study. The impact of substituents with varied electronic effects (phenyl ring, position 2 of the benzopyran scaffold) on the antitumor properties was also assessed. Resultantly, the efforts yielded a furyl arm bearing benzopyran possessing a 4-fluoro phenyl ring (position 2) (14) that manifested a magnificent antitumor profile against the Ishikawa cell lines mediated through dual inhibition of PARP and tubulin [(IC50 (PARP1) = 74 nM, IC50 (PARP2) = 109 nM) and tubulin (IC50 = 1.4 µM)]. Further investigations confirmed the ability of 14 to induce apoptosis as well as autophagy and cause cell cycle arrest at the G2/M phase. Overall, the outcome of the study culminated in a tractable dual PARP-tubulin inhibitor endowed with an impressive activity profile against endometrial cancer.
GRAPHICAL ABSTRACT
1. Introduction
Cancer is a multifactorial and deadly diseaseCitation1–3 characterised by the development of uncontrollably dividing abnormal cells that infiltrate and destroy normal body tissue.Citation4–6 One of the major areas of concern in the category of gynaecologic cancers, is endometrial cancer, with over 60 000 new cases diagnosed per year in the United States alone.Citation7–16 Endometrial cancer starts in the endometrium (lining of the uterus) and is mostly observed in postmenopausal women, with few cases occurring in younger women. The aetiology of endometrial cancer includes genetic and epigenetic alterations.Citation17–23 Curative surgery including total hysterectomy and bilateral salpingo-oophorectomy is the recommended treatment strategy for early-stage endometrial cancer. For the advanced stage of endometrial cancer, reliance on chemotherapy is a prudent choice.Citation24 Disappointingly, treatment options for advanced endometrial cancer are marred by a lack of new targeted agents and it is conceived that supplementing the armoury of anticancer interventions for endometrial cancer via logical fabrication of scaffolds is the need of the hour.
Literature precedents indicate that recent attempts by medicinal chemists in the field of new anti-cancer drug development have been directed towards the design of dual-targeting inhibitors.Citation24–29 This inclination is attributed to the synergistic antiproliferation effects evidenced by the “one scaffold – two targets approach”. Noteworthy to mention that resorting to a cocktail of drugs (two drugs two targets) is also a tried-tested option to attain amplified antitumor effects. However, multifunctional chemical architectures score over combination therapy owing to the issues associated with the use of two chemotherapeutic drugs (combination therapy) viz., undesirable drug − drug interactions, complicated pharmacokinetics, and intricate toxicity profiles.Citation26–29 Given the aforementioned, the design of dual inhibitors was envisioned as a logical stratagem to load the anti-endometrial cancer chemical toolbox in this study.
Albeit the approach of furnishing multifunctional therapeutics for cancer appears to be fascinating, the selection of the targets that can be modulated simultaneously or concomitantly to attain enhanced anti-tumour efficacy is a critical and daunting task.Citation30–31 Delightfully, an extensive literature survey led us to arrive at the candidature of PARP and tubulin as druggable targets for the design of new structural assemblages for endometrial cancer.Citation30–34
Poly (ADP-ribose) polymerases (or PARPs) are a family of proteins involved in DNA damage repair.Citation35,Citation36 Amongst the various members, PARP1 and PARP2 are major enzymes that regulate the DNA damage response through the process of parylation (transfer of PAR chains from the nicotinamide-adenine-dinucleotide).Citation36 Various scientific reports have been published that indicate that the increased PARP levels in a variety of cancer cells lead to genomic instability, resistance of cells towards death, replicative immortality, and reprogrammed metabolism.Citation37 The last decade witnessed the FDA approvals of several PARP inhibitors for the treatment of BRCA mutations harbouring cancer viz. Olaparib for breast cancer, niraparib for ovarian cancer, rucaparib for pancreatic cancer, and talazoparib for prostate cancer. Other than the aforestated inhibitors, fuzuloparib, and pamiparib have received CFDA approvals. Veliparib, stenoparib, mefuparib, and RBN-2397 represent the investigational small molecule PARP inhibitors.Citation30 Much to the delight, recent disclosures perspicuously underscore the favourable trends witnessed with PARP inhibitors in endometrial cancer such as: (i) the promising efficacy of olaparib in advanced endometrial carcinomaCitation31 (ii) pathologic complete response of high-grade endometrial cancer to PARP inhibitorsCitation32 (iii) optimistic activity profile of a triplet regimen consisting of PARP inhibitor in recurrent, advanced endometrial carcinomaCitation33 (iv) manifestation of efficacy by olaparib, in cultured endometrial carcinoma cells.Citation34 These outcomes clearly advocate for the targeting of PARPs in endometrial cancer.
Along with PARP, Tubulin was pinpointed as a promising target for endometrial cancer.Citation38–40 As such, tubulin is a basic building block of microtubules, the cytoskeleton protein polymer, involved in cell structure maintenance, intracellular organelle transportation, and distribution of cells during the cell cycle.Citation40–42 The last three decades have evidenced an explosion of research on tubulin inhibitors that has led to the furnishment of numerous chemical architectures eliciting efficacy in diverse malignancies. Extensive research in this direction has resulted in some FDA approvals, along with the emergence of many investigational drugs. Encouragingly, tubulin inhibitor AEZS 112 was reported to inhibit the growth of experimental human ovarian and endometrial cancers.Citation43 In addition, tubulin inhibitors as monotherapy, as well as a part of combination therapy, are being evaluated in clinical trials for the treatment of endometrial cancer (NCT03981796). Overall, the progress chart of tubulin inhibitors has validated tubulin as one of the most sought-after targets for cancer chemotherapy.
In addition to the reports of the efficacy of PARP and tubulin in endometrial cancer (monotherapy), some precedents advocate for a more pronounced efficacy of a combination of PARP and tubulin inhibitors ascertaining the benefits of simultaneous modulation of both targets. A study outcome demonstrated that a cocktail of PARP inhibitors with paclitaxel decreased endometrial cancer cell viability.Citation44 Also, PARP inhibitors sensitised endometrial cancer cells to cytotoxic treatment with paclitaxel.Citation44 Moreover, a combination of PARP inhibitor AZD5305 with paclitaxel is currently being assessed in endometrial cancer in a clinical trial (NCT04644068). Also, a recent study outcome demonstrated the striking antitumor efficacy of a small molecule dual PARP-tubulin inhibitor against various cancers.Citation45 The aforementioned shreds of evidence clubbed with assertions claiming that multifunctional scaffolds can eliminate the need for extensive investigations required for combination therapy, the theoretical basis of the present study was formulated to design dual PARP-Tubulin inhibitors, anticipating promising efficacy of the adducts in endometrial cancer.
2. Drug design
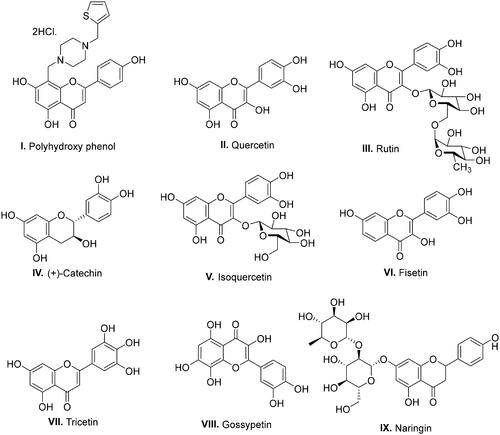
With a clear cut-idea in hand to design dual PARP-tubulin inhibitors as prospective therapeutics for endometrial cancer, our drug discovery team commenced with the screening of the synthetic bank of the laboratory for pinpointing adducts endowed with dual modulatory ability towards PARP and tubulin. Noteworthy to mention that lately, our medicinal chemistry campaigns have focused on the structural engineering of alkaloids and flavonoids as well as the synthesis of natural product-inspired libraries of bioactive scaffolds. Delightfully, the screening results led us to arrive at the structural template of biaryl-type flavones that were previously furnished by our research group to amplify the tubulin inhibitory potential of flavones. Unfortunately, the endeavour was halted as the generated templates did not elicit an amplified tubulin polymerisation inhibitory activity, however, retention/modest reduction in tubulin inhibition was observed with most of the structures (unpublished work). Excitingly, in the screening assay, the prototype compound of the biaryl-type flavones demonstrated moderate potential to inhibit PARP1 and PARP2. This preliminary screening result is aligned with several disclosures ascertaining the PARP inhibitory potential of flavone-based adducts ().Citation46–49 Given the optimistic direction, we conceived structural tailoring of biaryl-type flavones might culminate into a tractable anti-endometrial cancer agent mediating efficacy via dual PARP1/PARP2-tubulin inhibition.
Figure 1. Reported flavonoid-based PARP inhibitors.
Before the commencement of the task to design and generate a compendium of biaryl-type flavones, a docking study of prototype biaryl flavone 1 was conducted within the active site of PARP1, PARP2, and tubulin. The docking protocol was first validated by redocking the respective co-crystallized ligands with PARP1, PARP2, and tubulin proteins (). The re-docked ligands/inhibitors of these proteins (PARP1, PARP2, and tubulin) produced poses similar to the co-crystallized ligands/inhibitors with PARP1, PARP2 and tubulin (PDB IDs: 5DS3, 4TVJ and 1SA0, respectively), indicating that a rational docking protocol was used in this study. The docking score (binding free energy) as well as residues involved in hydrogen bonding and hydrophobic interactions are presented in .
Figure 2. Validation of the docking protocol. The docking protocol was validated via redocking the co-crystallized ligands. The re-docked ligands (yellow) produced a pose similar to those of the co-crystallized ligands (red) (A- PARP1; B- PARP2 and C- Tubulin).
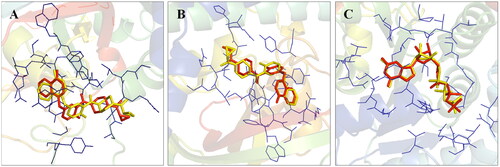
Table 1. Docking score and residues involved in binding interactions of compound 1 with PARP1, PARP2, and tubulin.
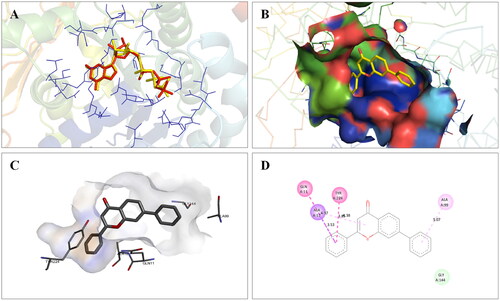
The docking interactions of compound 1 with active site residues of PARP1 (PDB ID: 5DS3) are shown in . Compound 1 exhibited hydrophobic interactions with His862, Tyr896 & Tyr907 residues (pi-pi type) and Ala880, Ala898 & Lys903 residues (pi-alkyl type) in the active site of PARP1 protein. shows the docking interactions of compound 1 with active site residues of PARP2 (PDB ID: 4TVJ). Hydrophobic interactions with Tyr462 & Tyr473 residues (pi-pi type), Ala446, Ala464 & Lys469 residues (pi-alkyl type), and electrostatic interaction with Glu335 residue (pi-anion type) in the active site of PARP2 protein were observed. The interaction profile of compound 1 with the amino acid residues of tubulin (PDB ID: 1SA0) is depicted in . The prototype flavone manifested hydrophobic interactions with Gln11 & Tyr224 residues (pi-pi type), Ala12 & Ala99 residues (pi-alkyl type) and Ala12 residue (pi-sigma type) in the active site of tubulin protein.
Figure 3. Interaction analysis of 1 with PARP1. (A) Overlay of 1 (yellow) with co-crystallized ligand (red). (B) Orientation of 1 in the active site. (C) 3D docked pose of 1. (D) 2D docked pose of 1 showing hydrophobic interactions with PARP1.
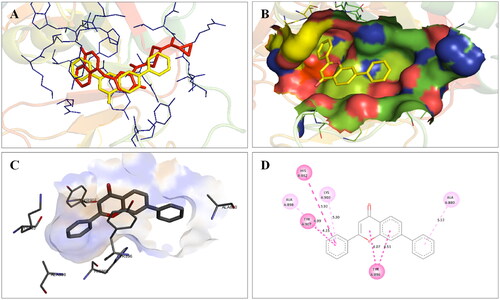
Figure 4. Interaction analysis of 1 with PARP2. (A) Overlay of 1 (yellow) with co-crystallized ligand (pink). (B) Orientation of 1 in the active site of PARP2 protein. (C) 3D docked pose of 1. (D) 2D docked pose of 1 showing hydrophobic interactions.
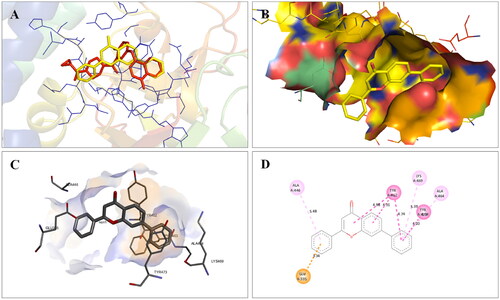
Figure 5. Interaction analysis of 1 with tubulin. (A) Overlay of 1 (yellow) with co-crystallized ligand (pink). (B) Orientation of 1 in the active site of tubulin. (C) 3D docked pose of 1. (D) 2D docked pose of 1 showing hydrophobic interactions with tubulin.
Overall, the docking results indicated that flavone 1 was well accommodated within the active site of PARP1, PARP2, and tubulin. Based on the interaction profile of flavone 1, it was conceived that the structural embellishment of the flavone framework might lead to additional interactions (hydrogen bonding and others) with the amino acid residues of the targets, thereby enhancing the enzyme inhibitory activity. With this background, a series of biaryl flavones was accomplished as depicted in and subjected to a series of biological evaluation assays. Encouragingly, a dual PARP-tubulin inhibitor 14 endowed with magnificent cellular activity against the endometrial cancer cell lines was identified in the present study. The bifunctional adduct demonstrated the potential to induce apoptosis as well as autophagy and caused cell cycle arrest at the G2-M phase.
Figure 6. Design strategy.
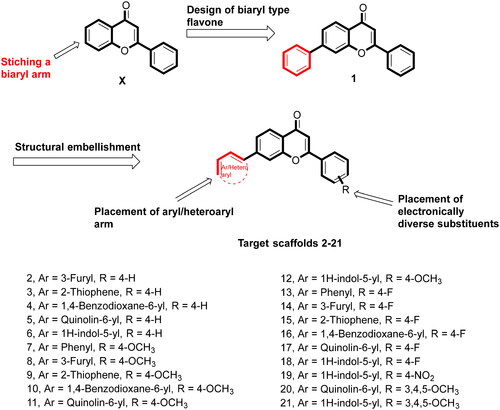
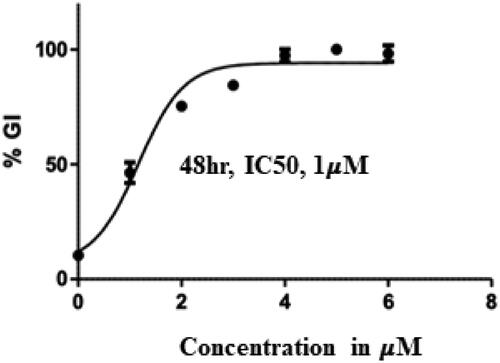
Figure 7. IC50 value of compound 14 (Treatment concentrations- 2,4,6 and 8 µM).
3. Results and discussions
3.1. Synthesis
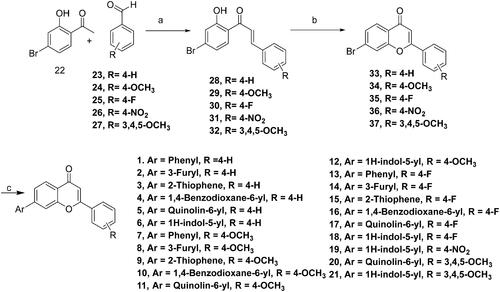
The designed compounds (1–21) were furnished via a multistep synthetic route depicted in Scheme 1. Commercially available aromatic aldehydes and ketones with diverse substitutions were used for the base-mediated Claisen Schmidt condensation to afford intermediates 28–32. Iodine-mediated cyclisation of intermediates 28–32 yielded the benzopyrans (33–37). Notably, the absence of proton resonance (β to carbonyl) in intermediates (33–37) confirmed the intramolecular attack of the hydroxy group at the β carbon leading to the cyclisation of adducts 28–32. Forth, the benzopyrans (33–37) were subjected to C-C bond formations via Suzuki arylation employing diverse boronic acids to obtain the target structural assemblages (1–21). Overall, the established synthetic protocol was robust and efficient and afforded the synthesis of target compounds in moderate to excellent yields. Imperative to mention that the Suzuki arylation methodology enabling C-C bond formations at position 7 of the benzopyran skeleton was flexible enough to enable the installation of aryl as well as heteroaryl arms.
Scheme 1. Reagents and conditions: (A) NaOH, Ethanol, rt, 24h; (B) I2, DMSO, reflux, 24 Wh; (C) aryl/heteroaryl boronic acids, Pd(PPh3), Dioxane: Water (9:3), reflux, 100 °C, 2h.
3.2. In-vitro cytotoxicity studies
The cell growth inhibitory effects of the synthesised compounds were evaluated against Ishikawa cell lines. Comparisons were done with flavone X, biaryl flavone 1, olaparib (FDA-approved PARP inhibitor), and combretastatin (tubulin inhibitor) (). The assessment commenced with the screening of compound 1 which elicited moderate cell growth inhibitory potential against the employed cell line with an IC50 value of 3 µM. This observation depicted that stitching of the aryl ring on the flavone framework conferred cell growth inhibitory potential to the resulting scaffolds (compare X with 1). Further, analysis was done to compare the cytotoxicity of compound 1 with other substituted benzopyrans (compounds 2–6). The outcome perspicuously revealed that the Suzuki arylation to afford C–C bond formation on the benzopyran framework led to the amplification of the cell growth inhibitory effects only in cases where benzopyrans were appended to a monocyclic heteroaryl ring (2, 3). Notably, biaryls 2 and 3 demonstrated more pronounced cytotoxic effects than their counterpart 1 with IC50 values of 1.5 and 2.1 µM, respectively. The higher cell growth inhibitory effects of biaryl 2 bearing a furyl ring could be attributed to the tendency of oxygen to form stronger hydrogen bonds. However, contrary to the expectations, the diametrically opposite impact of tethering a sterically bulky biaryl arm on the benzopyran skeleton was observed as biaryl flavones 4–6 demonstrated cytotoxicity-devoid trends. This indicated that the enhancement of steric bulk at the benzopyran framework (position 7) was not tolerable. Forth, the synthesised compounds bearing a substituted phenyl ring at position 2 of the biaryl arm bearing benzopyrans were profiled for the cytotoxic effects. Noteworthy to mention that diverse substitutions with varied electronic effects viz fluorine (−I, +R), methoxy (−I, +R), and nitro (−I and − R) were made on the phenyl ring (position 2 of benzopyran). Also, the trimethoxy phenyl ring well established as an imperative structural feature of tubulin inhibitors was tethered to the benzopyran scaffold (20, 21). Unfortunately, none of the substitution patterns other than fluorine substitution paid dividends in the context of substantial cell growth inhibitory effects.
Table 2. In-vitro growth inhibition (IC50 in µM) effects of the compounds (1–21).
Encouragingly, Flavones 13, 14, and 15 bearing a monocyclic aryl/heteroaryl arm (position 7) and a 4-fluorophenyl ring at position 2 elicited remarkable cytotoxicity profiles with IC50 values of 2.03, 1.00 and 1.5 µM, respectively. Indeed, a careful comparison of the cell growth inhibitory effects of counterparts 1 and 13, 2 and 14, 3 and 15 perspicuously highlights the favourable trends of placing fluorine at the para position of the phenyl ring (position 2 of benzopyran scaffold). Each of the fluorine-bearing adducts outshone its non-fluorine-bearing counterpart with lower IC50 values. Noteworthy to mention that these trends were not replicated by fluorine-bearing adducts 16, 17, and 18 ascertaining the non-preference of the benzopyran towards bicyclic aromatic/heteroaromatic rings (position 7) and biasedness towards the inclusion of monoaryl/heteroaryl arms in their framework. Taken together, compound 14 was pinpointed as the most promising cell growth inhibitor against Ishikawa cell lines () and was further investigated exhaustively.
3.3. Compound 14 inhibits PARP1 and PARP2
Compound 14 was evaluated for its ability to inhibit PARP1 and PARP2. As such, PARP enzymatic activity transfers ADP-ribose from NAD + substrate into the PAR chain on histone substrate. The amount of NAD + remaining after the enzymatic activity was quantified using the Promega NAD/NADH-Glo™ assay kit, in the endpoint PARP activity assay. The compounds were tested in a 10-dose IC50 singlet with a 3-fold serial dilution starting at 10 µM against 2 PARPs. The control compound, Veliparib (ABT-888, PARP inhibitor), was tested in a 10-dose IC50 with a 3-fold serial dilution starting at 0.1 uM. The outcome presented in and depicts the striking inhibitory potential of compound 14 against PARP1 and PARP2 with an IC50 value of 74 nM and 109 nM. These results are highly indicative of PARP inhibition as one of the mechanisms underlying the cytotoxicity of compound 14 against the Ishikawa cell lines.
Figure 8. IC50 values (PARP inhibition) of compound 14, Olaparib and Veliparib.
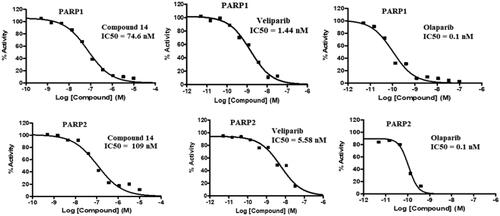
Table 3. PARP1 and PARP2 inhibitory activity of compound 14.
3.4. In-vitro tubulin inhibition
Compound 14 was further profiled for its tubulin inhibitory effects and the results are illustrated in . Combretastatin A-4 was employed as a standard tubulin inhibitor in this study. Encouragingly, flavone 14 manifested magnificent tubulin inhibitory potential with an IC50 value of 1.4 µM. Notably, a correlation of the results presented in clearly reflects that the striking cell growth inhibitory effects of compound 14 stems from its ability to exert dual inhibition of PARP and Tubulin.
Table 4. Tubulin inhibitory activity of compound 14 (Treatment concentrations – 0.1, 1, 5, 10 μM).
3.5. Compound 14 induces apoptosis (nuclear staining)
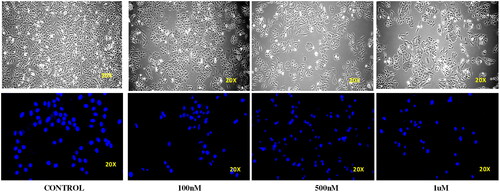
Ishikawa cell lines were treated with compound 14 at concentrations of 0.1, 0.5, and 1 μM for 24 h. Cellular morphology was observed by an inverted microscope. DAPI staining was done to monitor the nuclear morphology. It was observed that treatment with compound 14 led to a concentration-dependent increase in the number of scattered apoptotic bodies in Ishikawa cells. In addition, cell size shrinkage, nuclear condensation and cell wall deformation were observed in the morphology of treated cells. Thus, the results were indicative of the apoptosis-inducing ability of compound 14 ().
Figure 9. Effect of compound 14 on the cell wall and nuclear morphology of Ishikawa cells.
3.6. Compound 14 induces autophagy (acridine orange staining)
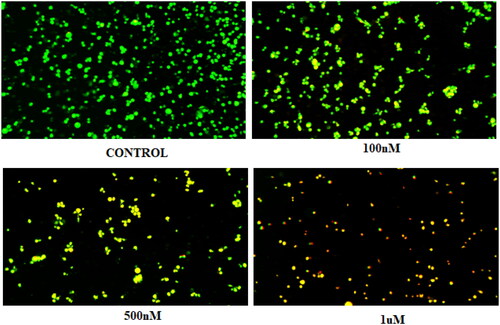
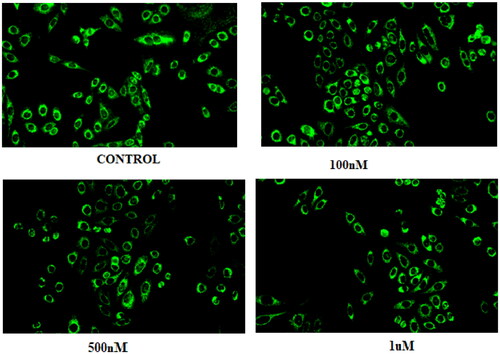
Compound 14 was evaluated for its ability to induce autophagy by acridine orange staining assay. Ishikawa cells were observed in fluorescent micrographs after staining with acridine orange (AO) and propidium iodide (PI). The results depicted in revealed that the cells exhibited green fluorescence in untreated conditions, however, an increase in red fluorescence was observed when cells were treated with varying concentrations of compound 14. The appearance of red fluorescence suggesting the presence of acidic compartments, such as autophagosomes and lysosomes was attributed to the induction of autophagy. This shift towards red fluorescence represents an elevation in autophagic flux, reflecting an active process of cellular degradation and recycling. Overall, the results indicate that compound 14 induces autophagy by increasing autophagic flux in a concentration-dependent manner.
Figure 10. Morphology of untreated Ishikawa cells (control) and those treated with 0.1, 0.5, and 1 µM of compound 14.
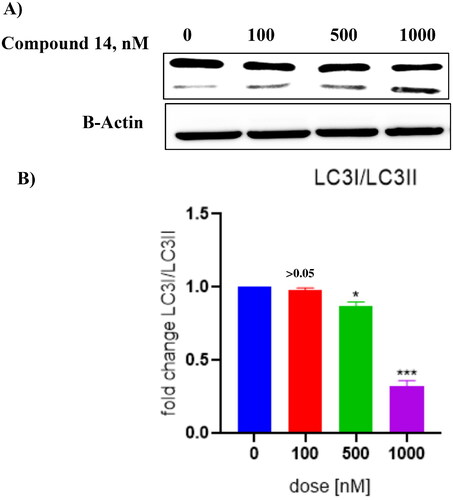
3.7. Compound 14 triggers concentration-dependent cleavage of LC-3
Literature precedents indicate that autophagy triggers the cleavage of tubulin-associated protein LC-3 yielding cytosolic LC3-I (18 kDa) and autophagosome-associated LC3-II (16 kDa).Citation50–58 Thus, the ability of compound 14 was evaluated to induce the cleavage of this cytosolic protein. The results of this assay revealed that compound 14 exerted concentration-dependent cleavage of LC3 in Ishikawa cells (). Considering the aforementioned cleavage of cytosolic microtubule-associated protein light chain-3 (LC3)-I into LC3-II as an autophagy-specific marker, it was deduced that 14 is an autophagy inducer. Notably, the outcome of this assay strengthens the results of the acridine orange staining assay, ascertaining the autophagy-inducing ability of compound 14.
Figure 11. (A) Cleavage of LC-3 (autophagy marker) (B) Protein expression was measured by western blotting after 24 h treatment. The intensity of the band indicates down regulation of proteins in the cells. Data represented as the mean of three independent experiments. Statistical significance is represented as follows: ns - non-significant, * p < 0.05, *** p < 0.001.
3.8. Compound 14 dissipates the mitochondrial membrane potential (rhodamine 123 staining)
Mitochondrial membrane potential was measured by rhodamine-123 (RH-123) staining. Ishikawa cells were treated at 0.1, 0.5, and 1 μM of compound 14. Rhodamine dyes accumulate within active and polarised mitochondria under physiological conditions, resulting in robust fluorescence signals. A decline in rhodamine fluorescence intensity is observed when the dyes fail to accumulate within the mitochondria. This happens when the mitochondrial transmembrane potential is compromised. As evident from the results illustrated in , the treatment of the Ishikawa cells with compound 14 led to a reduction in rhodamine fluorescence in a concentration-dependent manner. The decreased fluorescence patterns associated with apoptotic cell death indicate progressive dissipation of the mitochondrial transmembrane potential ().
Figure 12. Results of Rhodamine staining assay.
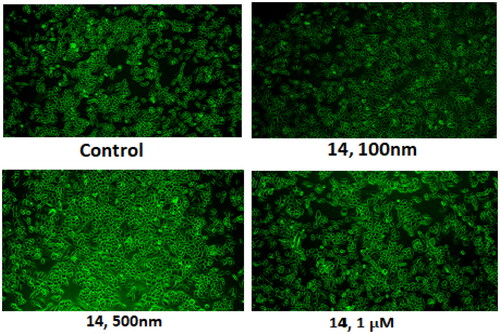
3.9. Compound 14 enhances the intracellular ROS levels
The intracellular ROS levels in control and compound 14-treated cells were examined using the DCFDA fluorescent dye. As compared to the untreated control, a significant increase in fluorescence intensity was observed when Ishikawa cells were treated with compound 14. The outcome of the assay reveals the potential of compound 14 to enhance the intracellular ROS levels that can cause oxidative stress in cells making the tumour cancer cells vulnerable to apoptosis ().
Figure 13. Results of DCFDA staining.
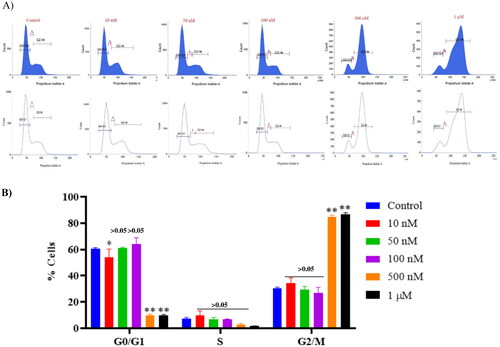
3.10. Compound 14 triggers cell cycle arrest at the G2/M phase
Furthermore, the regulatory effect of compound 14 in the cell cycle distribution of Ishikawa cancer cells was evaluated via flow cytometric analysis. Ishikawa cells seeded on a 6-well plate (3 × 10⁵ cells/well) were treated with compound 14 for 48 h. After 48 h treatment of Ishikawa cells with compound 14, the cell cycle started to be arrested at the G2/M phase. Notably, a significant increase in G2/M phase cell cycle arrest was observed with 0.5 µM and 1 µM of compound 14 as compared to the control group ().
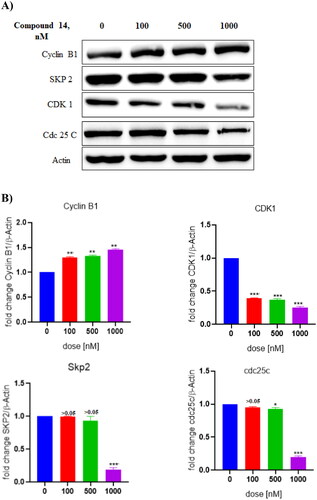
Figure 14. Effect of compound 14 on cell cycle proteins regulating G2/M progression at indicated concentrations. Statistical significance is represented as follows: ns - non-significant, *p < 0.05, ** p < 0.01.
3.11. Compound 14 exerts downregulation of CDK1 protein
Western blot analysis was performed to assess the involvement of proteins in the cell cycle arrest effects of compound 14 on Ishikawa cells. As evident from the results depicted in , the treatment of Ishikawa cells with compound 14 downregulated the expression of CDK1 protein. These results suggested that compound 14 triggered G2/M phase cell cycle arrest by inhibiting the expression of CDK1.
Figure 15. (A) Expression levels of proteins (B) Protein expression was measured by western blotting after 24 h treatment. The intensity of the band indicates the down-regulation of proteins in the cells. Data represented as the mean of three independent experiments. Statistical significance is represented as follows: ns - non-significant, *p < 0.05, ** p < 0.01, *** p < 0.001.
3.12. Docking study
Molecular modelling studies were performed to rationalise the experimental results and figure out the key interactions of compound 14 with the active site residues of PARP1, PARP2, and tubulin. The docking score and residues involved in binding interactions of test compounds with PARP1, PARP2 and tubulin are presented in . The interactions of 14 with active site residues of PARP1 (PDB ID: 5DS3) are outlined in . From the docking study, several key interactions were figured. Notably, a hydrogen bond interaction between the “–O–” functionality of this compound and the “–NH–” group of Gly863 residue (bond distance: 3.07 Å) was observed. Also, compound 14 was involved in some hydrophobic interactions with His862, Tyr889, Tyr896 & Tyr907 residues (pi-pi type) and Ala880 & Ala898 residues (pi-alkyl type) in the active site of PARP1. The docking results of compound 14 with active site residues of PARP2 (PDB ID: 4TVJ) are shown in . Two hydrogen bond interactions were between the “–O–” functionality of this compound and the “–NH–” groups of Arg444 residue (bond distance: 3.19 Å and 3.27 Å). Also, hydrophobic interactions with His428, Tyr462 & Tyr473 residues (pi-pi type), Arg444 residue (pi-alkyl type) and electrostatic interactions with Glu335 & Asp339 residues (pi-charge type) in the active site of PARP2 were seen. Flavone 14 was also docked within the active site of tubulin (PDB ID: 1SA0) (). Two hydrogen bond interactions between the “C = O” & “–O–” functionality of this compound and “–NH–” and phenolic “–OH–” groups of Thr145 & Tyr224 residues in the active site of tubulin (bond distance: 3.10 Å and 2.90 Å, respectively) were observed. Compound 14 also exhibited hydrophobic interactions with Ala12 residue (pi-alkyl type) and electrostatic interactions with Asp98 & Glu183 residues (pi-charge type) in the active site of tubulin protein. Taken together, the favourable binding pattern of flavone 14 within the active site of PARP1, PARP2 and tubulin suggests its prevailing role in dual PARP-tubulin inhibitory activity.
Figure 16. Interaction analysis of 14 with PARP1. (A) Overlay of 14 (yellow) with co-crystallized ligand (red). (B) Orientation of 14 in the active site of PARP1 protein. (C) 3D docked pose of 14 showing hydrogen bond interaction. (D) 2D docked pose of 14 showing hydrogen bond and hydrophobic interactions in the active site of PARP1 protein.
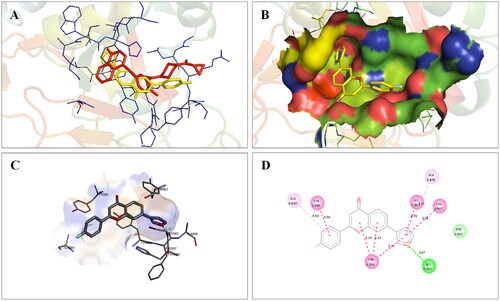
Figure 17. Interaction analysis of 14 with PARP2. (A) Overlay of 14 (yellow) with co-crystallized ligand (pink). (B) Orientation of 14 in the active site PARP2 protein. (C) 3D docked pose of 14 showing hydrogen bond interaction. (D) 2D docked pose of 14 showing hydrogen bond and hydrophobic interactions in the active site of PARP2 protein.
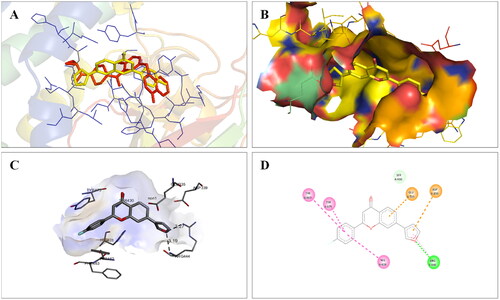
Figure 18. Interaction analysis of 14 with tubulin. (A) Overlay of 14 (yellow) with co-crystallized ligand (pink). (B) Orientation of 14 in the active site of tubulin protein. (C) 3D docked pose of 14 showing hydrogen bond interactions. (D) 2D docked pose of 14 showing hydrogen bond and hydrophobic interactions in the active site of tubulin protein.
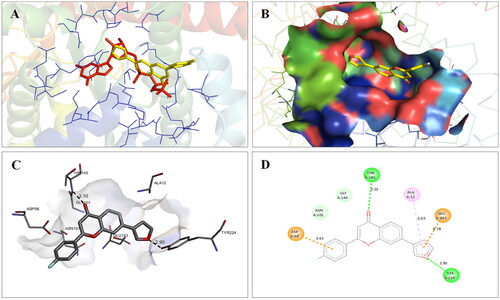
Table 5. Docking score and residues involved in binding interactions of compound 14 with PARP1, PARP2 and tubulin.
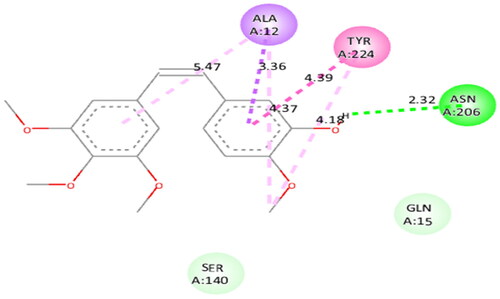
To figure out the similarity in the binding pattern of compound 14 and the standard PARP and tubulin inhibitor, the interaction profile of Olaparib (PARP inhibitor) and Combretastatin (Tubulin inhibitor) was studied. Olaparib (co-crystallized and known ligand of PARP1 and PARP2) was docked with PARP1 and PARP2 proteins (docking score was −11.2 and −11.4 kcal/mol, respectively). Combretastatin A4 (a known inhibitor of tubulin) was docked with tubulin (docking score was −7.6 kcal/mol). Olaparib showed hydrogen bond interactions with Ser904 (bond distance: 2.77 Å), Gly863 (bond distance: 2.81 and 2.92 Å), Arg878 (bond distance: 2.89 Å) and Tyr896 (bond distance: 2.83 Å), hydrophobic interactions with Ala898, Lys903, Tyr907, Tyr896, His862 and Arg878 residues, and halogen interaction with Gly894 residue of PARP1 (. Olaparib showed hydrogen bond interactions with Ser470 (bond distance: 2.74 Å), Gly429 (bond distance: 2.80 and 2.83 Å), Tyr462 (bond distance: 2.88 Å) and Arg444 (bond distance: 3.02 Å), hydrophobic interactions with Ala464, Tyr473, His428, Tyr462 and Arg444 residues, and halogen interaction with Gly460 residue of PARP2 (). Combretastatin A4 showed hydrogen bond interaction with Asn206 residue (bond distance: 2.32 Å), and hydrophobic interactions with Ala12 and Tyr224 residues of tubulin (). Careful observation of the docking results of compound 14 (most active compound), olaparib, and combretastatin revealed that hydrogen bonding as well as hydrophobic interactions with the amino acid residues of PARP1, PARP2, and Tubulin are the crucial interactions for the stabilisation of the compound within the active site.
Figure 19. Docked pose showing binding interactions of olaparib with PARP1.
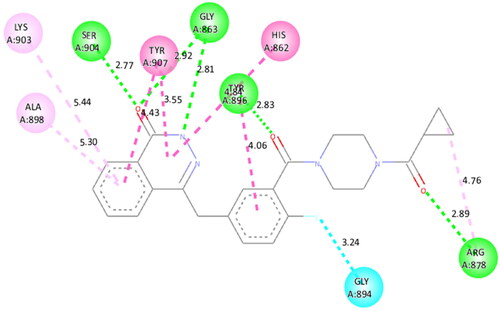
Figure 20. Docked pose showing binding interactions of olaparib with PARP2.
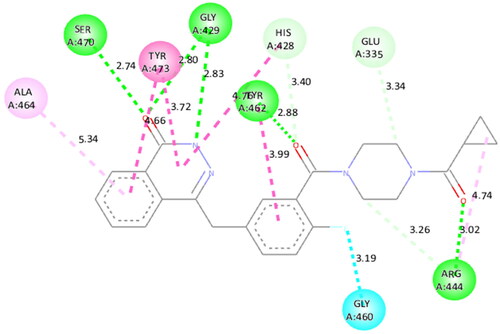
Figure 21. Docked pose showing binding interactions of combretastatin A4 with tubulin.
3.13. ADME (absorption, distribution, metabolism and excretion) study
The results obtained from the ADME study (in silico) revealed that compound 14 possessed good pharmacokinetic parameters for oral bioavailability and drug-likeness () as contrived by Lipinski’s rule of five.
Table 6. ADME parameters of compound 14 predicted using the SwissADME online tool.
4. Conclusion
This study conducted structural engineering of the flavone framework to construct dual PARP-tubulin inhibitors. Structural activity relationship was established that indicated that appendage of a monocyclic heteroaryl arm (position 7, benzopyran framework) and placement of a 4-fluorophenyl ring at position 2 (benzopyran scaffold) resulted in the enhancement of the cell growth inhibitory effects against the Ishikawa cell lines. In-vitro cytotoxicity results led us to identify compound 14 as a potent cell growth inhibitor of the employed human cancer cell lines (Ishikawa cell lines). Results of mechanistic studies indicated that the cytotoxic effects of compound 14 against Ishikawa cell lines were mediated through dual modulation (inhibition) of PARP and Tubulin. Also, flavone 14 demonstrated apoptosis and autophagy-inducing ability as evident from the results of DAPI, rhodamine, acridine orange staining, and DCFDA staining. Western blot experiment also confirmed the ability of compound 14 to induce autophagy as 14 dose-dependently cleaved LC-3 (autophagosome marker). Compound 14 also downregulated the expression level of CDK1 protein. Flow cytometric evaluation of flavone 14 revealed that it caused cell cycle arrest at the G2/M phase. In a nutshell, these outcome of this study presents a promising dual PARP-tubulin inhibitor endowed with efficacy against endometrial cancer.
5. Experimental
5.1. Chemistry
The instruments used for the characterisation of the final compounds are as follows: Bruker DRX-300 and 600 spectrometers (1H and 13C NMR) and JEOL (JMS-700) EI mass spectrometer (HRMS). The purity of the final compounds was determined using Shimadzu LC-2030C (HPLC).
5.1.1. General procedures for the synthesis of compounds 28–32
To a solution of 22 (2.0 gm, 0.009 mol, 1.0 equiv.) in ethanol (50 ml) was added corresponding substituted benzaldehydes 23–27 (0.009 mol, 1.0 equiv.), followed by the dropwise addition of 9 ml of 2.0 M sodium hydroxide aqueous solution (0.018 mol, 2.0 equiv.). The reaction mixture was stirred at room temperature for 24 h and the progress of the reaction was monitored by TLC. After completion of the reaction, the pH of the reaction mixture was neutralised using 3 N HCl. The resulting precipitates were filtered, washed with water, dried and was carried to next step without purification.
5.1.1.1. (E)-1–(4-bromo-2-hydroxyphenyl)-3-(phenyl)prop-2-en-1-one (28)
Yield 94%; 1H NMR (300 MHz, DMSO-d6): δ 8.15 (d, J = 8.4 Hz, 1H), 7.81–8.02 (m, 4H), 7.48–7.50 (m, 4H), 7.27 (d, J = 1.8 Hz, 1H), 7.19–7.23 (m, 1H).
5.1.1.2. (E)-1–(4-bromo-2-hydroxyphenyl)-3–(4-methoxyphenyl)prop-2-en-1-one (29)
Yield 70%; 1H NMR (300 MHz, CD3OD): δ 8.07 (d, J = 8.5 Hz, 1H), 7.95 (d, J = 15.5 Hz, 1H), 7.77–7.810 (m, 3H), 7.20 (d, J = 1.9 Hz, 1H), 7.17 (dd, J = 8.6 and 2.0 Hz, 1H), 7.02–7.05 (m, 2H), 3.90 (s, 3H).
5.1.1.3. (E)-1–(4-bromo-2-hydroxyphenyl)-3–(4-fluorophenyl)prop-2-en-1-one (30)
Yield 73%; 1H NMR (300 MHz, CDCl3) δ 12.95 (s, 1H), 7.94 (d, J = 15.5 Hz, 1H), 7.79 (d, J = 8.6 Hz, 1H), 7.70 (dd, J = 8.7 and 5.4 Hz, 2H), 7.53 (d, J = 15.5 Hz, 1H), 7.27 (d, J = 1.9 Hz, 1H), 7.17 (s, 1H), 7.14 (s, 1H), 7.10–7.13 (m, 1H).
5.1.1.4. (E)-1–(4-bromo-2-hydroxyphenyl)-3–(4-nitrophenyl)prop-2-en-1-one (31)
Yield 75%; 1H NMR (300 MHz, DMSO-d6): δ 8.29–8.32 (m, 2H), 8.14–8.17 (m, 2H), 8.12 (d, J = 4.5 Hz, 1H), 8.09 (d, J = 2.6 Hz, 1H), 7.88 (d, J = 15.7 Hz, 1H), 7.28 (d, J = 2.0 Hz, 1H), 7.23 (dd, J = 8.5 and 2.0 Hz, 1H).
5.1.1.5. (E)-1–(4-bromo-2-hydroxyphenyl)-3–(3,4,5-trimethoxyphenyl)prop-2-en-1-one (32)
Yield 92%; 1H NMR (300 MHz, CDCl3): δ 13.01 (S, 1H), 7.89 (d, J = 15.6 Hz, 1H), 7.81 (d, J = 18.7 Hz, 1H), 7.47 (d, J = 15.3 Hz, 1H), 7.26 (d, J = 2.1 Hz, 1H), 7.12 (dd, J = 8.4 and 2.1 Hz, 1H), 6.91 (s, 2H), 3.97 (s, 6H), 3.95 (s, 3H).
5.1.2. General procedures for the synthesis of compounds 33–37
To a solution of corresponding substituted chalcone intermediates 28–32 (0.006 mol, 1.0 equiv) in DMSO (20 ml) was added iodine pellets (0.0006 mol, 0.1 equiv.), and the reaction mixture was refluxed for 24 h and progress of the reaction was monitored by TLC. After completion of the reaction, sodium thiosulphate solution (50 ml) was added in the reaction mixture and the compound was precipitated. The resulting precipitates were filtered, washed with water, dried and was carried to next step without purification.
5.1.2.1. 7-bromo-2-phenyl-4H-chromen-4-one (33)
Yield 90%; 1H NMR (300 MHz, CDCl3): δ 8.13 (d, J = 8.5 Hz, 1H), 7.93–7.96 (m, 2H), 7.83 (d, J = 1.8 Hz, 1H), 7.55–7.61 (m, 4H), 6.86 (s, 1H).
5.1.2.2. 7-bromo-2–(4-methoxyphenyl)-4H-chromen-4-one (34)
Yield 81%; 1H NMR (300 MHz, CDCl3): δ 8.13 (d, J = 8.3 Hz, 1H), 7.92 (s, 1H), 7.89 (s, 1H), 7.82 (s, 1H), 7.58 (d, J = 8.4 Hz, 1H), 7.07 (d, J = 8.7 Hz, 2H), 6.86 (s, 1H), 3.94 (s, 3H).
5.1.2.3. 7-bromo-2–(4-fluorophenyl)-4H-chromen-4-one (35)
Yield 78%; 1H NMR (300 MHz, CDCl3): δ 8.12 (d, J = 8.4 Hz, 1H), 7.92–7.96 (m, 2H), 7.81 (d, J = 1.8 Hz, 1H), 7.59 (dd, J = 8.4 and 1.8 Hz, 1H), 7.23–7.29 (m, 2H), 6.79 (s, 1H).
5.1.2.4. 7-bromo-2–(4-nitrophenyl)-4H-chromen-4-one (36)
Yield 72%; 1H NMR (300 MHz, DMSO-d6): 8.18–8.25 (m, 3H), 7.98 (d, J = 8.4 Hz, 1H), 7.72 (d, J = 1.8 Hz, 1H), 7.46 (t, J = 9 Hz, 2H), 7.11 (s, 1H).
7-bromo-2–(3,4,5-trimethoxyphenyl)-4H-chromen-4-one (37)
Yield 80%; %. 1H NMR (300 MHz, CDCl3): δ 8.12 (d, J = 8.6 Hz, 1H), 7.84 (d, J = 1.7 Hz, 1H), 7.59 (dd, J = 8.5 and 1.7 Hz, 1H), 7.14 (s, 2H), 6.80 (s, 1H), 4.00 (s, 6H), 3.97 (s, 3H).
5.1.3. General procedures for the synthesis of compounds 1–21
To a solution of corresponding cyclic bromo flavone intermediates 33–37 (0.0014 mol, 1.0 equiv.) in dioxane (18 ml), was added corresponding aryl boronic acid (0.0015 mol, 1.1 equiv.), tetrakis (triphenylphosphine)palladium(0) (0.00014 mol, 0.1 equiv.) and sodium carbonate (0.0042 mol, 3 equiv.), and the reaction mixture was refluxed for 2 h. After completion of the reaction (TLC), the reaction mixture was passed through celite. To the filtrate, water (100 ml) was added and the extraction was done with ethyl acetate (50 ml × 3). The combined organic layer was dried over anhydrous magnesium sulphate and concentrated under reduced pressure and the residue was further purified by performing silica gel column chromatography (ethyl acetate: n-hexane: 1:5 to 1:1) to give compounds 1–21.
5.1.3.1. 2,7-diphenyl-4H-chromen-4-one (1)
Percentage yield: 36%; HPLC purity: 99.31%; mp: 153–157 °C; 1H NMR (300 MHz, DMSO-d6) δ 8.13–8.20 (m, 4H), 7.85–7.91 (m, 3H), 7.48–7.66 (m, 6H), 7.10 (s, 1H). 13C NMR (600 MHz, DMSO-d6): δ 177.45, 163.27, 156.61, 146.32, 138.48, 132.34, 131.52, 129.66, 129.59, 129.35, 127.64, 126.83, 125.90, 124.51, 122.58, 116.51, 107.44. HRMS (ESI) for C21H15O2 [M + H+]: calcd; 299.1072 found, 299.1141.
5.1.3.2. 7-(Furan-3-yl)-2-phenyl-4H-chromen-4-one (2)
Percentage yield: 39%; HPLC purity: 98.89%. mp: 163–167 °C; 1H NMR (600 MHz, DMSO-d6): δ 8.41 (s, 1H), 8.08 (d, J = 6.6 Hz, 2H), 7.99–8.01 (m, 2H), 7.79 (s, 1H), 7.74 (d, J = 7.8 Hz, 1H), 7.55–7.60 (m, 3H), 7.12 (s, 1H), 6.97 (s, 1H). 13C NMR (600 MHz, DMSO-d6): δ 177.27, 163.11, 156.79, 145.36, 141.95, 138.53, 132.31, 131.57, 129.59, 126.77, 125.81, 125.05, 123.44, 122.20, 114.89, 109.13, 107.45. HRMS (ESI) for C19H13O3 [M + H+]: calcd; 289.0865 found, 289.1003.
5.1.3.3. 2-phenyl-7-(thiophen-2-yl)-4H-chromen-4-one (3)
Percentage yield: 28%; HPLC purity: 98.27%; mp: 186–189 °C; 1H NMR (300 MHz, DMSO-d6): δ 8.16–8.19 (m, 2H), 8.12 (d, J = 1.8 Hz, 1H), 8.08 (d, J = 8.4 Hz, 1H), 7.84–7.86 (m, 2H), 7.76 (dd, J = 5.1 and 1.2 Hz, 1H), 7.61–7.66 (m, 3H), 7.25–7.28 (m, 1H), 7.07 (s, 1H). 13C NMR (600 MHz, DMSO-d6): δ 177.16, 163.22, 156.69, 141.57, 139.73, 132.35, 131.46, 129.58, 129.46, 128.65, 126.84, 126.24, 123.18, 122.45, 114.53, 107.46. HRMS (ESI) for C19H13O2S [M + H+]: calcd; 305.0636 found, 305.0672.
5.1.3.4. 7–(2,3-dihydrobenzo[b][1,4]dioxin-6-yl)-2-phenyl-4H-chromen-4-one (4)
Percentage yield: 39%; HPLC purity: 97.00%; mp: 181–184 °C; 1H NMR (300 MHz, DMSO-d6): δ 8.16–8.19 (m, 2H), 8.06–8.09 (m, 2H), 7.79 (dd, J = 8.4 and 1.8 Hz, 1H), 7.60–7.65 (m, 3H), 7.41 (d, J = 2.1 Hz, 1H), 7.36–7.39 (m, 1H), 7.07 (s, 1H), 7.03 (d, J = 8.4 Hz, 1H), 4.33 (s, 4H). 13C NMR (600 MHz, DMSO-d6): δ 177.43, 163.17, 156.66, 145.72, 144.78, 144.30, 132.32, 131.59, 131.55, 129.58, 126.82, 125.76, 124.06, 122.15, 120.63, 118.20, 116.14, 115.76, 107.37, 64.72, 64.56. HRMS (ESI) for C23H17O4 [M + H+]: calcd; 357.1127 found, 357.1059.
5.1.3.5. 2-phenyl-7-(quinolin-6-yl)-4H-chromen-4-one (5)
Percentage yield: 20%; HPLC purity: 95.85%; mp: 136–140 °C; 1H NMR (600 MHz, DMSO-d6): δ 8.15 (d, J = 7.2 Hz, 2H), 8.06–8.09 (m, 3H), 7.86 (d, J = 7.8 Hz, 1H), 7.59–7.61 (m, 5H), 7.54 (d, J = 8.4 Hz, 1H), 7.42 (s,1H), 7.02 (s, 1H), 6.55 (s, 1H). 13C NMR (600 MHz, DMSO-d6): δ 177.44, 163.34, 156.65, 151.75, 147.96, 145.37, 137.15, 136.31, 133.23, 132.55, 131.94, 131.87, 131.51, 130.17, 129.61, 129.26, 129.18, 128.95, 127.23, 126.85, 126.05, 124.78, 122.61, 117.05, 107.52. HRMS (ESI) for C24H16NO2 [M + H+]: calcd; 350.1181 found, 350.1187.
5.1.3.6. 7-(1H-indol-5-yl)-2-phenyl-4H-chromen-4-one (6)
Percentage yield: 35%; HPLC purity: 97.41%; mp: 246–249 °C; 1H NMR (600 MHz, DMSO-d6): δ 11.23 (s, 1H), 8.13 (d, J = 7.2 Hz, 2H), 8.07 (s, 1H), 8.04 (d, J = 10.2 Hz, 1H), 7.84 (d, J = 8.4 Hz, 1H), 7.56–7.58 (m, 5H), 7.52 (d, J = 4.2 Hz, 1H), 7.39 (s, 1H), 6.99 (s, 1H), 6.52 (s, 1H). 13C NMR (600 MHz, DMSO-d6): δ 177.53, 163.11, 156.77, 148.24, 136.70, 132.28, 131.94, 131.65, 129.60, 129.47, 128.78, 127.03, 126.82, 125.68, 124.54, 121.66, 120.94, 119.58, 115.78, 112.59, 107.36, 102.39. HRMS (ESI) for C23H16NO2 [M + H+]: calcd; 338.1181 found, 338.3465.
5.1.3.7. 2–(4-methoxyphenyl)-7-phenyl-4H-chromen-4-one (7)
Percentage yield: 29%; HPLC purity: 96.04%; mp: 172–175 °C; 1H NMR (300 MHz, CDCl3): δ 8.32 (dd, J = 8.2 and 0.4 Hz, 1H), 7.93–7.98 (m, 2H), 7.81 (dd, J = 1.5 and 0.3 Hz, 1H), 7.67–7.75 (m, 3H), 7.46–7.57 (m, 3H), 7.05–7.10 (m, 2H), 6.81 (s, 1H), 3.94 (s, 3H). 13C NMR (600 MHz, DMSO-d6): δ 177.29, 163.36, 162.66, 156.54, 146.14, 138.55, 129.66, 129.31, 128.74, 127.64, 125.86, 124.38, 123.64, 122.57, 116.43, 115.04, 105.94, 55.99. HRMS (ESI) for C22H17O3 [M + H+]: calcd; 329.1178 found, 329.1207.
5.1.3.8. 7-(Furan-3-yl)-2–(4-methoxyphenyl)-4H-chromen-4-one (8)
Percentage yield: 19%; HPLC purity: 98.43%; mp: 173–176 °C; 1H NMR (300 MHz, CD3OD): δ 8.21–8.22 (m, 1H), 8.16 (d, J = 8.3 Hz, 1H), 8.05–8.10 (m, 2H), 7.94 (d, J = 1.6 Hz, 1H), 7.75 (dd, J = 8.3 and 1.5 Hz, 1H), 7.69 (t, J = 1.8 Hz, 1H), 7.13–7.18 (m, 2H), 7.03 (dd, J = 2.0 and 0.9 Hz, 1H), 6.86 (s, 1H), 3.94 (s, 3H). 13C NMR (600 MHz, CDCl3): δ 177.97, 163.39, 162.40, 156.67, 144.31, 140.00, 138.09, 127.96, 126.18, 125.24, 124.01, 122.85, 122.48, 114.46, 114.28, 108.60, 106.28, 55.48. HRMS (ESI) for C20H15O4 [M + H+]: calcd; 319.0970 found, 319.1064.
5.1.3.9. 2–(4-methoxyphenyl)-7-(thiophen-2-yl)-4H-chromen-4-one (9)
Percentage yield: 26%; HPLC purity − 97.78%; mp: 180–184 °C; 1H NMR (300 MHz, CD3OD): δ 7.30 (d, J = 8.7 Hz, 1H), 7.19–7.22 (m, 2H), 7.13 (d, J = 1.8 Hz, 1H), 6.95 (dd, J = 8.4 and 1.8 Hz, 1H), 6.86 (dd, J = 3.7 and 1.1 Hz, 1H), 6.74 (dd, J = 3.6 and 0.9 Hz, 1H), 6.36 (dd, J = 5.1 and 3.7 Hz, 1H), 6.27–6.30 (m, 2H), 5.99 (s, 1H), 3.07 (s, 3H). 13C NMR (600 MHz, CDCl3): δ 177.88, 163.50, 162.44, 156.60, 142.23, 139.64, 128.46, 128.00, 126.91, 126.33, 125.14, 123.97, 122.79, 122.66, 114.48, 114.20, 106.34, 55.49. HRMS (ESI) for C20H15O3S [M + H+]: calcd; 335.0742 found, 335.0750.
5.1.3.10. 7–(2,3-dihydrobenzo[b][1,4]dioxin-6-yl)-2–(4-methoxyphenyl)-4H-chromen-4-one (10)
Percentage yield: 36%; HPLC purity: 97.65%; mp: 183–186 °C; 1H NMR (300 MHz, DMSO-d6): δ 8.14 (d, J = 9 Hz, 2H), 8.04–8.07 (m, 2H), 7.78 (dd, J = 8.4 and 1.8 Hz, 1H), 7.35–7.41 (m, 2H), 7.16 (d, J = 9.1 Hz, 2H), 7.03 (d, J = 8.3 Hz, 1H), 6.97 (s, 1H), 4.33 (s, 4H), 3.89 (s, 3H). 13C NMR (600 MHz, DMSO-d6): δ 177.22, 163.22, 162.63, 156.57, 145.52, 144.75, 144.31, 131.67, 128.70, 125.70, 123.91, 123.70, 122.16, 120.62, 118.20, 116.14, 115.71, 115.02, 105.90, 64.72, 64.56, 55.99. HRMS (ESI) for C24H19O5 [M + H+]: calcd; 387.1232 found, 387.1231.
5.1.3.11. 2–(4-methoxyphenyl)-7-(quinolin-6-yl)-4H-chromen-4-one (11)
Percentage yield: 20%; HPLC purity: 95.76%; mp: 221–224 °C; 1H NMR (300 MHz, DMSO-d6): δ8.95 (s, 1H), 8.30 (d, J = 8.04, 1H), 8.24 (t, J = 8.8 Hz, 2H), 8.11 (s, 1H), 8.03 (d, J = 8.3 Hz, 1H), 7.90 (d, J = 8.2 Hz, 2H), 7.86 (s, 1H), 7.75 (d, J = 7.9 Hz, 1H), 7.46–7.48 (m, 1H), 7.02 (d, J = 8.4 Hz, 2H), 6.76 (s, 1H), 3.88 (s, 3H). 13C NMR (600 MHz, CDCl3): δ 178.06, 163.63, 162.50, 156.56, 150.89, 147.90, 145.67, 137.38, 136.61, 130.23, 128.84, 128.41, 128.02, 126.38, 124.34, 123.93, 123.00, 121.83, 116.45, 114.51, 106.38, 55.50. HRMS (ESI) for C25H18NO3 [M + H+]: calcd; 380.1287 found, 380.1347.
5.1.3.12. 7-(1H-indol-5-yl)-2–(4-methoxyphenyl)-4H-chromen-4-one (12)
Percentage yield: 23%; HPLC purity: 97.35%; mp: 129–132 °C; 1H NMR (300 MHz, CDCl3) δ 8.36 (s, 1H), 8.30 (d, J = 8.4 Hz, 1H), 8.03 (t, J = 0.9 Hz, 1H), 7.98 (t, J = 3 Hz, 1H), 7.95 (t, J = 3 Hz, 1H), 7.85 (d, J = 1.5 Hz, 1H), 7.77 (dd, J = 8.4 and 1.8 Hz, 1H), 7.54–7.61 (m, 2H), 7.33 (t, J = 3.3 Hz, 1H), 7.05–7.10 (m, 2H), 6.80 (s, 1H), 6.68–6.70 (m, 1H), 3.94 (s, 3H); 13C NMR (600 MHz, CDCl3): δ 178.45, 163.44, 162.34, 156.67, 148.30, 136.02, 132.10, 132.04, 131.97, 128.54, 128.52, 128.46, 127.99, 125.83, 125.34, 124.49, 121.68, 119.83, 115.70, 114.45, 111.62, 106.26, 103.23, 55.49. HRMS (ESI) for C24H18NO3 [M + H+]: calcd; 368.1287 found, 368.1288.
5.1.3.13. 2–(4-fluorophenyl)-7-phenyl-4H-chromen-4-one (13)
Percentage yield: 30%; HPLC purity: 98.50%; mp: 193–196 °C; 1H NMR (600 MHz, CDCl3): δ 8.27 (d, J = 8.4 Hz, 1H), 7.93–7.96 (m, 2H), 7.76 (d, J = 1.2 Hz, 1H), 7.65–7.69 (m, 3H), 7.50 (t, J = 7.8 Hz, 2H), 7.44 (m, 1H), 7.20–7.24 (m, 2H), 6.78 (s, 1H). 13C NMR (600 MHz, CDCl3): δ 178.13, 165.61, 163.93, 162.55, 156.55, 147.07, 139.11, 129.10, 128.72, 128.53, 128.47, 128.03, 128.01, 127.36, 126.19, 124.46, 122.58, 116.38, 116.24, 116.02, 107.52. 111.20. HRMS (ESI) for C21H13FO2 [M + H+]: calcd; 317.0900 found, 317.0994.
5.1.3.14. 2–(4-fluorophenyl)-7-(furan-3-yl)-4H-chromen-4-one (14)
Percentage yield: 28%; HPLC purity: 98.07%; mp: 215–218 °C; 1HNMR (600 MHz, DMSO-d6): δ 8.42 (s, 1H), 8.15 (dd, J = 8.4 and 5.4 Hz, 2H), 8.02 (s, 1H), 7.99 (d, J = 8.4 Hz, 1H), 7.80 (s, 1H), 7.75 (d, J = 8.4 Hz, 1H), 7.41 (t, J = 8.7 Hz, 2H), 7.12 (s, 1H), 6.98 (s, 1H). 13C NMR (600 MHz, DMSO-d6): δ 177.17, 165.44, 163.78, 162.15, 156.75, 145.39, 141.97, 138.53, 129.49, 129.43, 128.17, 125.80, 125.05, 123.45, 122.13, 116.77, 116.63, 114.89, 109.12, 107.41. HRMS (ESI) for C19H12FO3 [M + H+]: calcd; 307.0770 found, 307.0858.
5.1.3.15. 2–(4-fluorophenyl)-7-(thiophen-2-yl)-4H-chromen-4-one (15)
Percentage yield: 49%; HPLC purity: 96.74%; mp: 202–205 °C; 1H NMR (300 MHz, DMSO-d6): δ 8.22–8.27 (m, 2H), 8.12 (d, J = 1.5 Hz, 1H), 8.07 (d, J = 7.8 Hz, 1H), 7.83–7.84 (m, 1H), 7.81 (d, J = 1.5 Hz, 1H), 7.76 (dd, J = 5.1 and 1.2 Hz, 1H), 7.46 (t, J = 8.9 Hz, 2H), 7.26 (dd, J = 5.1 and 3.7 Hz, 1H), 7.06 (s, 1H). 13C NMR (600 MHz, DMSO-d6): δ 177.13, 165.48, 163.82, 162.32, 156.66, 141.55, 139.75, 129.61, 129.48, 128.68, 128.05, 126.85, 126.24, 123.22, 122.35, 116.76, 116.61, 114.54, 107.36. HRMS (ESI) for C19H12FO2S [M + H+]: calcd; 323.0542 found, 323.0586.
5.1.3.16. 7–(2,3-dihydrobenzo[b][1,4]dioxin-6-yl)-2–(4-fluorophenyl)-4H-chromen-4-one (16)
Percentage yield: 63%; HPLC purity: 98.13%; mp: 193–196 °C; 1H NMR (300 MHz, DMSO-d6): δ 8.22–8.27 (m, 2H), 8.05–8.08 (m, 2H), 7.79 (dd, J = 8.1 and 1.5 Hz, 1H), 7.40–7.50 (m, 2H), 7.35–7.39 (m, 2H), 7.06 (s, 1H), 7.03 (d, J = 8.1 Hz, 1H), 4.33 (s, 4H). 13C NMR (600 MHz, DMSO-d6): δ 177.34, 165.45, 163.79, 162.19, 156.59, 145.70, 144.78, 144.30, 131.57, 129.53, 129.47, 128.15, 125.73, 124.05, 122.06, 120.61, 118.20, 116.74, 116.59, 116.13, 115.75, 107.29, 64.72, 64.56. HRMS (ESI) for C23H16FO4 [M + H+]: calcd; 375.1033 found, 375.1026.
5.1.3.17. 2–(4-fluorophenyl)-7-(quinolin-6-yl)-4H-chromen-4-one (17)
Percentage yield: 33%; HPLC purity: 95.15%; mp: 236–240 °C; 1H NMR (600 MHz, acetone): δ 8.50 (dd, J = 4.2 and 1.8 Hz, 1H), 8.08 (d, J = 1.8 Hz, 1H), 8.03 (d, J = 7.2 Hz, 1H), 7.86 (d, J = 1.2 Hz, 1H), 7.78–7.82 (m, 3H), 7.71 (dd, J = 8.4 and 3.0 Hz, 2H), 7.56 (dd, J = 8.3 and 1.7 Hz, 1H), 7.16 (dd, J = 8.2 and 4.1 Hz, 1H), 7.01 (t, J = 8.9 Hz, 2H), 6.63 (s, 1H). 13C NMR (600 MHz, acetone) δ 176.87, 163.42, 161.90, 156.21, 151.36, 147.62, 144.96, 136.65, 135.87, 129.82, 129.65, 129.16, 129.10, 128.49, 128.12, 126.84, 125.61, 124.37, 122.39, 122.19, 116.68, 116.37, 116.23, 107.09. HRMS (ESI) for C24H15FNO2 [M + H+]: calcd; 368.1087 found, 368.0993.
5.1.3.18. 2–(4-fluorophenyl)-7-(1H-indol-5-yl)-4H-chromen-4-one (18)
Percentage yield: 50%; HPLC purity: 95.15%; mp: 229–232 °C; 1H NMR (300 MHz, DMSO-d6): δ 11.29 (s, 1H), 8.26 (dd, J = 9.1 and 5.4 Hz, 2H), 8.05–8.14 (m, 3H), 7.88 (dd, J = 8.4 and 1.7 Hz, 1H), 7.61 (dd, J = 8.6 and 1.7 Hz, 1H), 7.56 (d, J = 8.6 Hz, 1H), 7.42–7.51 (m, 3H), 7.05 (s, 1H), 6.57 (s, 1H). 13C NMR (600 MHz, DMSO-d6): δ 177.47, 165.43, 163.77, 162.16, 156.71, 148.24, 136.69, 129.54, 129.48, 129.46, 128.77, 127.03, 125.66, 124.54, 121.56, 120.93, 119.57, 116.75, 116.60, 115.76, 112.58, 107.27, 102.38. HRMS (ESI) for C23H15FNO2 [M + H+]: calcd; 356.1087 found, 356.1098.
5.1.3.19. 7-(1H-indol-5-yl)-2–(4-nitrophenyl)-4H-chromen-4-one (19)
Percentage yield: 23%; HPLC purity: 96.08%; mp: 255–258 °C; 1H NMR (600 MHz, DMSO-d6): δ 11.23 (s, 1H), 8.35–8.39 (m, 4H), 8.06 (dd, J = 18.6 and 10.2 Hz, 3H), 7.86 (d, J = 8.4 Hz, 1H), 7.57 (dd, J = 8.4 and 1.8 Hz, 1H), 7.52 (d, J = 9 Hz, 1H), 7.38–7.39 (m, 1H), 7.17 (s, 1H), 6.52–6.53 (m, 1H). 13C NMR (600 MHz, DMSO-d6): δ 177.49, 160.68, 156.76, 149.47, 148.56, 137.64, 136.74, 129.33, 128.78, 128.21, 127.06, 125.73, 124.80, 124.52, 121.62, 120.93, 119.62, 115.81, 112.62, 109.60, 102.42, 60.25, 21.17, 14.49. HRMS (ESI) for C23H15N2O4 [M + H+]: calcd; 383.1032 found, 383.1032.
5.1.3.20. 7-(Quinolin-6-yl)-2–(3,4,5-trimethoxyphenyl)-4H-chromen-4-one (20)
Percentage yield: 26%; HPLC purity: 98.92%. mp: 214–217 °C; 1H NMR (300 MHz, DMSO-d6): δ 8.99 (dd, J = 4.2 and 1.8 Hz, 1H), 8.50–8.55 (m, 2H), 8.38 (d, J = 1.5 Hz, 1H), 8.29 (dd, J = 8.8 and 2.1 Hz, 1H), 8.17–8.21 (m, 2H), 8.02 (dd, J = 8.3 and 1.7 Hz, 1H), 7.64 (dd, J = 8.3 and 4.2 Hz, 1H), 7.47 (s, 2H), 7.23 (s, 1H), 3.97 (s, 6H), 3.79 (s, 3H). 13C NMR (600 MHz, CDCl3): δ 178.05, 163.48, 156.58, 153.62, 151.11, 148.11, 145.98, 141.37, 137.22,136.43, 130.41, 128.74, 128.39, 126.88, 126.44, 126.42, 124.58, 122.94, 121.87, 116.53, 107.58, 103.82, 61.04, 56.39. HRMS (ESI) for C27H22NO5 [M + H+]: calcd; 440.1498 found, 440.1588.
5.1.3.21. 7-(1H-indol-5-yl)-2–(3,4,5-trimethoxyphenyl)-4H-chromen-4-one (21)
Percentage yield: 22%; HPLC purity: 95.09%; mp: 246–250 °C; 1H NMR (300 MHz, DMSO-d6): δ 11.30 (s, 1H), 8.19 (d, J = 1.5 Hz, 1H), 8.08–8.11 (m, 2H), 7.88 (dd, J = 8.4 and 1.5 Hz, 1H), 7.61–7.64 (m, 1H), 7.56 (d, J = 8.4 Hz, 2H), 7.47 (s, 2H), 7.18 (s, 1H), 6.57 (s, 1H), 3.96 (s, 6H), 3.78 (s, 3H). 13C NMR (600 MHz, DMSO-d6): δ 177.54, 162.84, 156.71, 153.71, 148.10, 141.01, 136.68, 129.50, 128.75, 127.02, 126.95, 125.59, 124.45, 121.60, 120.98, 119.55, 115.91, 112.54, 107.22, 104.51, 102.36, 60.68, 56.77. HRMS (ESI) for C26H22NO5 [M + H+]: calcd; 428.1498 found, 428.1456.
5.2. Cell culture
Ishikawa cells (a human endometrial carcinoma of the epithelial cell) were kindly gifted by Dr. Geetanjali Sachdeva and Dr. Uddhav Chaudhari of National Institute for Research In Reproductive and Child Health (NIRRCH), Mumbai. They had procured the cells from Sigma‐Aldrich (St. Louis, MO) (cat #99040201). The cells were maintained in RPMI medium supplemented with 10% Foetal bovine serum (FBS) and 100 IU/mL penicillin. The cell lines were maintained under standard cell culture conditions at 37 °C and 5% CO2 in a humidified environment.
5.3. Cell viability assay
Mitochondrial activity was evaluated by MTT assay.Citation59 This assay is based on enzymatic reduction of the yellow-colored MTT dye to purple-colored formazan crystals by a variety of mitochondrial and cytosolic enzymes that are operational in viable cells. Briefly, ISHIKAWA (3000 cells/well) were seeded in 100 µL of medium into a 96-well plate and left to settle in a CO2 incubator. The test compound 14 was added in each well (100 μL/well) with different concentrations and the plate was incubated for 48 h. Four hours before the end of the incubation period, 20 μL of MTT solution (2.5 mg/mL in PBS) was added to each well and re-incubated for 4 h at 37 °C. Then 150 μL of DMSO was added to each well to dissolve the formazan crystals. The optical density (OD) of each well was recorded using a microplate reader at a wavelength of 570 nm. The percentages of cell viability and growth inhibition were calculated according to the following equations. Cell viability (%) = [(OD of treated cells-OD of blank)/(OD of control-OD of blank) ×100].
5.4. Identification of nuclear and cellular morphology
Ishikawa was treated with compounds 14 at concentrations of 0.1, 0.5, and 1 μM for 24 h. Briefly, cells were collected, washed twice with PBS, and fixed with methanol: acetic acid (3:1 ratio v/v). The next day, cells were washed and dispensed in 50 μL of fixing solution. Cells were then spread on clean slides, and exposed to DAPI solution (4′,6-diamidino-2-phenylindole(DAPI) (CAS Number: 28718–90-3) (5 μg/mL in 0.01 M citric acid and 0.45 M disodium phosphate containing 0.05% Tween 20) for 30 min at room temperature. The slides were then rinsed with distilled water for 10 min, and washed with PBS. After drying, the slides were mounted with glycerol: PBS (1:1 ratio v/v) and observed under the fluorescent microscope to figure out any nuclear morphological changes that occur during apoptosis.Citation60
5.5. Measurement of mitochondrial membrane potential
Rhodamine staining was employed to investigate apoptosis induced by compound 14 in Ishikawa cells. Under physiological conditions, rhodamine dyes are known to accumulate within active and polarised mitochondria, resulting in robust fluorescence signals. However, when the mitochondrial transmembrane potential is compromised the dyes fail to accumulate within the mitochondria, leading to a decline in rhodamine fluorescence intensity. The Rhodamine staining protocol followed was as follows: Ishikawa cells were treated at 0.1, 0.5, and 1 μM for 24 h, and RH-123 (1 μg) (Cat No. R8004) was added 30 min before the termination of the experiment and then washed with PBS before analysis on a fluorescence microscope.Citation61
5.6. Acridine orange staining
The Autophagy induction ability of compound 14 was assessed by acridine orange staining which is used to measure the autophagic acidic vesicular organnelles. Ishikawa cell were seeded in a six-well plate and treated with compound 14 for 48 h. Incubation of the cells was done with 1 mg/mL Acridine orange (Cat no. A9231) before the termination of the experiment. Cells were then washed with PBS and then analysed with a fluorescence microscope. In untreated or basal conditions, the cells exhibited predominantly green fluorescence, indicating a neutral pH environment within the cytoplasm. However, upon induction of autophagy, an increase in red fluorescence was observed, suggesting the presence of acidic compartments, such as autophagosomes and lysosomes. A9231.
5.7. Measurement of ROS
Dichlorodihydrofluorescin diacetate (DCFHDA) is a fluorogenic dye that measures hydroxyl, peroxyl, and other reactive oxygen species (ROS) activity within the cell. The oxidative conversion of DCFH-DA to DCF (2′, 7′ -dichlorofluorescein) leads to the detection of intracellular ROS. As such, an increase in intracellular ROS is indicative of apoptosis in cancer cells Ishikawa cells were treated with compound-14 at 100, 500, and 1000 nM concentrations for 24 h. After 24h cells were stained with DCFHDA (20 µM) (Cat no, 287810) for 45 min. After 45 min, cells were washed with PBS buffer and analysed with a fluorescence microscope. Low green Fluorescence was observed in untreated control cells while bright green fluorescence was observed with treated cells.Citation61
5.8. Preparation of cell lysate and Western blotting
Ishikawa cells were treated with compound-14 at 100, 500, and 1000 nM concentrations for 24 h. After 24h cells were collected and centrifuged at 400 g, washed in PBS and cell pellets were lysed in RIPA buffer in preparation of the whole cell lysate. Supernatants were collected and proteins were estimated using the Bradford reagent. An equal amount of protein (60–80 µg) was loaded into each well for SDS-PAGE. Blocking was done with 5% BSA at room temperature with shaking for 2 h. After the SDS page run was completed, we washed the PVDF membrane and then blocking was done. Blots were incubated with different primary antibodies(1:1000 dilutions), and secondary antibodies (1:10 000 dilutions) and chemiluminescence was captured on Chemidoc after incubating the blots in ECL plus solution.
Primary Antibodies: LC3B Antibody (Cell signalling Technology, Cat No:2775), Cyclin B1 (Cell signalling Technology, Cat No:4138), SKP-2 (Cell signalling Technology, Cat No:4358), CDK1 (Abcam, Anti-CDK1 antibody [A17]), cdc25c (Cell signalling Technology, Cat No:4688); internal control: Actin (Sigma Aldrich, Cat No: A5441);
Secondary antibodies: Anti-mouse IgG, HRP-linked Antibody #7076, Cell signalling Technology, Dilution 1:10 000 and Anti-rabbit IgG, HRP-linked Antibody #7074, Cell signalling Technology, Dilution 1:10 000.
5.9. PARP inhibitory assay
Enzyme inhibition assays were performed by the Reaction Biology Corporation, Malvern, PA. (http://www.reactionbiology.com). PARP enzymatic activity transfers ADP-ribose from NAD + substrate into the PAR chain on histone substrate. PARP enzymatic activity transfers ADP-ribose from NAD + substrate into the PAR chain on histone substrate. The compounds were tested in a 10-dose IC50 singlet with a 3-fold serial dilution starting at 10 uM against 2 PARPs. Control compound, Veliparib (ABT-888) and olaparib was tested in a 10-dose IC50 with a 3-fold serial dilution starting at 0.1 uM. Raw data in data tabs represent luminescence signals corresponding to the amount of NAD + utilised in the enzymatic reaction. The control compound, Veliparib (ABT-888), was tested in a 10-dose IC50 with a 3-fold serial dilution starting at 0.1 uM. The substrates used were: Activated DNA, 10 µg/mL; NAD+ (Nicotinamide Adenine Dinucleotide), 500 nM; Protein substrate for PARP1, core histones from chicken, 10 µg/mL; protein substrate for PARP2, 5 µM.
5.10. In vitro microtubule assembly assay
The assay was performed using the tubulin polymerisation kit (BK006P,Cytoskeleton). Pure tubulin (cat. # T240) was equilibrated in 80 mM PIPES, 1 mM EGTA, 1 mM MgCl2, pH 6.8 buffer (BRB80) and centrifuged at 75 000 rpm for 10 min in an TLA-100 rotor in a centrifuge. The tubulin concentration was measured spectrophotometrically at 275 nm (ε = 107.000 M-1 cm-1) and then diluted to 10 μM. The samples were supplemented with 1 mM GTP (cat. #BST05) and the compound 14 at 0.1, 1, 5, 10 μM (or the vehicle, i.e. DMSO). The time course of assembly at 37 °C was detected as turbidity by measuring the absorbance of the samples at 350 nm using a spectrophotometer.
5.11. Docking study
The crystal structures of PARP1, PARP2, and tubulin (with PDB IDs: 5DS3, 4TVJ and 1SA0, respectively) were retrieved from the protein data bank (https://www.rcsb.org).Citation62 All the crystal structures were prepared individually by removing existing ligands, water molecules, unbound ions, and extra chains using the PyMOL molecular graphics tool (Schrödinger, LLC). Thereafter, non-polar hydrogens were merged while polar hydrogens were added to each protein added using AutoDock tools.Citation63 This process was repeated for each protein and then saved into docking-ready PDBQT format. 2-D chemical structures of all the ligands (standards as well as test compounds) were drawn using MarvinSketch 18.5.0 (ChemAxon Ltd.) and converted into 3D conformation (mol2 format) using Frog2 server.Citation64 Polar hydrogens were added while non-polar hydrogens were merged with the carbons and the internal degrees of freedom and torsions were set. The ligand molecules were further saved into the docking-ready PDBQT format using AutoDock tools.Citation63 Docking of the ligands to various protein targets and determination of binding affinities was carried out using AutoDock Vina.Citation65
5.12. Drug-likeness and prediction of ADME
In silico methods for the determination of absorption, distribution, metabolism, and excretion (ADME) parameters depend on theoretically derived statistical models, which have been generated by relating the structural characteristics of compounds that have been measured in a given assay to their biological responses and are now widely used due to its low resource necessity.Citation66 Therefore, test compounds were evaluated for the ADME parameters by using the SwissADME tool.Citation67 and accessed using Lipinski’s rule of 5 for drug-likeness.Citation68
5.13. Cell cycle analysis
Cells were treated with compound 14 (10, 50, 100, 500 and 1000 nM) for 24 h, collected and washed once with PBS. The pellet was then fixed in 70% ethanol overnight, followed by one washing with PBS and incubation with RNAse A for 90 min at 37 °C. Cells were then stained with PI and acquired in FACS. Analysis of the data was done by Modfit software (Verity Software House Inc., Topsham, ME) for the proportions of different cell cycle phases.Citation69
Supplemental Material
Download PDF (4.2 MB)Disclosure statement
The authors declare that they have no known competing financial interests or personal relationships that could have appeared to influence the work reported in this paper.
Additional information
Funding
References
- Nagy JD, Armbruster D. Evolution of uncontrolled proliferation and the angiogenic switch in cancer. Math Biosci Eng. 2012;9(4):843–876.
- Kuo CN, Liao YM, Kuo LN, Tsai HJ, Chang WC, Yen Y. Cancers in Taiwan: practical insight from epidemiology, treatments, biomarkers, and cost. J Formos Med Assoc. 2020; 119(12):1731–1741.
- Soto AM, Sonnenschein C. Environmental causes of cancer: endocrine disruptors as carcinogens. Nat Rev Endocrinol. 2010;6(7):363–370.
- Doll R, Peto R. The causes of cancer: quantitative estimates of avoidable risks of cancer in the United States today. J Natl Cancer Inst. 1981;66(6):1192–1308.
- Trichopoulos D, Li FP, Hunter DJ. What causes cancer? Sci Am. 1996;275(3):80–87.
- Xia C, Dong X, Li H, Cao M, Sun D, He S, Yang F, Yan X, Zhang S, Li N, et al. Cancer statistics in China and United States, 2022: profiles, trends, and determinants. Chin Med J. 2022;135(5):584–590.
- Schwartz MK. Enzymes in cancer. Clin Chem. 1973;19(1):10–22.
- Wen KC, Huang RL, Chen LY, Wu TI, Lu CH, Chu TY, Ou YC, Wu CH, Hsu ST, Ding DC, et al. Endometrial cancer detection using a cervical DNA methylation assay (MPap) in women with abnormal uterine bleeding: a multicenter hospital-based validation study. Cancers. 2022;14(17):4343.
- Voon YC, Omar IS, Wu MH, Said NA, Chung I. Cancer‑associated fibroblasts as cellular vehicles in endometrial cancer cell migration. Oncol Lett. 2022;23(1):1–5.
- Wu CH, Chen HY, Wang CW, Shieh TM, Huang TC, Lin LC, Wang KL, Hsia SM. Isoliquiritigenin induces apoptosis and autophagy and inhibits endometrial cancer growth in mice. Oncotarget. 2016;7(45):73432–73447.
- Mohamed MM, Sloane BF. Multifunctional enzymes in cancer. Nat Rev Cancer. 2006;6(10):764–775.
- Chia-Chi Y, Chieh-Yi K, Hsing-Chun T, Ming-Ting C, Meng-Chen T. Consecutive successful pregnancies after conservative management of early stage endometrial carcinoma. Clin Med Rev Case Rep. 2018;5:233.
- Yeh CC, Su FH, Tzeng CR, Muo CH, Wang WC. Women with adenomyosis are at higher risks of endometrial and thyroid cancers: a population-based historical cohort study. PLOS One. 2018;13(3):e0194011.
- Esteller M. Epigenetics in cancer. N Engl J Med. 2008;358(11):1148–1159.
- Liew PL, Huang RL, Wu TI, Liao CC, Chen CW, Su PH, Wang HC, Weng YC, Lai HC. Combined genetic mutations and DNA-methylated genes as biomarkers for endometrial cancer detection from cervical scrapings. Clin Epigenetics. 2019;11(1):170.
- Huang YJ, Chang CC, Wang YY, Chiang WC, Shih YH, Shieh TM, Wang KL, Ali M, Hsia SM. Adlay testa (Coix lachryma-jobi L. var. ma-yuen Stapf.) ethanolic extract and its active components exert anti-proliferative effects on endometrial cancer cells via cell cycle arrest. Molecules. 2021;26(7):1966.
- Chang CC, Wang HC, Liao YP, Chen YC, Weng YC, Yu MH, Lai HC. The feasibility of detecting endometrial and ovarian cancer using DNA methylation biomarkers in cervical scrapings. J Gynecol Oncol. 2018;29(1):e17.
- Heeke AL, Pishvaian MJ, Lynce F, Xiu J, Brody JR, Chen WJ, Baker TM, Marshall JL, Isaacs C. Prevalence of homologous recombination–related gene mutations across multiple cancer types. JCO Precis Oncol. 2018;2018:1–13.
- Kurnianda J, Setiawan SA. Endometrial cancer after tamoxifen-containing adjuvant treatment for breast cancer. Indones J Cancer Control. 2021;1(2):60–66.
- Chen HY, Chiang YF, Huang CY, Shieh TM, Kao C, Chang FK, Huang TC, Ali M, Chang HY, Hong YH, et al. Spirulina phycocyanin extract and its active components suppress epithelial-mesenchymal transition process in endometrial cancer via targeting TGF-beta1/SMAD4 signaling pathway. Biomed Pharmacother. 2022; 152:113219.
- Huang CY, Liao KW, Chou CH, Shrestha S, Yang CD, Chiew MY, Huang HT, Hong HC, Huang SH, Chang TH, et al. Pilot study to establish a novel five-gene biomarker panel for predicting lymph node metastasis in patients with early stage endometrial cancer. Front Oncol. 2019;9:1508.
- Huang R-L, Su P-H, Liao Y-P, Wu T-I, Hsu Y-T, Lin W-Y, Wang H-C, Weng Y-C, Ou Y-C, Huang TH-M, et al. Integrated epigenomics analysis reveals a DNA methylation panel for endometrial cancer detection using cervical scrapings. Clin Cancer Res. 2017;23(1):263–272.
- Lin CY, Chao A, Wang TH, Hsueh S, Lee YS, Wu TI, Chao AS, Huang HJ, Chou HH, Chang TC, et al. A dual tyrosine kinase inhibitor lapatinib suppresses overexpression of matrix metallopeptidase 1 (MMP1) in endometrial cancer. J Mol Med. 2014;92(9):969–981.
- Concin N, Matias-Guiu X, Vergote I, Cibula D, Mirza MR, Marnitz S, Ledermann J, Bosse T, Chargari C, Fagotti A, et al. ESGO/ESTRO/ESP guidelines for the management of patients with endometrial carcinoma. Gynecol Oncol. 2021;31(1):12–39.
- Nepali K, Sharma S, Sharma M, Bedi P, Dhar K. Rational approaches, design strategies, structure-activity relationship, and mechanistic insights for anticancer hybrids. Eur J Med Chem. 2014;77:422–487.
- Chao MW, Lin TE, HuangFu WC, Chang CD, Tu HJ, Chen LC, Yen SC, Sung TY, Huang WJ, Yang CR, et al. Identification of a dual TAOK1 and MAP4K5 inhibitor using a structure-based virtual screening approach. J Enzyme Inhib Med Chem. 2021;36(1):98–108.
- Satriyo PB, Yeh CT, Chen JH, Aryandono T, Haryana SM, Chao TY. Dual therapeutic strategy targeting tumor cells and tumor microenvironment in triple-negative breast cancer. J Cancer Res Pract. 2020;7(4):139–148.
- Yen SC, Chen LC, Huang HL, HuangFu WC, Chen YY, Lin TE, Lien ST, Tseng HJ, Sung TY, Hsieh JH, et al. Identification of a dual FLT3 and MNK2 inhibitor for acute myeloid leukemia treatment using a structure-based virtual screening approach. Bioorg Chem. 2022; 121:105675.
- Chen L-C, Tseng H-J, Liu C-Y, Huang Y-Y, Yen C-C, Weng J-R, Lu Y-L, Hou W-C, Lin TE, Pan I-H, et al. Design of diarylheptanoid derivatives as dual inhibitors against class IIa histone deacetylase and β-amyloid aggregation. Front Pharmacol. 2018; 9:708.
- Alexandre J, Ray-Coquard I, Joly F. PARP inhibitor in advanced endometrial carcinoma beyond BRCA and related genetic mutations. JCO Precis Oncol. 2020;4(4):1025–1026.
- Senguttuvan RN, Wei C, Raoof M, Dellinger TH, Wang EW. Complete pathologic response to PARP inhibitor Olaparib in a patient with stage IVB recurrent endometrioid endometrial adenocarcinoma. J Clin Med. 2023;12(11):3839.
- You B, Leary A, Rodrigues M, Follana P, Abdeddaim C, Joly F, Bin S, Villeneuve L, Alexandre M, Boutitie F, et al. Abstract CT005: safety and efficacy of olaparib combined to metronomic cyclophosphamide and metformin in recurrent advanced/metastatic endometrial cancer patients: ENDOLA trial. Cancer Res. 2022;82(12 Suppl):CT005.
- Miyasaka A, Oda K, Ikeda Y, Wada-Hiraike O, Kashiyama T, Enomoto A, Hosoya N, Koso T, Fukuda T, Inaba K, et al. Anti-tumor activity of olaparib, a poly (ADP-ribose) polymerase (PARP) inhibitor, in cultured endometrial carcinoma cells. BMC Cancer. 2014;14(1):179.
- Zhang J, Gao Y, Zhang Z, Zhao J, Jia W, Xia C, Wang F, Liu T. Multi-therapies based on PARP inhibition: potential therapeutic approaches for cancer treatment. J Med Chem. 2022;65(24):16099–16127.
- a) Chambon P, Weill J, Mandel P. Nicotinamide mononucleotide activation of a new DNA-dependent polyadenylic acid synthesizing nuclear enzyme. Biochem Biophys Res Commun. 1963;11(1):39–43. b) Lai SW, Bamodu OA, Chen JH, Wu AT, Lee WH, Chao TY, Yeh CT. Targeted PARP inhibition combined with FGFR1 blockade is synthetically lethal to malignant cells in patients with pancreatic cancer. Cells. 2020;9(4):911.
- Benjamin RC, Gill DM. ADP-ribosylation in mammalian cell ghosts. Dependence of poly (ADP-ribose) synthesis on strand breakage in DNA. J Biol Chem. 1980;255(21):10493–10501.
- Demény MA, Virág L. The PARP enzyme family and the hallmarks of cancer part 1. Cell intrinsic hallmarks. Cancers. 2021;13(9):2042.
- Sovak M, Chuai S, Anderson S, Barakat R, Dupont J, Hensley M, Sabbatini P, Spriggs D, Aghajanian C. Paclitaxel and carboplatin (TP) for treatment of advanced or recurrent endometrial cancer: a retrospective study. JCO. 2005;23(16 Suppl):5020–5020.
- Yeh TS, Hsieh RH, Shen SC, Wang SH, Tseng MJ, Shih CM, Lin JJ. Nuclear βII-tubulin associates with the activated notch receptor to modulate notch signaling. Cancer Res. 2004;64(22):8334–8340.
- Ho CT, Chang YJ, Yang LX, Wei PL, Liu TZ, Liu JJ. A novel microtubule-disrupting agent induces endoplasmic reticular stress-mediated cell death in human hepatocellular carcinoma cells. PLoS One. 2015;10(9):e0136340.
- Ho ST, Lin CC, Tung YT, Wu JH. Molecular mechanisms underlying yatein-induced cell-cycle arrest and microtubule destabilization in human lung adenocarcinoma cells. Cancers. 2019;11(9):1384.
- Boone RM, Praiss AM, Huang Y, Melamed A, Khoury-Collado F, Hou JY, Gockley A, Clair CMS, Hershman DL, Wright JD. Heterogeneity of outcomes of endometrial cancer patients included in prospective clinical trials. Gynecol Oncol. 2023; 169:70–77.
- Engel JB, Schönhals T, Weidler C, Häusler S, Krockenberger M, Rieger L, Dietl J, Wischhusen J, Honig A. Tubulin inhibitor AEZS 112 inhibits the growth of experimental human ovarian and endometrial cancers irrespective of caspase inhibition. Oncol Rep. 2009;22(2):361–367.
- Dinkic C, Jahn F, Zygmunt M, Schuetz F, Rom J, Sohn C, Fluhr H. PARP inhibition sensitizes endometrial cancer cells to paclitaxel-induced apoptosis. Oncol Lett. 2017;13(4):2847–2851.
- Zheng L, Ren R, Sun X, Zou Y, Shi Y, Di B, Niu MM. Discovery of a dual tubulin and poly (ADP-ribose) polymerase-1 inhibitor by structure-based pharmacophore modeling, virtual screening, molecular docking, and biological evaluation. J Med Chem. 2021;64(21):15702–15715.
- Long H, Hu X, Wang B, Wang Q, Wang R, Liu S, Xiong F, Jiang Z, Zhang XQ, Ye WC, et al. Discovery of novel apigenin–piperazine hybrids as potent and selective poly (ADP-Ribose) polymerase-1 (PARP-1) inhibitors for the treatment of cancer. J Med Chem. 2021;64(16):12089–12108.
- Su C, Haskins AH, Omata C, Aizawa Y, Kato TA. PARP inhibition by flavonoids induced selective cell killing to BRCA2-deficient cells. Pharmaceuticals. 2017;10(4):80.
- Maeda J, Roybal EJ, Brents CA, Uesaka M, Aizawa Y, Kato TA. Natural and glucosyl flavonoids inhibit poly (ADP-ribose) polymerase activity and induce synthetic lethality in BRCA mutant cells. Oncol Rep. 2014;31(2):551–556.
- Geraets L, Moonen HJ, Brauers K, Wouters EF, Bast A, Hageman GJ. Dietary flavones and flavonoles are inhibitors of poly (ADP-ribose) polymerase-1 in pulmonary epithelial cells. J Nutr. 2007;137(10):2190–2195.
- Kabeya Y, Mizushima N, Ueno T, Yamamoto A, Kirisako T, Noda T, Kominami E, Ohsumi Y, Yoshimori T. LC3, a mammalian homologue of yeast Apg8p, is localized in autophagosome membranes after processing. Embo J. 2000;19(21):5720–5728.
- Chiu HW, Yeh YL, Ho SY, Wu YH, Wang BJ, Huang WJ, Ho YS, Wang YJ, Chen LC, Tu SH. A new histone deacetylase inhibitor enhances radiation sensitivity through the induction of misfolded protein aggregation and autophagy in triple-negative breast cancer. Cancers (Basel). 2019;11(11):1703.
- Yu SH, Kao YT, Wu JY, Huang SH, Huang ST, Lee CM, Cheng KT, Lin CM. Inhibition of AMPK-associated autophagy enhances caffeic acid phenethyl ester-induced cell death in C6 glioma cells. Planta Med. 2011;77(9):907–914.
- Chen RJ, Lee YH, Yeh YL, Wu WS, Ho CT, Li CY, Wang BJ, Wang YJ. Autophagy-inducing effect of pterostilbene: A prospective therapeutic/preventive option for skin diseases. J Food Drug Anal. 2017;25(1):125–133.
- Su YK, Huang WC, Lee WH, Bamodu OA, Zucha MA, Astuti I, Suwito H, Yeh CT, Lin CM. Methoxyphenyl chalcone sensitizes aggressive epithelial cancer to cisplatin through apoptosis induction and cancer stem cell eradication. Tumour Biol. 2017;39(5):1010428317691689.
- Chang CH, Lee CY, Lu CC, Tsai FJ, Hsu YM, Tsao JW, Juan YN, Chiu HY, Yang JS, Wang CC. Resveratrol-induced autophagy and apoptosis in cisplatin-resistant human oral cancer CAR cells: A key role of AMPK and Akt/mTOR signaling. Int J Oncol. 2017;50(3):873–882.
- Lin JF, Tsai TF, Liao PC, Lin YH, Lin YC, Chen HE, Chou KY, Hwang TIS. Benzyl isothiocyanate induces protective autophagy in human prostate cancer cells via inhibition of mTOR signaling. Carcinogenesis. 2013;34(2):406–414.
- Chen MY, Yadav VK, Chu YC, Ong JR, Huang TY, Lee KF, Lee KH, Yeh CT, Lee WH. Hydroxychloroquine (HCQ) modulates autophagy and oxidative DNA damage stress in hepatocellular carcinoma to overcome sorafenib resistance via TLR9/SOD1/hsa-miR-30a-5p/Beclin-1 axis. Cancers. 2021;13(13):3227.
- Lan SH, Lin SC, Wang WC, Yang YC, Lee JC, Lin PW, Chu ML, Lan KY, Zuchini R, Liu HS, et al. Autophagy upregulates miR-449a expression to suppress progression of colorectal cancer. Front Oncol. 2021; 11:738144.
- Guru SK, Pathania AS, Kumar S, Ramesh D, Kumar M, Rana S, Kumar A, Malik F, Sharma PR, Chandan BK, et al. Secalonic acid-D represses HIF1α/VEGF-mediated angiogenesis by regulating the Akt/mTOR/p70S6K signaling cascade. Cancer Res. 2015;75(14):2886–2896.
- Pathania AS, Guru SK, Verma M, Sharma C, Abdullah ST, Malik F, Chandra S, Katoch M, Bhushan S. Disruption of the PI3K/AKT/mTOR signaling cascade and induction of apoptosis in HL-60 cells by an essential oil from Monarda citriodora. Food Chem Toxicol. 2013; 62:246–254.
- Chacko SM, Nevin KG, Dhanyakrishnan R, Kumar BP. Protective effect of p-coumaric acid against doxorubicin induced toxicity in H9c2 cardiomyoblast cell lines. Toxicol Rep. 2015;2:1213–1221.
- Berman H, Henrick K, Nakamura H. Announcing the worldwide protein data bank. Nat Struct Biol. 2003;10(12):980–980.
- Morris GM, Goodsell DS, Huey R, Olson AJ. Distributed automatic docking of flexible ligands to proteins: parallel applications of AutoDock 2.4. J Computer-Aided Mol Des. 1996;10(4):293–304.
- Miteva MA, Guyon F, Tufféry P. Frog2: efficient 3D conformation ensemble generator for small compounds. Nucleic Acids Res. 2010;38:W622–W627.
- Trott O, Olson A. Software news and update AutoDock Vina: improving the speed and accuracy of docking with a new scoring function. Effic Optim Multithreading. 2009;31(2):455–461.
- Paul Gleeson M, Hersey A, Hannongbua S. In-silico ADME models: a general assessment of their utility in drug discovery applications. Curr Top Med Chem. 2011;11(4):358–381.
- DeLano WL. Pymol: an open-source molecular graphics tool. CCP4 Newsl Protein Crystallogr. 2002;40(1):82–92.
- Cal Ã. Lead profiling lead-and drug-like compounds: the rule-of-five revolution. Drug Discov Today Technol. 2004; 7:337–341.
- Chanda D, Bhushan S, Guru SK, Shanker K, Wani ZA, Rah BA, Luqman S, Mondhe DM, Pal A, Negi AS. Anticancer activity, toxicity and pharmacokinetic profile of an indanone derivative. Eur J Pharm Sci. 2012;47(5):988–995.