
 ?Mathematical formulae have been encoded as MathML and are displayed in this HTML version using MathJax in order to improve their display. Uncheck the box to turn MathJax off. This feature requires Javascript. Click on a formula to zoom.
ABSTRACT
Background
Heterologous prime-boost schedules have been employed in SARS-CoV-2 vaccination, yet additional data on immunogenicity and effectiveness are still needed.
Research design and methods
Here, we measured the immunogenicity and effectiveness in the real-world setting of the mRNA booster dose in 181 subjects who had completed primary vaccination with ChAdOx1, BNT162b2, or mRNA1273 vaccines (IMMUNO_COV study; protocol code 18,869). The spike-specific antibody and B cell responses were analyzed up to 6 months after boosting.
Results
After an initial slower antibody response, the heterologous ChAdOx1/mRNA prime-boost formulation elicited spike-specific IgG titers comparable to homologous approaches, while spike-specific B cells showed a higher percentage of CD21−CD27− atypical cells compared to homologous mRNA vaccination. Mixed combinations of BNT162b2 and mRNA-1273 elicited an immune response comparable with homologous strategies. Non-significant differences in the Relative Risk of infection, calculated over a period of 18 months after boosting, were reported among homologous or heterologous vaccination groups, indicating a comparable relative vaccine effectiveness.
Conclusions
Our data endorse the heterologous booster vaccination with mRNA as a valuable alternative to homologous schedules. This approach can serve as a solution in instances of formulation shortages and contribute to enhancing vaccine strategies for potential epidemics or pandemics.
1. Introduction
Several SARS-CoV-2 vaccine formulations, including mRNA vaccines, viral vector, and protein subunit vaccines have been developed in an extraordinary effort to control the SARS-CoV-2 pandemic and to reduce the severity of the COVID-19 disease. Since the end of 2021, many countries have implemented vaccination schedule against SARS-CoV-2 with booster doses, to address issues related to the decrease in immunity and the circulation of variants capable of escaping the immune response [Citation1–3]. As of November 2023, about 31% of the global population has received at least one booster dose [https://covid19.who.int/table]. The administration of the third and subsequent doses has opened the door to heterologous prime-boost COVID-19 vaccination approaches [Citation4]. Combination of vaccines has been implemented as a practical response to shortages of certain formulations or changes in national authorization for some initially licensed vaccines. For instance, the use of adenoviral vector ChAdOx1 discontinued in some countries, and supply issues emerged with the Russian Sputnik V vaccine [Citation4,Citation5].
The heterologous prime-boost approach, based on the use of different vaccine platforms for delivering the same vaccine antigen [Citation6–8], has been proposed in the early 2000s as a strategy to increase vaccine immunogenicity and stimulate an immune response that include not only neutralizing antibodies but also cellular responses, especially CD8+ T lymphocytes [Citation9,Citation10]. To enhance the efficacy of heterologous strategies, the combination of systemic and mucosal immunization routes has also been considered [Citation11–13]. This approach can be particularly valuable for inducing a robust immune response through the parenteral priming, and subsequently enhancing the local recruitment of effector factors through mucosal boosting [Citation14–19].
In the recent SARS-CoV-2 pandemic context, the range of different vaccines available against the same spike vaccine antigen has been particularly suitable to study vaccination approaches across the combination of different platforms for the first and second dose or the primary vaccination cycle and the booster dose [Citation20–23]. More than 20 clinical trials are currently ongoing (https://clinicaltrials.gov/), with most of the studies designed to investigate the use of different vaccine platforms for the primary and secondary doses [Citation20]. In the real world setting, most of the people have received the same vaccine for the first two doses and a different formulation for the third or subsequent booster doses. Vaccines recently authorized by regulatory agencies in EU and US for the next vaccination season are an updated version of the vaccines used in previous campaigns. They are meant to broaden vaccine-induced immunity against currently circulating SARS-CoV-2 XBB-sublineage variants and confer protection against severe COVID-19–associated illness and death [Citation24]. Updated authorized vaccines include both the monovalent Omicron XBB.1.5 mRNA vaccines, produced by Moderna and Pfizer-BioNTech, and the updated subunit vaccine produced by Novavax.
Here, we compared the immunogenicity of homologous and heterologous prime-boost approaches using two vaccine platforms, in a real-world setting. A total of 181 subjects received the primary vaccination cycle (first and second doses) with mRNA-based vaccines (BNT162b2, Pfizer or mRNA-1273, Moderna) or the adenovirus-vectored vaccine (ChAdOx1, AstraZeneca), followed by a third dose (boosting) with mRNA-based vaccines, either BNT162b2 or mRNA-1273. The follow-up of the spike-specific antibody and memory B cell responses extended up to 6 months after the third dose, while the investigation on possible SARS-CoV-2 infection, self-reported by participants through a survey, lasted up to 18 months after the booster dose. Considering the crucial role of the long-term memory response, based on the generation of antigen-specific lymphocytes capable of reactivating upon subsequent contact with the antigen, we dissected the spike-specific memory B cells elicited by the different homologous or heterologous vaccine combinations. To visualize the different spike-specific B cell subsets and their dynamic modulation overtime across the different vaccine combination, computational approaches relying on clustering algorithms were employed [Citation25,Citation26].
2. Patients and methods
2.1. Study design
A total of 181 healthy volunteers, mostly recruited among hospital and university workers, aged 24–75 years (median age 48 years), was enrolled in the IMMUNO_COV study. Study participants provided written informed consent before participation in the study. Exclusion criteria included pregnancy, previous documented SARS-CoV-2 infection, and immunocompromising comorbidities (congenital, acquired, or drug-related). The study was performed in compliance with all relevant ethical regulations, and the protocol was approved by local Ethical Committee for Clinical Experimentation (CEAVSE; protocol code 18,869 IMMUNO_COV v1.0 of 18 November 2020, approved on the 21 December 2020) [Citation27]. The primary endpoint of the study was the characterization of the immune response and its persistence in the blood of subjects vaccinated against SARS-CoV-2 with the available vaccine formulations. Clinical data collection and management were carried out using the software REDCap (Research Electronic Data Capture, Vanderbilt University). Participants were asked to respond to a survey to gather information on infection, including the date of the positive antigenic or molecular tests, performed on self-administered or professional-collected nasopharyngeal swabs. The survey covered a period of 18 months following the third dose. For the first cycle of vaccination, subjects received two doses of BNT162b2 (Pfizer-BioNTech; Comirnaty®, hereafter indicated as P), mRNA-1273 (Spikevax®, Moderna, indicated as M), or ChAdOx1 (AZD1222, Vaxzevria®, AstraZeneca, indicated as A) vaccines, administered 21, 28 and 42 days apart, respectively, according to the national guidelines. Almost 6–10 months later, subjects were boosted with BNT162b2 or mRNA-1273 vaccines, resulting in a total of 6 different homologous or heterologous prime-boost combinations (; ).
Figure 1. Different vaccination schedules and sample collection. (a) A total of 181 healthy subjects were enrolled in the study. According to the vaccines used for the first vaccination cycle (first two doses) and for the booster (third dose), subjects were divided into six groups (P/P/P, three doses of Pfizer; P/P/M first two doses with Pfizer and booster with Moderna; M/M/P, first two doses with Moderna and booster with Pfizer; M/M/M, three doses of Moderna; A/A/P, first two doses with AstraZeneca and booster with Pfizer; A/A/M first two doses with AstraZeneca and booster with Moderna). The number of subjects included in each group is reported. b) blood samples were collected at the baseline (pre v1), 7 days post first dose (7v1), before the second dose (pre v2), 7, 60 and 130–180 days post second dose (7v2, 60v2 and 180v2), and 7, 30 and 180 days post the third dose (7v3, 30v3 and 180v3). Spike-specific antibodies were assessed at all time points, while RBD-specific B cells were characterized after the third vaccine dose. (P, Pfizer BNT162b2; M, Moderna mRNA-1273; A, AstraZeneca ChAdOx1).
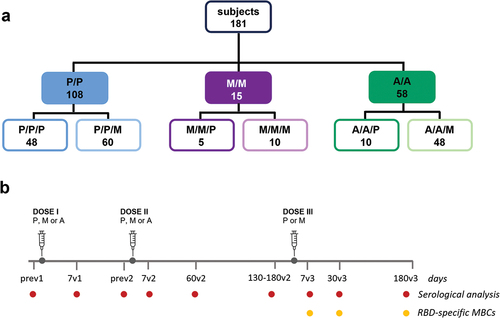
Table 1. Cohort characteristics.
2.2. PBMC isolation
PBMCs and plasma were obtained from venous blood samples after Ficoll-Paque (Lymphoprep, Meda, Italy) density-gradient sedimentation, as previously described. Isolated PBMC were cryopreserved in liquid nitrogen, and plasma samples were stored at −80°C.
2.3. ELISA
Spike- and nucleocapsid-specific IgG were tested in plasma samples by ELISA, as previously described [Citation28]. Briefly, microtiter plates were coated with SARS-CoV-2 full spike protein (1 μg/mL; Sino Biological) or nucleoprotein (1 µg/ml, Sino Biological), blocked and added with plasma samples for 1 h at RT. Anti-human horseradish peroxidase (HRP)-conjugated IgG (diluted 1:6000) or IgG1, IgG2, IgG3, IgG4 (diluted 1:2000; all from Southern Biotechnology), were added for 1 h, and plates were developed with 3,3,’5,5’-Tetramethylbenzidine (TMB; Thermo Fisher Scientific) substrate. Absorbance at 450 nm was measured on Multiskan FC Microplate Photometer (Thermo Fisher Scientific). WHO international positive control (plasma from vaccinated donor diluted 1:5000; NIBSC) and negative control (plasma from unvaccinated donor diluted 1:20, NIBSC) were added in duplicate to each plate. Antibody end point titers were expressed as the reciprocal of the sample dilution, reporting double the background OD value.
2.4. ACE2/RBD binding inhibition assay
Inhibition of the binding between ACE2 and RBD (Wuhan-Hu-1 strain, delta and Omicron variants) was tested with a SARS-CoV-2 surrogate virus neutralization test (sVNT) kit (cPass™ SARS-CoV-2 Neutralization Antibody Detection Kit, GenScript, Piscataway, NJ, U.S.A.) according to the manufacturer protocol. Plasma samples, positive and negative controls, were diluted 1:10 in dilution buffer, mixed 1:1 with diluted HRP-RBD (Wuhan-Hu-1 Delta or Omicron/B 1.1.529/BA.1 variants), and incubated for 30 min at 37°C. Inhibition activity was calculated with the following formula: percentage inhibition = (1 – sample OD value/negative control OD value) * 100. The 30% inhibition cutoff was set by Tan and colleagues as the threshold capable of distinguishing between serum samples with or without neutralizing activity, by testing over 500 SARS-CoV-2 naïve plasma samples [Citation29]. Therefore, as indicated by the manufacturer, inhibition values ≥30% are considered as positive result.
2.5. Multiparametric flow cytometry
SARS-CoV-2-specific B cells were identified among PBMC by flow cytometry. The biotinylated spike (S1+S2 ECD-His recombinant biotinylated-protein, Sino Biological) and RBD (Biolegend) proteins were tetramerized with streptavidin (SA)-Phycoerythrin (PE, Thermofisher), and SA-Allophycocyanin (APC, Thermofisher), respectively. Two million of PBMCs were incubated with BD human FC block (BD Biosciences) for 10 min at RT and then stained for 30 min at 4°C with the following antibodies: CD3-BV650 (clone SK7); CD19-BUV395 (clone SJ25C1), IgD-BV711 (clone IA6–2), CD20-APC-H7 (clone 2H7), CD27-BV786 (clone M-T271) and CD21-FITC (clone B-ly4), and Zombie Aqua™ Fixable Viability Kit (Thermofisher) and fixed with BD fixation solution (BD Biosciences). All antibodies were titrated for optimal dilution. About 1 × 10⁶ cells were acquired and stored for each sample with SO LSRFortessa X20 flow cytometer (BD Biosciences). Data analysis was performed using FlowJo v10 (TreeStar, U.S.A.).
2.6. FlowSOM clustering
The memory B cell population analyzed was gated as live, singlet, CD3−/CD19+, IgD-cells using FlowJo v10 (TreeStar, U.S.A.). FCS files were imported into R environment, compensated, and transformed as previously described [Citation30]. Clustering analysis was performed following the FlowSOM function pipeline (FlowSOM package v2.4.0) [Citation31]. Marker expression was normalized as z-score (mean = 0, standard deviation = 1), and grid size was set to 7 × 7. Similar nodes were merged in six metaclusters (metaclustering step). The Euclidean distance was used in both the FlowSOM clustering and metaclustering. Thresholds to bisect positive and negative cells for each marker expression were automatically set with the flowDensity package v1.34.0 [Citation32]. FlowSOM results were displayed as a heatmap reporting the percentage of positive cells for each marker within the metacluster.
2.7. Data analysis
Kruskal–Wallis test, followed by Dunn’s post test for multiple comparisons, was used for assessing statistical differences between different groups for each time point. The Spearman correlation method was employed to calculate the dependency of infection onset on antibody titers. A p-value ≤0.05 was considered significant. Figures and analyses were performed using GraphPad Prism v10 (GraphPad Software, San Diego, CA, U.S.A.) and R statistical Software, employing the ggplot2 library [Citation33].
Marginal Risk (MR) and Relative Risk (RR) of infection associated with distinct vaccine formulations [Citation34] were calculated as
Letting MR1 and MR2 represent the marginal risk of infection in two distinct groups, the Relative Risk of infection for Group 1 compared to Group 2 was determined as:
A value of RR1,2 near to 1 indicates that the likelihood of infection in Group 1 is comparable to the Group 2, while a value >1 shows an increased risk of Group 1. Relative Vaccine Effectiveness (rVE1,2), indicating the effectiveness of the vaccine formulation in Group 1 compared to Group 2, was computed as (1-RR1,2), and values were reported as percentage. Cubic splines models were used to fit the temporal trends of RR curves.
3. Results
This study was performed in a cohort of 181 healthy subjects (), vaccinated with six different vaccine combinations, as shown in . Blood samples were collected at the baseline (prev1); 7 days post first dose (7v1); before the second dose (prev2); 7, 60, and 130–180 days post second dose (7v2, 60v2 and 180v2, respectively); 7, 30, and 180 days post the third dose (7v3, 30v3, and 180v3), as reported in . Spike-specific antibodies were assessed at all time points, while the persistence of spike-specific MBCs was characterized up to 6 months after the booster dose.
3.1. Spike-specific antibody response
Antibody levels and ACE-2/RBD binding inhibition activity were longitudinally assessed from the first vaccine dose up to 6 months after the third booster dose in each subject across the different vaccine combinations, as shown in .
Figure 2. Antibody response in subjects vaccinated with the different SARS-CoV-2 vaccine formulations. (a) longitudinal analysis of spike-specific IgG titers in plasma samples collected at baseline (pre v1), 7 days post first dose (7v1), 7, 60 and 130–180 days post second dose (7v2, 60v2 and 180v2), and 7, 30 and 180 days post the third dose (7v3, 30v3 and 180 v3), in each subjects, in the different 6 groups. The median value of the group is reported as colored line. (b) overlay of the median value of the longitudinal analysis of spike-specific IgG titers in the 6 groups. (c) anti-spike IgG titers assessed after the first , second and third vaccine doses (P, BNT162b2; M, mRNA-1273; A, ChAdOx1). Kruskal-Wallis test, followed by Dunn’s post test for multiple comparisons, was used for assessing statistical differences between groups (*p < 0.05, **p < 0.01, ***p < 0.001). (d) factor increase calculated as the ratio between antibody levels at 7 days after the third dose versus 7 days after the second dose (d7v3/d7v2) or measured at 180 days after third versus 180 days after second dose (d180v3/d180v2). (e) sVNT performed at 180v2 (in groups PP, MM and AA), 30v3 and 180v3 against the wild type RBD performed in the 6 groups (PPP, PPM, MMP, MMM, AAP, AAM) to assess the ACE2/RBD binding inhibition. The threshold (dotted red line) was placed at 30% inhibition percentage to discriminate between positive and negative samples. (f) sVNT performed at 180v3 against the delta (D) and omicron BA.2 RBD. (P/P/P, three doses of Pfizer; P/P/M first two doses with Pfizer and booster with Moderna; M/M/P, first two doses with Moderna and booster with Pfizer; M/M/M, three doses of Moderna; A/A/P, first two doses with AstraZeneca and booster with Pfizer; A/A/M first two doses with AstraZeneca and booster with Moderna), (P, Pfizer BNT162b2; M, Moderna mRNA-1273; A, AstraZeneca ChAdOx1).
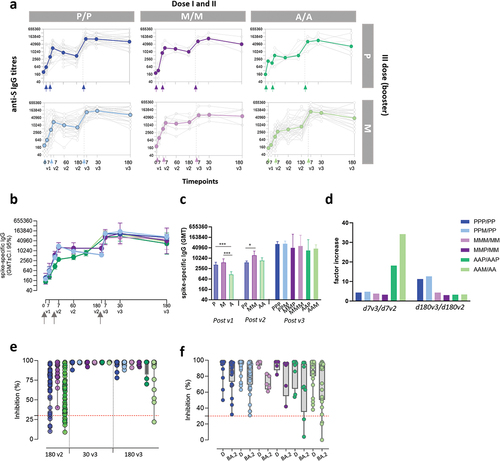
After the first dose, subjects vaccinated with BNT162b2 (P) and mRNA-1273 (M) developed an antibody response with GMT of 4.200 and 5.747, respectively. Subjects receiving ChAdOx1 (A) had a significant lower response with GMT of 1.160 (). The second vaccine dose significantly increased anti-spike IgG already 7 days after vaccine administration (7v2) in all subjects () even though significant higher levels of antibodies were maintained in subjects vaccinated with mRNA compared to adenovirus-vectored vaccines (GMT of 18.960, 16.255 and 3.076 in P/P, M/M and A/A, respectively; p < 0.001). The antibody response was monitored up to 6 months after the second vaccine dose. A reduction of differences among groups was observed, and antibody GMT detected were 5.783, 14.480 and 7.400 in subjects receiving P/P, M/M and A/A, respectively (p < 0.05 in MM versus PP, ). The third dose, performed with mRNA vaccines in all subjects, strongly boosted the anti-spike IgG in all groups, with a significant increase of circulating antibodies from pre- to post third dose (p < 0.05). Seven days after boosting, GMT of 108.563 and 60.866 were measured in subjects receiving the homologous P/P/P and M/M/M vaccination schedule, respectively, while the spike-specific antibody titers induced by the mixed combinations P/P/M and M/M/P were 115.852 and 68.886 GMT, respectively. Subjects primed with adenoviral-vectored vaccines and boosted with mRNA-based formulations developed titers with geometric mean of 67.202 and 120.981 in A/A/P and A/A/M combination, respectively (). Six months after the booster dose, IgG levels persisted at high titers with no statistical difference among groups, even though higher levels were reported in subjects primed with mRNA vaccines (GMT of 65.020 in PPP, 69.811 in PPM, 40.960 in MMP, 51.600 in MMM, 27.564 in AAP, and 36.191 in AAM, ). The IgG subclass analysis reported a predominance of IgG1 in all combinations, while the levels of IgG4 were 4 times higher in homologous mRNA vaccination compared to adenovirus-mRNA heterologous combinations (data not shown), as already reported [Citation35,Citation36].
To quantify the effect of the booster dose on the spike-specific antibody levels, was measured a ‘factor of increase’ obtained by the ratio between antibody levels measured 7 or 180 days after the third dose versus the same time points after the second dose (. The factor differed according to the vaccination strategy and the timing of antibody collection (). When we compared the increase on the antibody response at an early time point after the vaccine administration (7v3 versus 7v2) the strongest increase (>30) was observed in subjects firstly vaccinated with ChAdOx1 and then boosted with mRNA-1273 or BNT162b2. Since the titers measured 7 days after the third dose were similar among all groups (), the observed high fold increase was due to the lower response elicited by the first two doses of ChAdOx1. The effect was strongly reduced when we compared the effect of the booster dose on the persistence of the antibody response, obtained by the ratio between IgG titers measured at d180v3 and d180v2. Considering the increase overtime of spike-specific IgG following ChAdOx1 primary vaccination, reaching comparable levels to the mRNA vaccine formulations at d180v2, the recall effect due to the booster dose was reduced. The group primed with two doses of BNT162b2 and boosted with mRNA-1273 benefits more than the other groups of the booster effect in the long period. To note the low booster effect detected in the mRNA-1273 group, indicative of a strong and persistent response elicited already by two doses of vaccination.
Thus, the serological analysis performed in six different combinations of primary vaccination and booster dose demonstrates that boosting with mRNA vaccines strongly recall the antibody response across all the combinations, independently of the type of vaccine used for the primary immunization. The persistence of spike-specific circulating IgG after the booster dose has been demonstrated in all groups, with higher levels in subjects primed with the BNT162b2 vaccine even not statistically significant. Primary vaccination with ChAdOx1 elicits a slower antibody response compared to mRNA-vaccines that however equals the humoral response elicited by mRNA-based vaccines at 6 months after the first vaccination cycle.
3.2. Binding of wild type and variants RBD
Plasma samples collected after the second and the third vaccine dose were tested for their ability of binding the viral RBD, thus blocking the interaction with ACE-2 molecules, employing a sVNT.
Spike-specific antibodies were still capable of inhibiting ACE2/RBD binding in most patients 6 months after two doses of vaccination (180v2, ). A frequency of 88.9%, 100% and 83.4% of subjects, vaccinated with P/P, M/M or A/A, respectively, inhibited the in vitro binding between the RBD and ACE2 receptor (). A month after the third dose (30v3), a strong and significant increase in the binding inhibition of ACE2/RBD was observed in all subjects, reaching saturating levels in all groups that persisted above the positivity threshold also at d180v3 (). It is noted that subjects primed with ChAdOx1 and boosted with mRNA showed a higher reduction of the inhibition activity at 180v3, compared to the mRNA vaccination ().
Considering the increasing circulation of viral variants, ever more capable of escaping the antibody response elicited by vaccines, the ability of antibodies to inhibit the binding between ACE2 and the Delta and Omicron (BA.2) RBD variants was evaluated in sera collected 180 days after the third dose (). As expected, a more heterogeneous inhibition capacity was observed compared to wild type RBD (). All the subjects had positive inhibition activity against the Delta variant with very similar mean values among groups (mean percentage values of 94 in PPP, PPM and MMM, 96 in MMP, 85 in AAP and AAM), while a higher spread of inhibition levels was measured for BA.2 variant (mean percentage values of 82 in PPP, 81 in PPM, 79 in MMM, 72 in MMP, 64 in AAP and 72 in AAM). Subjects with levels of BA.2/ACE2 binding inhibition below the 30% threshold were observed in AAP (2 subjects, 20%) and AAM group (3 subjects, 11.5%, ).
3.3. Spike-specific memory B cell persistence and phenotypes
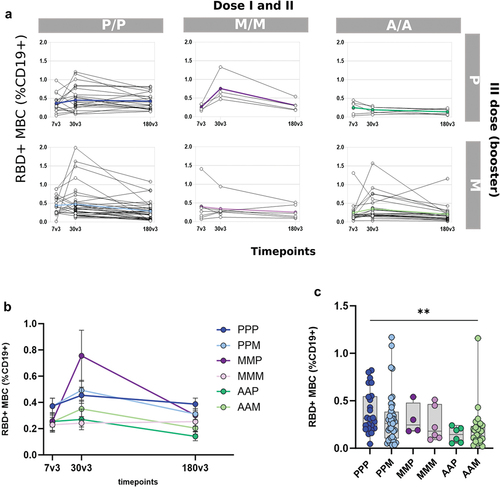
Spike-specific memory B cells were analyzed after the third mRNA booster dose, at 7, 30, and 180 days in all vaccinated groups (). To identify spike-specific B cells and characterize their phenotype, a multiparametric flow cytometry approach was used. Fluorescent RBD was used as probe, and phenotype was characterized assessing the expression of CD19, CD20, CD21, IgD, and CD27 molecules. RBD-specific memory B cells (hereafter named RBD+ MBC) were detected among CD19+ upon exclusion of CD27- IgD+ naïve B cells. The frequency of RBD+ MBC assessed in each subject in the different groups at the three time points after boosting, is shown in . An expansion of the RBD+MBC was observed in all groups, with a peak a month after boosting. When we compared the persistence 6 months later (180v3, ), subjects primed with the Adenoviral-vectored vaccine showed lower values of circulating RBD+MBC compared to those primed with mRNA-based vaccines, especially with the BNT1262 vaccine.
Figure 3. RBD-specific B cells in subjects vaccinated with the different SARS-CoV-2 vaccine formulations (a) Longitudinal analysis of RBD-specific B cells (CD19+CD20+) in samples collected 7, 60 and 180 days post the booster dose (7v3, 30v3 and 180 v3) from each subject in the different 6 groups. The median of the group is reported as colored line. (b) Overlay of the median value of the longitudinal analysis of RBD-specific B cells in the 6 groups. (c) RBD-specific B cells assessed 180 days after the boost does (180v3). Kruskal–Wallis test, followed by Dunn’s post test for multiple comparisons, was used for assessing statistical differences between groups (**p < 0.01, P/P/P, three doses of Pfizer; P/P/M first two doses with Pfizer and booster with Moderna; M/M/P, first two doses with Moderna and booster with Pfizer; M/M/M, three doses of Moderna; A/A/P, first two doses with AstraZeneca and booster with Pfizer; A/A/M first two doses with AstraZeneca and booster with Moderna), (P, Pfizer BNT162b2; M, Moderna mRNA-1273; A, AstraZeneca ChAdOx1).
Computational analysis, based on the FlowSOM clustering algorithm, was applied to the multidimensional flow cytometry data for better profiling the antigen-specific B cell response elicited across the different vaccine combinations. Our analysis longitudinally profiled the RBD+ MBC sub-populations elicited upon the booster dose in the different groups (). According to the combination of CD27, IgD and CD21 expression, 6 MBC clusters were identified, corresponding to activated (CD27+ CD21-), resting (CD27+ CD21+), atypical (CD27- CD21-) or DN (CD27- IgD-), Ig-switched (CD27+ IgD-) and unswitched (CD27+ IgD+) cells. Data were visualized as heatmap reporting each MBC clusters in row, and surface markers in column, with the percentages of positive cells for each marker inside the cluster pictured as a color scale from blue (0% of positive cells) to red (100%; ). The cluster sizes were shown in the bubble plot, proportional to the percentage of MBC included in each cluster. The median frequencies of RBD-specific B cells inside each cluster were visualized as heatmap (), while the specific frequency values were shown as dot plot across the different vaccine combinations ().
Figure 4. Clustering analysis of RBD-specific B cell subsets in subjects vaccinated with the different SARS-CoV-2 vaccine formulations. FlowSOM algorithm was used to characterize different phenotypes of memory B cells through a clustering analysis. (a) Heatmap of clusters from the FlowSOM analysis of total memory B cells, with IgD, CD27 and CD21 markers in column, and clusters in row. The percentage of cells positive for each marker is visualized with a color scale from blue (0%) to red (100%). A bubble plot reported the percentage of cells included in each cluster. (b and c) Median frequencies, respect to memory B cells, of RBD-specific B cells in each clusters of panel a at 7, 30 and 180 days after the third dose (d7, d30 and d180) in each vaccine formulation reported as heatmap (b) and dot plot (c). (P/P/P, three doses of Pfizer; P/P/M first two doses with Pfizer and booster with Moderna; M/M/P, first two doses with Moderna and booster with Pfizer; M/M/M, three doses of Moderna; A/A/P, first two doses with AstraZeneca and booster with Pfizer; A/A/M first two doses with AstraZeneca and booster with Moderna), (P, Pfizer BNT162b2; M, Moderna mRNA-1273; A, AstraZeneca ChAdOx1).
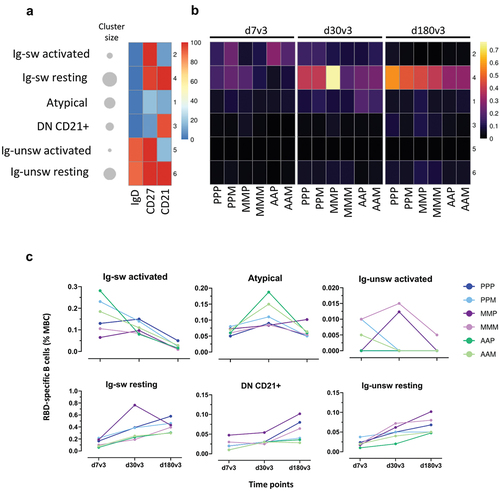
Immediately after the booster dose (7v3), a fraction of RBD-specific B cells was identified among cluster 2 ‘activated MBC,’ especially in AAP and AAM groups, while in vaccine combinations including mRNA for primary cycle, RBD-specific B cells were mostly present in cluster 4 ‘resting cells.’ Cluster 4 became predominant at later time points, especially at d180v3, containing the highest proportion of RBD+ cells in all vaccine combinations (). A small fraction of RBD-specific B cells was also detected inside cluster 1 (DN/Atypical), in particular at 30v3 in AAP and AAM (). Notably, the formulations that included the ChAdOx1 as primary cycle vaccine showed the lowest values of resting memory (cluster 4) at 30v3 and 180v3 (). The profile of the RBD-specific B cells across the different vaccine combinations at the different times after boosting is compared into .
3.4. Frequency of self-reported SARS-CoV-2 infection in vaccinees
Breakthrough infections were reported by the subjects enrolled in the study, by filling a survey about SARS-CoV-2 infection contracted upon the booster dose, documented by positive antigenic or molecular tests on nasopharyngeal swabs. Since the booster dose was administered in October/November 2021, the reporting period for the infection ranged from December 2021 to May 2023. During this period, the Delta and Omicron variants were circulating, the former in its terminal phase, while the latter was taking over [Citation37]. Self-reported infected subjects were symptomatic or being contact of infected persons and does not include people who could have contracted the infection in the asymptomatic way. All participants who reported COVID-19 infection had mild disease symptoms, as defined in [Citation38], and severe COVID-19 disease cases and/or hospitalization were not declared. These aspects were common across all cohorts, leading us to deem the associated error as negligible.
The percentages of subjects who declared one or more mild infection upon the booster dose were reported in . Among subjects receiving the first vaccination cycle with BNT162b2 and then boosted with P (PPP) or M (PPM), the frequency of infected subjects was 27.6% and 41.6%, respectively (18/48 and 25/60 subjects), when primed with mRNA-1273 and then boosted with P or M it was 100% and 50% (5/5 and 5/10 subjects), and when primed with ChAdOx1 and then boosted with P or M, it was 40% and 45.8% (4/10 and 22/48 subjects). The number of infected cases for each vaccine combination distributed over time is shown in . A smoothed visualization of infection distribution over time was obtained by fitting the histogram trend for each group (). A more uniform distribution appeared in individuals boosted with mRNA-1273 (M), while two peaks, one around months 4–7 and one at months 10–13 post-vaccination, emerged following BNT162b2 boosting (). Generally, a lack of infections was observed in all vaccine formulations around months 8–10 that corresponded to the summertime 2022.
Figure 5. Cases of infection across the different SARS-CoV-2 vaccine formulations. (a) Frequency of subjects reporting infection after the booster dose, across the different vaccine combinations. (b) Number of infections over time, reported in months since the third dose of vaccination, for each vaccine combination. Booster with Pfizer (P) or mRNA-1273 (M) are shown on the right. (c) Smooth fit of infection distributions over time for each of the six combinations of vaccines. Density values are obtained by normalizing the number of cases to the total number of infected individuals within each group. (d) Trend of relative risk (RR) of infection for the comparisons of groups that received BNT162b2 or mRNA-1273 as booster dose (3vM vs 3vP, red curve) and homologous vs heterologous (dark blue curve). The two trends are fitted using a cubic spline model and time is reported as quarters since the booster dose. (P/P/P, three doses of Pfizer; P/P/M first two doses with Pfizer and booster with Moderna; M/M/P, first two doses with Moderna and booster with Pfizer; M/M/M, three doses of Moderna; A/A/P, first two doses with AstraZeneca and booster with Pfizer; A/A/M first two doses with AstraZeneca and booster with Moderna), (P, Pfizer BNT162b2; M, Moderna mRNA-1273; A, AstraZeneca ChAdOx1).
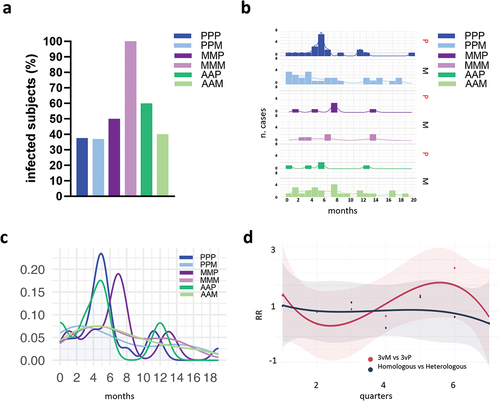
To analyze the risk of mild SARS-CoV-2 infection in subjects boosted with the Pfizer or Moderna, groups that received BNT162b2 or mRNA-1273 as booster dose, irrespective of first vaccination cycle, were aggregated and indicated as 3vP and 3vM, respectively. The Relative Risk (RR) trajectory calculated among 3vM and 3vP groups showed a constant trend, with mean values consistently approximating 1 (), even if minor fluctuations (ranged between 0 and 2.6) were noted during intermediate three-month range (quarters). The overall MR of infection was 0.430 and 0.440 among BNT162b2 or mRNA-1273 boosted subjects, determining non-significant differences in the relative vaccine effectiveness between the two groups with a rVE3vM,3vP of 2.2%, indicating a comparable mild infection risk profile.
A similar analysis was performed among subjects receiving homologous and heterologous vaccination strategies (). Both homologous and heterologous combinations maintained a consistent RR trend throughout the entire temporal span, converging around a threshold value of 1. The overall MR of infection was 0.508 and 0.517, with a rVEHom,Het of 1.7%, indicating a comparable infection risk profile between the two vaccine strategies.
Any significant correlation between antibody titers at 30v3 and the onset of a self-reported mild infection in either of the two groups, 3vP or 3vM (R = −0.089, p = 0.58 for 3vP; R = 0.098, p = 0.38 for 3vM; Spearman correlation), as well as in both homologous and heterologous ones (R = 0.067, p = 0.54 for homologous; R = 0.17, p = 0.3 for heterologous) was observed.
4. Discussion
In this study, we investigated the immunogenicity of the mRNA-based booster dose following primary vaccination with two doses of ChAdOx1, BNT162b2 or mRNA1273 vaccines. Our investigation was aimed to compare the priming capacity of adenoviral-vectored and mRNA nanoparticle-delivered vaccines, and to evaluate the immunogenicity and effectiveness of the BNT162b2 and mRNA-1273 mRNA vaccines as booster formulations. According to the different vaccination schedules, participants were allocated into six vaccine combination groups, two based on the homologous administration of the same vaccine for three times (PPP or MMM), and the others receiving a mixed combination (PPM, MMP, AAP and AAM). We assumed as ‘heterologous’ also the combination of different mRNA-based vaccines (primary vaccination with BNT162b2 boosted with mRNA-1273 and vice versa), since the quantity of mRNA present into the two vaccines and the composition of the nanoparticles used as delivery system, are slightly different [Citation39,Citation40] and vaccinated individuals display differential reactogenicity [Citation41,Citation42].
Here, we showed that the heterologous combination based on ChAdOx1 for the first vaccination cycle followed by mRNA booster elicited a spike-specific IgG response comparable to the homologous strategy using mRNA vaccines. Nevertheless, when we measured the reactivity against the Omicron variant and the phenotypes of RBD-specific B cells, the heterologous combinations AAM and AAP were slightly different from the other combinations using only mRNA-based vaccines. Mixing the BNT162b2 and mRNA-1273 for priming and boosting and vice versa did not alter the immune response compared to homologous formulations. Non-significant differences in relative vaccine effectiveness were observed between the groups receiving a homologous or heterologous vaccination and between groups boosted with BNT162b2 and mRNA-1273, indicating in both cases a comparable risk of mild infection.
The priming properties of ChAdOx1, BNT162b2 and mRNA1273 were compared by assessing the immune responsiveness upon the mRNA booster. Comparable levels of circulating spike-specific IgG were detected at 6 months after boosting across the different vaccine combinations, demonstrating binding to the wild type RBD and blocking its interaction with the ACE-2 receptor in all groups, even though the lower binding capacity was observed in the AAM group. Notably, ChAdOx1-primed individuals exhibited a slower IgG response compared to those vaccinated with BNT162b2 or mRNA-1273. Moreover, consistent with findings from other studies, repeated SARS-CoV-2 mRNA vaccination induced a higher IgG4 response [Citation35,Citation36,Citation43], which functionality is not clear [Citation44,Citation45], considering that IgG4 are commonly associated with a reduced capacity to mediate antibody-dependent cellular phagocytosis and complement deposition due to the decreased Fc mediated antibody effector functions [Citation46]. Whether the IgG4 switching could be part of the host reaction to the persistence of antigen into the lymph nodes germinal centers upon mRNA vaccination [Citation47] and potentially promote immune tolerance to spike protein [Citation48] warrants further investigation.
A different B cell response between ChAdOx1 and mRNA vaccines was observed by the phenotypical analysis of the RBD-specific B cells, performed longitudinally upon the booster dose. ChAdOx1-primed individuals exhibited a lower frequency of resting memory B cells compared to PPP, PPM and MMP and a higher percentage of atypical cells (CD27−CD21−). This particular phenotype had been described immediately after the second mRNA vaccine dose or SARS-CoV- 2 infection and declined overtime [Citation30,Citation49,Citation50]. Atypical B cells are a population of B cells that are commonly enriched in individuals with chronic immune activation [Citation51,Citation52] or autoimmune diseases [Citation53], but they have also been proposed to be normal part of the immune response to infection or vaccination. While in chronic infectious diseases atypical MBCs have been described as ‘exhausted’ and hyporesponsive to BCR stimulation by soluble anti-Ig cross-linking [Citation51], potential functions in the context of vaccination are less clear. Studies upon influenza and malaria vaccination have associated these cells with an alternative lineage respect to the classical lineage of activated and resting memory B cells that could be recalled by booster immunization [Citation54,Citation55]. Interestingly, the presence of atypical cells observed in elderly subjects primed with two doses of ChAdOx1 vaccine and boosted with mRNA vaccines correlated with a significantly lower neutralizing response [Citation56], while spike-specific atypical B cells elicited in people living with HIV by two doses of mRNA vaccination did not correlate with altered humoral response compared to healthy controls [Citation57]. Therefore, it is difficult to understand the role of atypical cells in the context of vaccination, and their functionality, in terms of long-term responses, needs to be further explored.
Other studies have reported a higher frequency of RBD-specific B cells upon mRNA vaccines administration compared to adenoviral-vectored (Ad26.COV2.S or ChAdOx1-S) or recombinant spike protein vaccination (NVX-CoV2373) [Citation58,Citation59]. To note, in immunocompromised fragile subjects, a lower and delayed spike-specific B cell response [Citation28,Citation60] with a different phenotypic profile [Citation57], has been reported. Given the critical role of memory B cell responses in long-term immune responsiveness and protection [Citation30,Citation61], evaluating their induction across various vaccination schedules offers insights into potential flexible booster dose programs involving mixed vaccines against SARS-CoV-2.
Regarding the impact of BNT162b2 or mRNA-1273 as booster vaccine, we demonstrated that both vaccines significantly recalled the humoral response, generating a persistent spike-specific IgG response comparable between subjects receiving homologous and heterologous schedules.
Notably, both mRNA vaccines exhibited the capability to neutralize the Omicron B.1.1.529 variant [Citation62], emphasizing the importance of the third dose for expanding cross-reactive antibodies [Citation63–67]. While after the first vaccination cycle binding inhibition of the Omicron RBD was undetectable [Citation30], in the prime-boost mixed combinations, we observed that 100% of subjects in PPP, PPM, MMM and MMP and 75% and 88% in AAP and AAM, respectively, had the capacity of blocking the Omicron variant. A study by Sokal et al has estimated that 10% of anti-RBD MBC repertoire, elicited by mRNA vaccination, is capable of neutralizing the Omicron variant [Citation68]. Moreover, computational modeling combined with human vaccination data has provided insights into the mechanisms of antigen presentation shaping the antibody response to Omicron variants upon the booster dose [Citation69]. Comparing the breakthrough infection rates reported among the BNT162b2 or mRNA-1273-boosted subjects, no significant differences were observed; however, infections in individuals mRNA-1273-boosted were uniformly distributed over time, while those in BNT162b2-boosted subjects showed two peaks, around months 4–7, and 10–13 post-vaccination.
The study has some limitations, such as a heterogeneous distribution of participants across the six vaccine combinations, with cohorts primed using mRNA-1273 having lower subjects due to real-world variations in vaccine availability. This uneven distribution may impact specific analyses, such as assessing the frequency of subjects reporting SARS-CoV-2 infection. Another limitation is the self-report of infection, due to restricted access to hospitals during the pandemic phase. Furthermore, the study focuses on the antigen-specific B cell responses and does not assess T cellular immunity and longevity across the different vaccination schedules. Although poorly investigated, existing data suggest that heterologous regimens may have the potential to increase cellular responses [Citation70–72], making this immunological aspect interesting to be explored in-depth in future analyses. Lastly, here we tested the heterologous vaccination schedule based on priming with ChAdOx1 and mRNA for boosting, but not on the contrary, since all participants to this study were boosted with mRNA vaccines in accordance with national regulation.
5. Conclusions
Our immunogenicity and effectiveness data support the use of homologous or heterologous vaccination schedules with mRNA vaccines as third dose, in the context of the SARS-CoV-2 vaccination campaigns. We also demonstrated a comparable immunogenicity and effectiveness of BNT162b2 and mRNA-1273 vaccines when used as booster formulation. We therefore recommend the heterologous mRNA-based booster vaccination in people vaccinated with the adenoviral-vectored vaccine as a valuable alternative strategy to homologous mRNA vaccination schedules, against SARS-CoV-2 and possibly other pathogens. Heterologous vaccine regimen represents a valid opportunity to make vaccination programs more flexible and reliable in the face of supply fluctuations. The valuable information gathered and analyzed during the SARS-CoV-2 pandemic so far, represent a precious tool for supporting the scientific community and the regulatory authorities in the management of future possible epidemic or pandemic.
Article highlights
The heterologous combination of ChAdOx1 for the first vaccination cycle with BNT162b2 or mRNA-1273 vaccines for boosting elicits a spike-specific antibody response comparable to the homologous strategy using mRNA vaccines.
Mixing the BNT162b2 and mRNA-1273 for priming and boosting and vice versa does not alter the immune response compared to repeated doses with the same mRNA vaccine.
BNT162b2 and mRNA-1273 vaccines have shown a comparable immunogenicity and effectiveness when used as booster formulation.
The heterologous prime – boost strategies can be a valuable alternative approach to homologous schedules, against SARS-CoV-2 and possibly other pathogens.
Declaration of interests
The authors have no relevant affiliations or financial involvement with any organization or entity with a financial interest in or financial conflict with the subject matter or materials discussed in the manuscript. This includes employment, consultancies, honoraria, stock ownership or options, expert testimony, grants or patents received or pending, or royalties.
Reviewer disclosures
Peer reviewers on this manuscript have no relevant financial or other relationships to disclose.
Informed consent statement
Informed consent was obtained from all subjects involved in the study.
Author contributions
AC, GP, FM and DM conceived the study. IR, AL, MD, MF, MT and FM. enrolled patients. GP, JP, and SZ processed the samples. GP, FF, JP and SZ carried out the immunological analysis. AC, GP, FF, JP, SL and GM analyzed the data. AC, GP and DM wrote the manuscript. AC, GP and DM supervised the study. DM provided financial support. All the authors have substantially contributed to the conception and design of the article and interpreting the relevant literature and been involved in writing the article or revised it for intellectual content
Data availability statement
Data available upon request.
Additional information
Funding
References
- Dejnirattisai W, Shaw RH, Supasa P, et al. Reduced neutralisation of SARS-CoV-2 omicron B.1.1.529 variant by post-immunisation serum. Lancet. 2022;399(10321):234–236. doi: 10.1016/S0140-6736(21)02844-0
- Lau JJ, Cheng SMS, Leung K, et al. Real-world COVID-19 vaccine effectiveness against the omicron BA.2 variant in a SARS-CoV-2 infection-naive population. Nat Med. 2023;29(2):348–357. doi: 10.1038/s41591-023-02219-5
- Dejnirattisai W, Huo J, Zhou D, et al. SARS-CoV-2 omicron-B.1.1.529 leads to widespread escape from neutralizing antibody responses. Cell. 2022;185(3):467–484.e15. doi: 10.1016/j.cell.2021.12.046
- Macchia A, Ferrante D, Bouzas MB, et al. Immunogenicity induced by the use of alternative vaccine platforms to deal with vaccine shortages in a low- to middle-income country: results of two randomized clinical trials. The Lancet Regional Health – Americas [Internet]. 2022;9:100196. [cited 2023 Oct 17]. Available from: https://www.thelancet.com/journals/lanam/article/PIIS2667-193X(22)00013-8/fulltext
- Webster P. Russian COVID-19 vaccine in jeopardy after Ukraine invasion. Nature Med Internet. 2022; [cited 2023 Oct 17]. Available from: https://www.nature.com/articles/d41591-022-00042-y
- Schneider J, Gilbert SC, Blanchard TJ, et al. Enhanced immunogenicity for CD8+ T cell induction and complete protective efficacy of malaria DNA vaccination by boosting with modified vaccinia virus Ankara. Nat Med. 1998;4(4):397–402. doi: 10.1038/nm0498-397
- Hanke T, Samuel RV, Blanchard TJ, et al. Effective induction of simian immunodeficiency virus-specific cytotoxic T lymphocytes in macaques by using a multiepitope gene and DNA prime-modified vaccinia virus ankara boost vaccination regimen. J Virol. 1999;73(9):7524–7532. doi: 10.1128/JVI.73.9.7524-7532.1999
- Robinson HL, Montefiori DC, Johnson RP, et al. Neutralizing antibody-independent containment of immunodeficiency virus challenges by DNA priming and recombinant pox virus booster immunizations. Nat Med. 1999;5(5):526–534. doi: 10.1038/8406
- Lu S. Heterologous prime–boost vaccination. Curr Opin Immunol. 2009;21(3):346–351. doi: 10.1016/j.coi.2009.05.016
- Ramshaw IA, Ramsay AJ. The prime-boost strategy: exciting prospects for improved vaccination. Immunol Today. 2000;21(4):163–165. doi: 10.1016/S0167-5699(00)01612-1
- Lapuente D, Fuchs J, Willar J, et al. Protective mucosal immunity against SARS-CoV-2 after heterologous systemic prime-mucosal boost immunization. Nat Commun. 2021;12(1):6871. doi: 10.1038/s41467-021-27063-4
- Ciabattini A, Pettini E, Fiorino F, et al. Heterologous prime-boost combinations highlight the crucial role of adjuvant in priming the immune system. Front Immunol. 2018;9:380. doi: 10.3389/fimmu.2018.00380
- Pettini E, Prota G, Ciabattini A, et al. Vaginal immunization to elicit primary T-cell activation and dissemination. PLoS One. 2013;8(12):e80545. doi: 10.1371/journal.pone.0080545
- Ciabattini A, Pettini E, Fiorino F, et al. Modulation of primary immune response by different vaccine adjuvants. Front Immunol. 2016;7:427. doi: 10.3389/fimmu.2016.00427
- Ciabattini A, Prota G, Christensen D, et al. Characterization of the Antigen-Specific CD4(+) T cell response induced by prime-boost strategies with CAF01 and CpG adjuvants administered by the intranasal and subcutaneous routes. Front Immunol. 2015;6:430. doi: 10.3389/fimmu.2015.00430
- Fiorino F, Pettini E, Pozzi G, et al. Prime-boost strategies in mucosal immunization affect local IgA production and the type of Th response. Front Immunol. 2013;4:128. doi: 10.3389/fimmu.2013.00128
- Zhang Y, Guo X, Guo M, et al. Combined prime-boost immunization with systemic and mucosal pneumococcal vaccines based on pneumococcal surface protein a to enhance protection against lethal pneumococcal infections. Immunol Res. 2019;67(4–5):398–407. doi: 10.1007/s12026-019-09107-6
- Lapuente D, Viherlehto V, Fuchs J, et al. Adenoviral vector vaccines are effective mucosal booster modalities to elevate systemic and establish mucosal immunity against SARS-CoV-2. J Immunol. 2023;210(1_Supplement):253.01. doi: 10.4049/jimmunol.210.Supp.253.01
- Christensen D, Polacek C, Sheward DJ, et al. Protection against SARS-CoV-2 transmission by a parenteral prime—intranasal boost vaccine strategy. EBioMedicine [Internet]. 2022;84:104248. [cited 2024 Mar 11]. Available from: https://www.thelancet.com/journals/ebiom/article/PIIS2352-3964(22)00430-3/fulltext
- Nuñez NG, Schmid J, Power L, et al. High-dimensional analysis of 16 SARS-CoV-2 vaccine combinations reveals lymphocyte signatures correlating with immunogenicity. Nat Immunol. 2023;24(6):941–954. doi: 10.1038/s41590-023-01499-w
- Atmar RL, Lyke KE, Deming ME, et al. Homologous and heterologous Covid-19 booster vaccinations. N Engl J Med. 2022;386(11):1046–1057. doi: 10.1056/NEJMoa2116414
- Pérez-Then E, Lucas C, Monteiro VS, et al. Neutralizing antibodies against the SARS-CoV-2 delta and omicron variants following heterologous CoronaVac plus BNT162b2 booster vaccination. Nat Med. 2022;28(3):481–485. doi: 10.1038/s41591-022-01705-6
- Wagner A, Ohradanova-Repic A, Gebetsberger L, et al. Full seroconversion in initial non-responders with higher antibody levels after heterologous COVID-19 vaccination schedule. Immunol Lett. 2022;250:1–6. doi: 10.1016/j.imlet.2022.09.001
- Regan JJ, Moulia DL, Link-Gelles R. Use of updated COVID-19 vaccines 2023–2024 formula for persons aged ≥6 months: recommendations of the Advisory Committee on Immunization Practices — United States, September 2023. MMWR Morb Mortal Wkly Rep [Internet]. 2023;72(42):1140–1146. [cited 2023 Oct 19]. Available from https://www.cdc.gov/mmwr/volumes/72/wr/mm7242e1.htm
- Lucchesi S, Furini S, Medaglini D, et al. From bivariate to multivariate analysis of cytometric data: overview of computational methods and their application in vaccination studies. Vaccines (Basel). 2020;8(1):8. doi: 10.3390/vaccines8010138
- Lucchesi S, Nolfi E, Pettini E, et al. Computational analysis of multiparametric flow cytometric data to dissect B cell subsets in vaccine studies. Cytometry Pt A. 2020;97(3):259–267. doi: 10.1002/cyto.a.23922
- Ciabattini A, Pastore G, Fiorino F, et al. Evidence of SARS-CoV-2-specific memory B cells six months after vaccination with the BNT162b2 mRNA vaccine. Front Immunol. 2021;12:740708. doi: 10.3389/fimmu.2021.740708
- Fiorino F, Sicuranza A, Ciabattini A, et al. The slower antibody response in myelofibrosis patients after two doses of mRNA SARS-CoV-2 vaccine calls for a third dose. Biomedicines. 2021;9(10):1480. doi: 10.3390/biomedicines9101480
- Tan CW, Chia WN, Qin X, et al. A SARS-CoV-2 surrogate virus neutralization test based on antibody-mediated blockage of ACE2–spike protein–protein interaction. Nat Biotechnol. 2020;38(9):1073–1078. doi: 10.1038/s41587-020-0631-z
- Ciabattini A, Pastore G, Lucchesi S, et al. Trajectory of spike-specific B cells elicited by two doses of BNT162b2 mRNA vaccine. Cells. 2023;12(13):1706. doi: 10.3390/cells12131706
- Van Gassen S, Callebaut B, Van Helden MJ, et al. FlowSOM: using self-organizing maps for visualization and interpretation of cytometry data. Cytometry Pt A. 2015;87(7):636–645. doi: 10.1002/cyto.a.22625
- Malek M, Taghiyar MJ, Chong L, et al. flowDensity: reproducing manual gating of flow cytometry data by automated density-based cell population identification. Bioinformatics. 2015;31(4):606–607. doi: 10.1093/bioinformatics/btu677
- Wickham H. ggplot2 [Internet]. Cham: Springer International Publishing; 2016 [cited 2023 Nov 20]. Available from: http://doi.org/10.1007/978-3-319-24277-4
- Habibzadeh F, Habibzadeh P, Yadollahie M. On measuring vaccine effectiveness with observational study designs. Acta Med Acad. 2022;51(2):134–146. doi: 10.5644/ama2006-124.383
- Yoshimura M, Sakamoto A, Ozuru R, et al. The appearance of anti-spike receptor binding domain immunoglobulin G4 responses after repetitive immunization with messenger RNA-based COVID-19 vaccines. Int J Infect Dis. 2024;139:1–5. doi: 10.1016/j.ijid.2023.11.028
- Irrgang P, Gerling J, Kocher K, et al. Class switch toward noninflammatory, spike-specific IgG4 antibodies after repeated SARS-CoV-2 mRNA vaccination. Sci Immunol. 2022;8(79):eade2798. doi: 10.1126/sciimmunol.ade2798
- Cocherie T, Zafilaza K, Leducq V, et al. Epidemiology and characteristics of SARS-CoV-2 variants of concern: the impacts of the Spike Mutations. Microorganisms. 2022;11(1):30. doi: 10.3390/microorganisms11010030
- National Institutes of Health [Internet]. Coronavirus Disease 2019 (COVID-19) Treatment Guidelines. [cited 2024 Jan 9]. Available from: https://www.covid19treatmentguidelines.nih.gov/overview/clinical-spectrum/
- Guerrini G, Magrì D, Gioria S, et al. Characterization of nanoparticles-based vaccines for COVID-19. Nat Nanotech. 2022;17(6):570–576. doi: 10.1038/s41565-022-01129-w
- Carreño JM, Singh G, Tcheou J, et al. mRNA-1273 but not BNT162b2 induces antibodies against polyethylene glycol (PEG) contained in mRNA-based vaccine formulations. Vaccine. 2022;40:6114–6124. doi: 10.1016/j.vaccine.2022.08.024
- Chapin-Bardales J, Gee J, Myers T. Reactogenicity following receipt of mRNA-based COVID-19 vaccines. JAMA. 2021;325(21):2201–2202. doi: 10.1001/jama.2021.5374
- Guerrini G, Gioria S, Sauer AV, et al. Monitoring anti-PEG antibodies level upon repeated lipid nanoparticle-based COVID-19 vaccine administration. Int J Mol Sci. 2022;23(16):8838. doi: 10.3390/ijms23168838
- Buhre JS, Pongracz T, Künsting I, et al. mRNA vaccines against SARS-CoV-2 induce comparably low long-term IgG fc galactosylation and sialylation levels but increasing long-term IgG4 responses compared to an adenovirus-based vaccine. Front Immunol. 2022;13:1020844. doi: 10.3389/fimmu.2022.1020844
- Pillai S. Is it bad, is it good, or is IgG4 just misunderstood? Sci Immunol. 2023;8(81):eadg7327. doi: 10.1126/sciimmunol.adg7327
- Rispens T, Huijbers MG. The unique properties of IgG4 and its roles in health and disease. Nat Rev Immunol. 2023;23(11):763–778. doi: 10.1038/s41577-023-00871-z
- Vidarsson G, Dekkers G, Rispens T. IgG subclasses and Allotypes: from structure to effector functions. Front Immunol [Internet]. 2014;5. [cited 2024 Mar 8]. Available from: https://www.frontiersin.org/journals/immunology/articles/10.3389/fimmu.2014.00520/full
- Röltgen K, Nielsen SCA, Silva O, et al. Immune imprinting, breadth of variant recognition, and germinal center response in human SARS-CoV-2 infection and vaccination. Cell. 2022;185(6):1025–1040.e14. doi: 10.1016/j.cell.2022.01.018
- Uversky VN, Redwan EM, Makis W, et al. IgG4 antibodies induced by repeated vaccination may generate immune tolerance to the SARS-CoV-2 Spike Protein. Vaccines. 2023;11(5):991. doi: 10.3390/vaccines11050991
- Pape KA, Dileepan T, Kabage AJ, et al. High-affinity memory B cells induced by SARS-CoV-2 infection produce more plasmablasts and atypical memory B cells than those primed by mRNA vaccines. Cell Rep. 2021;37(2):109823. doi: 10.1016/j.celrep.2021.109823
- Courey-Ghaouzi A-D, Kleberg L, Sundling C. Alternative B cell differentiation during infection and inflammation. Front Immunol [Internet]. 2022;13. [cited 2022 Oct 20]. Available from: https://www.frontiersin.org/articles/10.3389/fimmu.2022.908034
- Moir S, Ho J, Malaspina A, et al. Evidence for HIV-associated B cell exhaustion in a dysfunctional memory B cell compartment in HIV-infected viremic individuals. J Exp Med. 2008;205(8):1797–1805. doi: 10.1084/jem.20072683
- Weiss GE, Crompton PD, Li S, et al. Atypical memory B cells are greatly expanded in individuals living in a Malaria-Endemic Area. J Immunol. 2009;183(3):2176–2182. doi: 10.4049/jimmunol.0901297
- Wei C, Anolik J, Cappione A, et al. A new population of cells lacking expression of CD27 represents a notable component of the B cell memory compartment in systemic lupus erythematosus. J Immunol. 2007;178(10):6624–6633. doi: 10.4049/jimmunol.178.10.6624
- Andrews SF, Chambers MJ, Schramm CA, et al. Activation dynamics and immunoglobulin evolution of pre-existing and newly generated human memory B cell responses to influenza Hemagglutinin. Immunity. 2019;51(2):398–410.e5. doi: 10.1016/j.immuni.2019.06.024
- Sutton HJ, Aye R, Idris AH, et al. Atypical B cells are part of an alternative lineage of B cells that participates in responses to vaccination and infection in humans. Cell Rep [Internet]. 2021;34(6):108684. [cited 2022 Nov 15] Available from: https://www.cell.com/cell-reports/abstract/S2211-1247(20)31673-9
- Ferreira IATM, Lee CYC, Foster WS, et al. Atypical B cells and impaired SARS-CoV-2 neutralization following heterologous vaccination in the elderly. Cell Rep. 2023;42(8):112991. doi: 10.1016/j.celrep.2023.112991
- Polvere J, Fabbiani M, Pastore G, et al. B cell response after SARS-CoV-2 mRNA vaccination in people living with HIV. Commun Med (Lond). 2023;3(1):13. doi: 10.1038/s43856-023-00245-5
- Zhang Z, Mateus J, Coelho CH, et al. Humoral and cellular immune memory to four COVID-19 vaccines. Cell. 2022;185(14):2434–2451.e17. doi: 10.1016/j.cell.2022.05.022
- Fedele G, Trentini F, Schiavoni I, et al. Evaluation of humoral and cellular response to four vaccines against COVID-19 in different age groups: a longitudinal study. Front Immunol [Internet]. 2022;13. [cited 2023 Jun 12]. Available from: https://www.frontiersin.org/articles/10.3389/fimmu.2022.1021396
- Pettini E, Ciabattini A, Pastore G, et al. A third dose of mRNA-1273 vaccine improves SARS-CoV-2 immunity in HCT recipients with low antibody response after 2 doses. Blood Adv. 2022;6(7):2247–2249. doi: 10.1182/bloodadvances.2021006599
- Pettini E, Medaglini D, Ciabattini A. Profiling the B cell immune response elicited by vaccination against the respiratory virus SARS-CoV-2. Front Immunol [Internet]. 2022;13. [cited 2022 Nov 24]. Available from: https://www.frontiersin.org/articles/10.3389/fimmu.2022.1058748
- Structures of the omicron spike trimer with ACE2 and an anti-omicron antibody. Science [Internet]. [cited 2023 Oct 23]. Available from: https://www.science.org/doi/10.1126/science.abn8863
- Goel RR, Painter MM, Lundgreen KA, et al. Efficient recall of omicron-reactive B cell memory after a third dose of SARS-CoV-2 mRNA vaccine. Cell. 2022;185(11):1875–1887.e8. doi: 10.1016/j.cell.2022.04.009
- Wu M, Wall EC, Carr EJ, et al. Three-dose vaccination elicits neutralising antibodies against omicron. Lancet. 2022;399(10326):715–717. doi: 10.1016/S0140-6736(22)00092-7
- Popowicz GM, Pyrc K, Hadian K. Vaccination versus SARS-CoV-2 omicron: three vaccine doses win the battle. Sig Transduct Target Ther. 2022;7(1):1–2. doi: 10.1038/s41392-022-01000-3
- Garcia-Beltran WF, St Denis KJ, Hoelzemer A, et al. mRNA-based COVID-19 vaccine boosters induce neutralizing immunity against SARS-CoV-2 omicron variant. Cell. 2022;185(3):457–466.e4. doi: 10.1016/j.cell.2021.12.033
- Psaridi L, Maltezou HC, Simonidou S, et al. Neutralizing antibody responses in healthcare personnel after three doses of mRNA BNT162b2 vaccine and association with baseline characteristics and past SARS-CoV-2 infection. Vaccine. 2022;40(40):5752–5756. doi: 10.1016/j.vaccine.2022.08.031
- Sokal A, Broketa M, Barba-Spaeth G, et al. Analysis of mRNA vaccination-elicited RBD-specific memory B cells reveals strong but incomplete immune escape of the SARS-CoV-2 omicron variant. Immunity. 2022;55(6):1096–1104.e4. doi: 10.1016/j.immuni.2022.04.002
- Yang L, Van Beek M, Wang Z, et al. Antigen presentation dynamics shape the antibody response to variants like SARS-CoV-2 omicron after multiple vaccinations with the original strain. Cell Rep. 2023;42(4):112256. doi: 10.1016/j.celrep.2023.112256
- Moss P. The T cell immune response against SARS-CoV-2. Nat Immunol. 2022;23(2):186–193. doi: 10.1038/s41590-021-01122-w
- Schmidt T, Klemis V, Schub D, et al. Immunogenicity and reactogenicity of heterologous ChAdOx1 nCoV-19/mRNA vaccination. Nat Med. 2021;27(9):1530–1535. doi: 10.1038/s41591-021-01464-w
- Maringer Y, Nelde A, Schroeder SM, et al. Durable spike-specific T cell responses after different COVID-19 vaccination regimens are not further enhanced by booster vaccination. Sci Immunol. 2022;7(78):eadd3899. doi: 10.1126/sciimmunol.add3899