
ABSTRACT
The purpose of the present study was to investigate differences in a 100 m breaststroke time-trial between elite and sub-elite swimmers. Elite and sub-elite male swimmers (seven each; 772.1 ± 35.2 and 610.6 ± 24.7 FINA point, respectively) performed 100 m breaststroke, which was recorded by a multi-camera system that provided the mean and time-series velocity data in the glide, pull-out, and clean-swimming segments. The mean velocity in each segment was compared between the groups using an independent-samples t-test (for the 1st lap) and two-way mixed-design ANOVA (for the 2nd—4th laps), which suggested a larger mean clean-swimming (in all laps; 7–11% difference) and glide (in the 2nd and 3rd lap; about 13% difference) velocity for the elite swimmers. The time-series data displayed faster velocity in elite swimmers than in the sub-elite group during the first part (up to 40% time) of the glide segment (p < 0.05). Differences in the clean-swimming segment between the groups were observed (p < 0.001) apart from the first 5–15% time of the segment. No differences in the pull-out and at the beginning of the clean-swimming imply that coaches and swimmers should not assume that a good clean-swimming technique also guarantees fast velocity in these segments.
Introduction
Swimming race analysis plays an important role not only for coaches and swimmers to obtain objective information but also for researchers to acquire scientific knowledge relevant to performance enhancement, which is necessary to establish research questions for further hypothesis-driven studies. Race analyses have often been conducted using video footage from real competitions (Morais et al., Citation2019; Thompson et al., Citation2000; Veiga et al., Citation2016). Researchers have divided a race into several sub-segments (such as the start, clean-swimming, turn and finish) and investigated the mean velocity and time by defining segments using fixed-distance points (Marinho et al., Citation2020; Morais et al., Citation2019). Segment definitions using individual motions, e.g. the breakout from the water, have also been employed to assess the distance of each segment along with the mean segmental velocity and time (Chow et al., Citation1984; Miller et al., Citation1984; Veiga, Cala et al., Citation2014). Investigating competitive performance is valuable as it provides knowledge on the behaviour of swimmers in actual races.
On the other hand, information derived from competitions is somewhat limited because, in many cases, only above-water cameras are used that are usually positioned far from the analysis area. Despite the limitation, recent improvements in the technology and methodologies have enabled researchers to investigate sufficient information on surface swimming, including the velocity, stroke frequency and length in every stroke during races (Simbana Escobar, Hellard, Pyne et al., Citation2018; Simbana Escobar, Hellard, Seifert et al., Citation2018). Yet, most of the extant literature primarily focuses on mean velocity, time, and distance of sub-segments of races, and there is a paucity of information on how swimmers change their velocity profile throughout the race, especially in butterfly, backstroke and breaststroke. Furthermore, due to the difficulty in obtaining underwater time-series data during competitions, detailed information on underwater locomotion during swimming races is limited. Analysing swimming races outside competitions (e.g. in the form of a time trial) is one way to overcome this limitation (Gonjo & Olstad, Citation2021).
The lack of underwater locomotion knowledge is particularly crucial in breaststroke swimming as underwater locomotion is more complex than those in butterfly, backstroke and front crawl. Unlike the three strokes in which the undulatory swimming (dolphin kick) plays a primary role (Takeda et al., Citation2020; Veiga, Mallo et al., Citation2014), the breaststroke underwater phase requires swimmers to perform several different techniques, such as the first glide, one dolphin kick, the arm-pull, the second glide, recovery of the limbs and leg propulsion; the series of motions after the first glide is called the pull-out (Seifert et al., Citation2007). Even though a recent race analysis showed a faster mean velocity in national-level than regional-level swimmers during 100 m breaststroke underwater phases by 0.08–0.12 m/s (Veiga, Cala et al., Citation2014), it is currently unclear whether this was due to a difference in the first glide or the subsequent pull-out phase.
In summary, it is unclear how different levels of swimmers change their velocity profile throughout breaststroke races, particularly during the underwater phase after the start and turns. Therefore, the purpose of the present study was to investigate differences throughout 100 m breaststroke between elite and sub-elite swimmers using time-series velocity data. From the perspective that elite swimmers have better propulsive skills than sub-elite swimmers, it was hypothesised that elite swimmers would show a higher velocity than sub-elite swimmers during the surface swimming and the pull-out phases, in which they perform propulsive limb motions.
Materials and methods
Participants
Fourteen male breaststroke specialists volunteered to participate in the current study. Seven swimmers (age: 20.0 ± 2.4 years; height: 1.85 ± 0.5 m; mass: 82.3 ± 5.2 kg) were recruited as ‘elite swimmers’ who were all finalists of the senior short course national championships in 100 m breaststroke. Their FINA point was higher than 700. The other seven participants (age: 17.7 ± 0.9 years, height: 1.81 ± 0.4 m; mass: 75.1 ± 4.6 kg) were recruited as ‘sub-elite swimmers’ who were also qualified for the senior national championships in the same event but eliminated in the preliminary round. Their FINA point was lower than 650. The mean personal best record of the two groups in the 100 m breaststroke were 60.63 ± 0.94 s and 65.59 ± 0.87 s (corresponding to FINA point of 772.1 ± 35.2 and 610.6 ± 24.7), respectively. The local ethics committee and the National Data Protection Agency for Research approved the procedures, benefits, and potential risks of the study according to the Declaration of Helsinki, and each participant provided written informed consent.
Data collection
Participants performed their personal warm-up routines on land and in the water for up to 60 mins as they usually do prior to regular competitions. Typically, swimmers spent less than 20 minutes on land, and most of the warm-up time was used for in-water exercises. Thereafter, they were required to perform 100 m breaststroke swimming with the goal of finishing the trial in the fastest possible time with a diving start. The time-trial was commenced in the same manner as official competitions (‘take your mark’ instruction followed by an electric signal). The entire trial was recorded and analysed by the AIM race analysis system (AIMSys Sweden AB, Lund, Sweden), which is an automatic race analysis system consisting of five underwater (0.7 m below the water surface) and five above water cameras (5 m above the water surface) at one long-side of the pool with the field of view of 6–8 m (Olstad et al., Citation2020). The swimmers were required to wear a yellow cap, and the 10 cameras continuously tracked the yellow colour to obtain instantaneous head displacement with a sampling frequency of 50 Hz using an image processing technique. The system was synchronised with an electronic Omega timing system (Swiss Timing, Bienne, Switzerland). Detailed calibration algorithms and procedures are reported in Haner et al. (Citation2015). The origins of the two-dimensional coordinate system were the edge of the pool wall on the starting side and the water surface for the horizontal and vertical direction, respectively. The orientation of the vertical and horizontal coordinate axis was upward and swimming direction (directing away from the starting block for lap 1 and 3 and towards the starting block for lap 2 and 4), respectively.
The system also generated panning video footage for each trial consisting of both below and above water views. An investigator checked both the generated numerical data and videos and confirmed that all swimmers completed their trial without violating official FINA rules (such as a false start, a single hand touch or more than one underwater dolphin kick). As the system could only collect data on a single swimmer per trial, all swimmers performed the time-trial individually without other competitors.
Data analysis
The head entry to the water following the on-land start was detected as the instant of the vertical head coordinate changing from positive to negative. The duration from the start signal to the head entry in the 1st lap was defined as the flight time, and the pivot time (the time from the hand touch to the feet contact at the turn) during the 2nd—4th laps were calculated using the electric signals detected by the timing system. The flight distance was also calculated using the horizontal head displacement during the flight time.
Each lap was divided into the glide, pull-out, and clean-swimming segments based on the perspective that these three motions require different locomotion skills (passive locomotion in the water, active locomotion in the water, and active locomotion at or near the water surface). The glide segment was defined as from the head entry after the start (1st lap) or the wall push-off (2nd—4th laps) to the first acceleration of the head after those sequences. The pull-out segment commenced at the end of the glide segment and finished when the swimmer started the backward motion of the hand for the first stroke cycle of the surface swimming (the stroke performed for the transition from underwater to the surface swimming phase), which was detected by an image processing of the AIM system. The clean-swimming segment was defined as the rest of the lap. For all investigated swimmers, the first acceleration after the start and turn (beginning of the pull-out motion) corresponded to the beginning of a dolphin kick.
The forward swimming velocity was defined as the rate at which the horizontal head displacement changed with time. This was obtained for all analysed frames and expressed as both mean and time-series data for each segment. All time-series velocity data were converted to 101 points (0–100) that represented the percentiles of the segment time. The time-series data for the clean-swimming segment were smoothed with the 2nd order Butterworth low-pass filter with the cut-off frequency equalled each swimmer’s mean stroke frequency during each lap. To minimise the endpoint data distortion related to the filtering, 50 extra points beyond the segment were included in the process (the extra points were subsequently excluded after filtering). This filtering strategy was employed because every swimmer had different timings of velocity maxima and minima due to the intra-cyclic velocity fluctuation and individually different cycle time, which created large inter-individual standard deviations in the time-series data and make the comparison between the groups difficult. The smoothing process minimised the effect of these velocity maxima and minima, thereby producing an overall trend of the individual velocity profile.
Statistical analysis
Basic profile information (such as the age, height and body mass of the participants) and all variables obtained for the 1st lap were analysed using an independent-samples t-test. The variables quantified for the 2nd—4th laps (including the pivot time) were assessed using a two-way mixed analysis of variance (ANOVA) with lap and group as within- and between-participant factors. For variables that exhibited a significant main effect(s), multiple comparisons were conducted with a paired or independent sample t-test with the Holm–Bonferroni method for the alpha level adjustment (Holm, Citation1979). Data normality was checked with the Shapiro–Wilk test, and the variables with non-normal distribution were converted using the Box-Cox transformation (Osborne, Citation2010) to apply parametric testing methods. The t-test and ANOVA were performed with IBM SPSS Statistics 24 (IBM Corporation, Somers, NY, USA) with α = 0.05, and the Holm-Bonferroni correction and the Box-Cox transformation were completed with a purpose-made programme on MATLAB R2019a (MathWorks, Inc., Natick, MA, USA). For further analysis using the time-series velocity data in each segment, a statistical parametric mapping (SPM) constituted by t-statistics (Pataky, Citation2010) was employed for between-groups comparison. The SPM analyses were done using the SPM1D package (version 0.4.3, https://spm1d.org/) on the bespoken MATLAB with α = 0.05.
Results
There were no statistical age and height differences between the groups (p = 0.06 and 0.26, respectively), but the body mass was approximately 7 kg larger in elite than sub-elite swimmers (p = 0.03). The elite swimmers completed the time-trial faster than the sub-elite swimmers (61.72 ± 1.02 vs 67.40 ± 0.95 s, p < 0.001). These records corresponded to 98.4 ± 0.73% (elite) and 97.5 ± 1.4% (sub-elite) of their personal record, without a statistical difference (p = 0.17) in the percentage.
Results from detailed race analyses are presented in . During the 1st lap, elite swimmers achieved a longer flight distance than the sub-elite swimmers despite the similar flight time. No differences were observed in the glide and pull-out segments in the 1st lap between the groups, but the elite swimmers swam a shorter clean-swimming distance with a higher mean clean-swimming velocity than the sub-elite swimmers, resulting in a shorter duration of this segment.
Table 1. Descriptive and parametric statistics for zero-dimensional variables obtained in the current study.
From the 2nd to the 4th lap, the main effect of group was observed in the clean-swimming duration, distance, and mean velocity as well as the mean glide velocity. In the clean-swimming segment, multiple comparisons detected differences between the groups in the mean velocity and duration (higher and shorter in the elite group) on all three laps, but not in the distance travelled. The elite swimmers showed higher glide velocity than the sub-elite swimmers during the 2nd and 3rd lap, but no difference in the mean glide velocity was found during the 4th lap.
The main effect of lap was found in many variables, including the duration of the pull-out, clean-swimming, and pivot; clean-swimming distance; and the mean velocity in the glide and clean-swimming segments. Generally, the main effect of lap on the clean-swimming segment was more evident (both groups showed a reduction in the velocity and increased duration as the trial proceeded) than the effect on the other two segments. No interaction between group and lap effects was found in any variable.
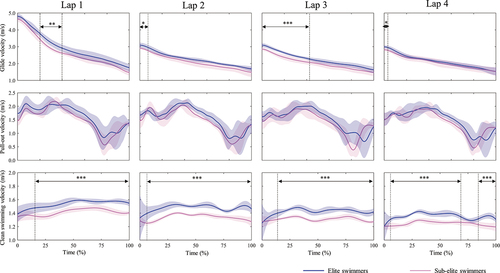
Time-series velocity comparison between the groups during each segment are displayed in . In all laps, the elite swimmers showed a faster velocity than the sub-elite swimmers during a large part of the clean-swimming velocity (p < 0.001), but the difference was not exhibited at the beginning of the segment. During the 1st lap, the glide velocity was faster in the elite than the sub-elite group from approximately the 20th to the 40th percentile of the segment time (p < 0.01), while from the 2nd to the 4th lap, the difference was observed at the beginning of the segment (p < 0.05 for the 2nd and 4th lap; p < 0.001 for the 3rd lap). No difference was observed in the pull-out velocity at any point of the segment during the trial.
Figure 1. Results from statistical parametric mapping tests for one-dimensional (time-velocity) data. Shaded area shows inter-participants standard deviation, and *, **, and *** display a range of difference between the groups with p < 0.05, p < 0.01, and p < 0.001, respectively.
Discussion and implications
The current study aimed to compare 100 m breaststroke time-trial performance between elite and sub-elite swimmers, hypothesising that the elite group would show a better performance in the pull-out and clean-swimming segments. As expected, elite swimmers had a larger mean clean-swimming velocity than sub-elite swimmers in all laps due to the shorter clean-swimming duration. On the other hand, no differences between the levels were observed in the pull-out segment variables. Thus, only a part of the initial hypothesis was supported.
The elite swimmers generally showed a faster mean glide velocity after the turns compared with the sub-elite swimmers. Even though the difference in the glide phase during lap 1 was not significant (p = 0.06), this result should be treated with caution as the sample size of the current study was limited, which was related to a risk of Type II error due to low statistical power. Considering that the p-value was very close to the alpha level, it is possible that the non-significant result was due to Type II error. Given that time-series data analysis with SPM detected a higher forward velocity around 20–40% of the glide phase in lap 1 with no difference in the rest of the segment, it is likely that elite swimmers had a faster mean velocity than sub-elite swimmers in this phase, despite the non-significant mean velocity result with the t-test. The ANOVA did not provide any interaction between the factors, suggesting that there were no differences in the race pattern between the two groups. As the focus of the current study was to assess group differences, detailed lap effects are not discussed in this paper.
SPM analyses highlighted detailed differences between the groups in each segment except for pull-out. During the glide after every turn, the elite swimmers showed a faster velocity at the beginning of the segment than the sub-elite swimmers, suggesting a larger push-off velocity in the elite group. This is reasonable as the initial velocity is an important factor for the gliding performance (Naemi et al., Citation2010; Naemi & Sanders, Citation2008). The difference might be due to distinct anthropometry between the groups. Elite swimmers had 7 kg heavier body mass than sub-elite swimmers while no difference was detected in height, which might suggest a larger amount of muscles, and consequently, greater muscular strength, in the elite group.
However, it should be noted that a direct relationship between muscular strength and push-off performance is still unclear. Studies have reported positive effects of on-land jump training on, or positive relationships of on-land jump with, turn performances such as the glide speed and 5 m time after the turn (Cronin et al., Citation2007; Keiner et al., Citation2019; Potdevin et al., Citation2011). On the other hand, Keiner et al. (Citation2019) reported that the 5 m time was not related to absolute and relative (to the body mass) 1 RM squat, meaning that the turn performance might be related to jump techniques but not to the maximum strength itself. Therefore, further studies are necessary to investigate what differentiates the glide performance between elite and sub-elite swimmers.
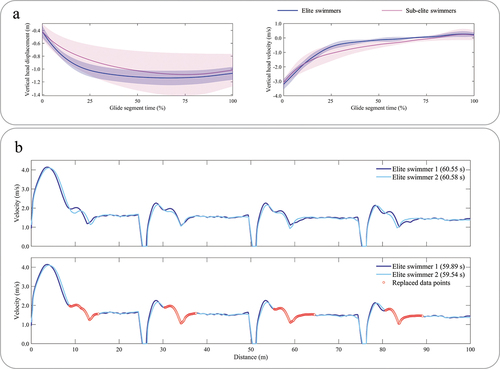
The elite swimmers also showed a faster velocity around the 20th to the 40th percentile of the glide segment after the start, which might be due to the distinct entry techniques of the two groups. By 20% glide time, the elite swimmers finished a large part of their downward motion, which is supported by the vertical head displacement and velocity illustrated in ). On the other hand, the sub-elite swimmers showed flatter patterns in both the vertical displacement and velocity with large inter-individual variability compared with the elite swimmers. This difference might suggest that the elite swimmers employed a strategy of changing their travelling direction quickly at an early stage of the glide segment. Nevertheless, given the trivial differences in mean glide duration, distance and velocity between the groups during the glide segment after the start, the impact of the instantaneous velocity differences in this time period on the segmental performance should not be large.
Figure 2. Descriptive figures for the vertical head displacement and velocity during the glide phase (panel a) and an example of a race modelling using two national-level swimmers (panel b).
The faster clean-swimming velocity in the elite than sub-elite swimmers was not surprising, since similar results such as a negative relationship between the clean-swimming speed and the race time (Thompson et al., Citation2000) or the difference between levels (Hellard et al., Citation2008; Takagi et al., Citation2004) have been observed. In the 2nd to the 4th lap, the faster clean-swimming velocity can explain the shorter segment duration in the elite than sub-elite swimmers as there were no differences in the distance travelled during the segment. Similarly, the shorter duration of the clean-swimming segment can be linked to the faster mean velocity of the elite group during the 1st lap. However, unlike the other laps, the travelling distance of the elite group was shorter than the sub-elite group during lap 1. As there were no differences in the travelling distance in neither the glide nor the pull-out segment, the primary source of the different clean-swimming distance during lap 1 was the longer flight distance in the elite group.
The difference in the flight distance (with no difference in the flight duration) suggests a higher take-off velocity in the elite than in sub-elite swimmers. As the present study analysed the head displacement and not the centre of mass (CM) displacement, another possibility is that the flight distance was merely affected by swimmers’ body angle at the time of the entry (i.e. elite swimmers had a flatter entry angle than sub-elite swimmers). However, given the trend of deeper head displacement right after the entry in the elite than in the sub-elite swimmers and the large inter-swimmer standard deviation in the head trajectory curve displayed in ), it is unlikely that the entry angle systematically affected the flight distance result. Therefore, it is reasonable to conclude that the longer flight distance was due to a larger take-off velocity of the elite swimmers compared with their counterparts.
A new finding in the current study was that the faster mean clean-swimming velocity in the elite swimmers did not mean that they achieved a faster velocity than the sub-elite swimmers throughout the segment. At the beginning of the clean-swimming segment (up to 5–17% time), there was no difference in the forward velocity between the groups. As the clean-swimming segment defined in the current study included the first transition stroke, the similar velocity at the beginning of the segment likely suggests a similar transition stroke performance between the groups.
No statistical differences between the groups were also found in the pull-out segment. This was the only segment in which differences between the groups were not observed in any variables or at any point in the segmental time. This outcome, as well as the similar velocity at the beginning of the clean-swimming segment, were unexpected. In both motions, the primary propulsive action is the leg kick, whose performance should be superior in the elite swimmers compared with the other group as there is a positive relationship between the leg kick propulsive impulse and the breaststroke swimming velocity (Tsunokawa et al., Citation2015). It is unclear why the two groups showed similar swimming velocities in these parts of the trial. The results of the current study might mean that researchers, swimmers and coaches have not fully developed effective pull-out and following transition skills.
The forward velocity throughout the time-trial for two elite swimmers who had almost the same trial time (60.55 and 60.57 s, respectively) are compared in ) to support the argument above (effective pull-out and transition techniques have not been established). To simplify the comparison, the entire velocity data were smoothed with the same strategy for the clean-swimming segment treatment described in the method section, and the velocity during the pivot motion was assumed to be zero. These processes did not affect the overall time as the calculated trial time after the treatment (60.55 and 60.58 s) were almost exactly the same as the original time. The two swimmers showed notable differences from the pull-out to the beginning of the clean-swimming (upper panel of )). When the data points of these parts of each swimmer’s trial were replaced with the fastest data among the two swimmers, the theoretical finishing times for both swimmers became under 60 s (lower panel of )). This theoretical race modelling highlights the potential and importance of breaststroke pull-out and transition. The results of the current study and the race modelling suggest a valuable practical implication; coaches and swimmers should not assume that good surface swimming skills directly result in effective pull-out and transition techniques, and it is important to focus more on these skills to enhance breaststroke performance.
A limitation of the present study that should be discussed is a potential difference in age between the groups. Even though there was no between-group difference in swimmers’ age, p-value was very close to the alpha-level. As discussed earlier in the discussion, non-significant results with a p-value close to 0.05 should be treated carefully in the present study due to the Type II error risk. Nevertheless, the anthropometric characteristics are more influential to swimming performance than the maturation stage (Moura et al., Citation2014), and therefore indirect effects of the age (such as the effect of growth on swimmers’ height and weight) should be considered rather than the absolute age difference. In the present study, the two groups did not have a difference in height with p-value reasonably far from the alpha-level (0.26). Therefore, it is probable that indirect effects of age on biomechanical factors that have strong relationships with height (such as stroke length and hull-speed) were minimal. Furthermore, even though there was a 7 kg difference in body mass between the groups (which indirectly showed a larger muscle mass in the elite group), it was probably due to some other factors than age (such as their training and genetic factors) as an 11-year longitudinal study (Glenmark et al., Citation1994) reported that males did not change their muscle fibre area from adolescence (16 years old) to adulthood. Finally, the use of head data instead of CM should also be noted as a limitation, which nevertheless unlikely affected the main findings in the present study. Differences in linear kinematics between a fixed point of the body and CM are critical when body parts move relative to CM. However, swimmers maintain the streamlined position during the glide segment, meaning that CM and head velocities should be almost identical during this phase. Furthermore, during the clean swimming segment in the present study, the intra-cycle velocity effect was minimised as described in the method section, which means that the time-series clean swimming velocity data were mainly composed of continuous mean cycle velocities. The mean cycle velocity is very similar between CM-based and fixed-point-based calculations (Fernandes et al., Citation2012) because the displacement of the fixed-point relative to CM should be identical between the beginning and the end of a stroke cycle as long as the motion is cyclic. Unlike the clean-swimming part, no adjustment was made during the pull-out segment, which might have affected the inter-individual variability in the time-series velocity data during this phase. However, this does not violate the main finding related to this segment (elite and sub-elite swimmers showed similar pull-out performance), as this finding was also supported by the zero-dimensional variables (distance, duration and mean velocity) of the segment that should not have been affected much by the use of the head instead of CM in the analysis.
Conclusion
In general, elite swimmers are characterised by larger clean-swimming and glide velocity. These differences were particularly evident at the beginning of the glide segment and most of the clean-swimming except for the beginning of this segment. No differences in the pull-out and at the beginning of the clean-swimming phases show that techniques to produce fast clean-swimming speed does not necessarily guarantee fast underwater pull-out and transition stroke velocity.
Disclosure statement
No potential conflict of interest was reported by the author(s).
References
- Chow, J. W. C., Hay, J. G., Wilson, B. D., & Imel, C. (1984). Turning techniques of elite swimmers. Journal of Sports Sciences, 2(3), 241–255. https://doi.org/10.1080/02640418408729720
- Cronin, J., Jones, J., & Frost, D. (2007). The relationship between dry-land power measures and tumble turn velocity in elite swimmers. Journal of Swimming Research, 17, 17–23.
- Fernandes, R. J., Ribeiro, J., Figueiredo, P., Seifert, L., & Vilas-Boas, J. P. (2012). Kinematics of the hip and body center of mass in front crawl. Journal of Human Kinetics, 33(2012), 15–23. https://doi.org/10.2478/v10078-012-0040-6
- Glenmark, B., Hedberg, G., Kaijser, L., & Jansson, E. (1994). Muscle strength from adolescence to adulthood--relationship to muscle fibre types. European Journal of Applied Physiology and Occupational Physiology, 68(1), 9–19. https://doi.org/10.1007/BF00599235
- Gonjo, T., & Olstad, B. H. (2021). Race analysis in competitive swimming: A narrative review. International Journal of Environmental Research and Public Health, 18, 1. https://doi.org/10.3390/ijerph18010069
- Haner, S., Svärm, L., Ask, E., & Heyden, A. (2015). Joint under and over water calibration of a swimmer tracking system. Proceedings of the International Conference on Pattern Recognition Applications and Methods, 2, 142–149.
- Hellard, P., Dekerle, J., Avalos, M., Caudal, N., Knopp, M., & Hausswirth, C. (2008). Kinematic measures and stroke rate variability in elite female 200-m swimmers in the four swimming techniques: Athens 2004 Olympic semi-finalists and French National 2004 Championship semi-finalists. Journal of Sports Sciences, 26(1), 35–46. https://doi.org/10.1080/02640410701332515
- Holm, S. (1979). A simple sequentially rejective multiple test procedure. Scandinavian Journal of Statistics, 6(2), 65–70.
- Keiner, M., Wirth, K., Fuhrmann, S., Kunz, M., Hartmann, H., & Haff, G. G. (2019). The influence of upper- and lower-body maximum strength on swim block start, turn, and overall swim performance in sprint swimming. Journal of Strength and Conditioning Research. Online ahead of print. https://doi.org/10.1519/JSC.0000000000003229
- Marinho, D. A., Barbosa, T. M., Neiva, H. P., Silva, A. J., & Morais, J. E. (2020). Comparison of the start, turn and finish performance of elite swimmers in 100 m and 200 m races. Journal of Sports Science & Medicine, 19(2), 397–407. https://www.ncbi.nlm.nih.gov/pubmed/32390734
- Miller, J. A., Hay, J. G., & Wilson, B. D. (1984). Starting techniques of elite swimmers. Journal of Sports Sciences, 2(3), 213–223. https://doi.org/10.1080/02640418408729718
- Morais, J. E., Marinho, D. A., Arellano, R., & Barbosa, T. M. (2019). Start and turn performances of elite sprinters at the 2016 European championships in swimming. Sports Biomechanics, 18(1), 100–114. https://doi.org/10.1080/14763141.2018.1435713
- Moura, T., Costa, M., Oliveira, S., Junior, M. B., Ritti-Dias, R., & Santos, M. (2014). Height and body composition determine arm propulsive force in youth swimmers independent of a maturation stage. Journal of Human Kinetics, 42(1), 277–284. https://doi.org/10.2478/hukin-2014-0081
- Naemi, R., Easson, W. J., & Sanders, R. H. (2010). Hydrodynamic glide efficiency in swimming. Journal of Science and Medicine in Sport, 13(4), 444–451. https://doi.org/10.1016/j.jsams.2009.04.009
- Naemi, R., & Sanders, R. H. (2008). A “hydrokinematic” method of measuring the glide efficiency of a human swimmer. Journal of Biomechanical Engineering, 130(6), 061016. https://doi.org/10.1115/1.3002764
- Olstad, B. H., Wathne, H., & Gonjo, T. (2020). Key factors related to short course 100 m breaststroke performance. International Journal of Environmental Research and Public Health, 17(17), 6257. https://doi.org/10.3390/ijerph17176257
- Osborne, J. (2010). Improving your data transformations: Applying the box-cox transformation. Practical Assessment, Research, and Evaluation, 15(Article), 12. https://doi.org/10.7275/qbpc-gk17
- Pataky, T. C. (2010). Generalized n-dimensional biomechanical field analysis using statistical parametric mapping. Journal of Biomechanics, 43(10), 1976–1982. https://doi.org/10.1016/j.jbiomech.2010.03.008
- Potdevin, F. J., Alberty, M. E., Chevutschi, A., Pelayo, P., & Sidney, M. C. (2011). Effects of a 6-week plyometric training program on performances in pubescent swimmers. Journal of Strength and Conditioning Research, 25(1), 80–86. https://doi.org/10.1519/JSC.0b013e3181fef720
- Seifert, L., Vantorre, J., & Chollet, D. (2007). Biomechanical analysis of the breaststroke start. International Journal of Sports Medicine, 28(11), 970–976. https://doi.org/10.1055/s-2007-965005
- Simbana Escobar, D., Hellard, P., Pyne, D. B., & Seifert, L. (2018). Functional role of movement and performance variability: Adaptation of front crawl swimmers to competitive swimming constraints. Journal of Applied Biomechanics, 34(1), 53–64. https://doi.org/10.1123/jab.2017-0022
- Simbana Escobar, D., Hellard, P., & Seifert, L. (2018). Modelling stroking parameters in competitive sprint swimming: Understanding inter- and intra-lap variability to assess pacing management. Human Movement Science, 61, 219–230. https://doi.org/10.1016/j.humov.2018.08.002
- Takagi, H., Sugimoto, S., Nishijima, N., & Wilson, B. (2004). Differences in stroke phases, arm-leg coordination and velocity fluctuation due to event, gender and performance level in breaststroke. Sports Biomechanics, 3(1), 15–27. https://doi.org/10.1080/14763140408522827
- Takeda, T., Sakai, S., & Takagi, H. (2020). Underwater flutter kicking causes deceleration in start and turn segments of front crawl. Sports Biomechanics, 1–10. Online ahead of print. https://doi.org/10.1080/14763141.2020.1747528
- Thompson, K. G., Haljand, R., & MacLaren, D. P. (2000). An analysis of selected kinematic variables in national and elite male and female 100-m and 200-m breaststroke swimmers. Journal of Sports Sciences, 18(6), 421–431. https://doi.org/10.1080/02640410050074359
- Tsunokawa, T., Nakashima, M., & Takagi, H. (2015). Use of pressure distribution analysis to estimate fluid forces around a foot during breaststroke kicking. Sports Engineering, 18(3), 149–156. https://doi.org/10.1007/s12283-015-0174-6
- Veiga, S., Cala, A., Frutos, P. G., & Navarro, E. (2014). Comparison of starts and turns of national and regional level swimmers by individualized-distance measurements. Sports Biomechanics, 13(3), 285–295. https://doi.org/10.1080/14763141.2014.910265
- Veiga, S., Mallo, J., Navandar, A., & Navarro, E. (2014). Effects of different swimming race constraints on turning movements. Human Movement Science, 36, 217–226. https://doi.org/10.1016/j.humov.2014.04.002
- Veiga, S., Roig, A., & Gómez-Ruano, M. A. (2016). Do faster swimmers spend longer underwater than slower swimmers at World Championships? European Journal of Sport Science, 16(8), 919–926. https://doi.org/10.1080/17461391.2016.1153727