Abstract
Introduction. Accumulating evidence suggests that an imbalance between pro-angiogenic (i.e., vascular endothelial growth factor (VEGF) and placental growth factor (PlGF)) and anti-angiogenic factors (i.e., soluble VEGF receptor-1 (sVEGFR-1, also referred to as sFlt1)) is involved in the pathophysiology of preeclampsia (PE). Endoglin is a protein that regulates the pro-angiogenic effects of transforming growth factor β, and its soluble form has recently been implicated in the pathophysiology of PE. The objective of this study was to determine if changes in maternal plasma concentration of these angiogenic and anti-angiogenic factors differ prior to development of disease among patients with normal pregnancies and those destined to develop PE (preterm and term) or to deliver a small for gestational age (SGA) neonate.
Methods. This longitudinal nested case–control study included 144 singleton pregnancies in the following groups: (1) patients with uncomplicated pregnancies who delivered appropriate for gestational age (AGA) neonates (n = 46); (2) patients who delivered an SGA neonate but did not develop PE (n = 56); and (3) patients who developed PE (n = 42). Longitudinal samples were collected at each prenatal visit, scheduled at 4-week intervals from the first or early second trimester until delivery. Plasma concentrations of soluble endoglin (s-Eng), sVEGFR-1, and PlGF were determined by specific and sensitive ELISA.
Results. (1) Patients destined to deliver an SGA neonate had higher plasma concentrations of s-Eng throughout gestation than those with normal pregnancies; (2) patients destined to develop preterm PE and term PE had significantly higher concentrations of s-Eng than those with normal pregnancies at 23 and 30 weeks, respectively (for preterm PE: p < 0.036 and for term PE: p = 0.002); (3) patients destined to develop PE (term or preterm) and those who delivered an SGA neonate had lower plasma concentrations of PlGF than those with a normal pregnancy throughout gestation, and the maternal plasma concentration of this analyte became detectable later among patients with pregnancy complications, compared to normal pregnant women; (4) there were no significant differences in the plasma concentrations of sVEGFR-1 between patients destined to deliver an SGA neonate and those with normal pregnancies; (5) patients destined to develop preterm and term PE had a significantly higher plasma concentration of sVEGFR-1 at 26 and 29 weeks of gestation than controls (p = 0.009 and p = 0.0199, respectively); and (6) there was no significant difference in the increment of sVEGFR-1 between control patients and those who delivered an SGA neonate (p = 0.147 at 25 weeks and p = 0.8285 at 40 weeks).
Conclusions. (1) Changes in the maternal plasma concentration of s-Eng, sVEGFR-1, and PlGF precede the clinical presentation of PE, but only changes in s-Eng and PlGF precede the delivery of an SGA neonate; and (2) differences in the profile of angiogenic and anti-angiogenic response to intrauterine insults may determine whether a patient will deliver an SGA neonate, develop PE, or both.
Introduction
Preeclampsia (PE) and small for gestational age (SGA) neonates share several mechanisms of disease, such as chronic uteroplacental ischemia Citation[1-8] and endothelial cell dysfunction Citation[9-15]. However, it is unclear why pregnant women with similar insults develop PE, while others deliver an SGA neonate but do not develop PE. Accumulating evidence suggests that an imbalance between pro-angiogenic factors (i.e., vascular endothelial growth factor (VEGF) and placental growth factor (PlGF)) and anti-angiogenic factors (i.e., soluble VEGF receptor-1 (sVEGFR-1, also referred to as sFlt1) and the soluble form of endoglin (s-Eng)) participates in the pathophysiology of PE. Indeed, patients with PE have higher plasma concentrations of sVEGFR-1 Citation[16-25] and s-Eng Citation[26],Citation[27] and lower plasma concentrations of VEGF Citation[16],Citation[19] and PlGF Citation[16],Citation[19],Citation[28] than patients with normal pregnancies. These differences have been observed before the clinical presentation of PE Citation[19],Citation[21],Citation[27],Citation[29-36].
Endoglin (CD105) is a homodimeric transmembrane glycoprotein, which is considered to be the functional co-receptor for transforming growth factor (TGF)-β1 and TGF-β3 Citation[37-39]. TGF-β induces migration and proliferation of endothelial cells Citation[40]. s-Eng is considered to have anti-angiogenic effects, and shedding has been proposed to account for circulating s-Eng Citation[41]. This anti-angiogenic factor has recently been implicated in the pathophysiology of PE, based on the following observations: (1) s-Eng inhibits endothelial function in vitro; (2) administration of endoglin induces hypertension in vivo; (3) the combined administration of adenovirus encoded with s-Eng and sVEGFR-1 genes to pregnant rats induces hypertension, proteinuria, and fetal growth restriction; (4) endoglin mRNA is up-regulated (3–5-fold) in the placenta of women with PE compared to women without this disorder; and (5) similarly, the endoglin protein expression is increased in placentas from patients with preeclampsia, as demonstrated by Western blot analysis, and localized to the syncytiotrophoblast by immunofluorescence Citation[26].
The objective of this study was to determine if changes in maternal plasma concentration of these angiogenic and anti-angiogenic factors differ prior to development of disease among patients with normal pregnancies and those destined to develop PE (preterm and term) or to deliver an SGA neonate.
Materials and methods
Study design
This longitudinal nested case–control study comprised 144 patients with singleton pregnancies with the following diagnoses: (1) those with uncomplicated pregnancies who delivered appropriate for gestational age (AGA) neonates (controls; n = 46), (2) patients who delivered an SGA neonate (n = 56), and (3) patients who developed PE (n = 42). The latter group was sub-divided into preterm (<37 weeks, n = 16) and term (≥37 weeks, n = 26) PE, according to the gestational age at which PE was diagnosed.
Plasma samples were obtained at the time of each prenatal visit, scheduled at 4-week intervals from the first or early second trimester until delivery. A maximum of 6 samples were collected per patient.
SGA was diagnosed as a birth weight below the 10th percentile for gestational age Citation[42]. PE was diagnosed in the presence of systolic blood pressure ≥140 mmHg or diastolic blood pressure ≥90 mmHg on at least two occasions, 4 hours to 1 week apart, and proteinuria ≥300 mg in a 24-hour urine collection or one dipstick with ≥2+. Patients with PE were classified into ‘preterm’ (<37 weeks) and ‘term’ (≥37 weeks) PE according to the gestational age at diagnosis. All pregnant women signed a consent form approved by the Human Investigation Committee of Sótero del Río Hospital, Santiago-Chile and the Institutional Review Board of the National Institute of Child Health and Human Development.
Sample collection and human s-Eng, sVEGFR-1, and PlGF immunoassays
Blood samples were collected into tubes containing EDTA. The samples were centrifuged and stored at −70°C. Laboratory personnel were blinded to clinical diagnosis. Maternal plasma concentrations of s-Eng, sVEGFR-1, and PlGF were determined by sensitive and specific immunoassays (R&D Systems, Minneapolis, MN, USA). All three immunoassays utilized a sandwich enzyme immunoassay technique and had been validated for plasma determinations of the analytes. The sensitivity and inter- and intra-assay coefficients of variation for each analyte obtained in our laboratory are described in Table SI (Supplemental material, available online).
Statistical analysis
Descriptive analysis
Comparisons among groups were performed using the Mann–Whitney test for continuous variables and Chi-square or Fisher's exact tests for categorical variables.
Longitudinal analysis of angiogenic-related factors
Prospective (forward) and retrospective (backward) analyses were performed to assess the change in plasma concentrations of angiogenic-related factors over time using parametric growth curve models. Prospective analysis considered the changes in plasma analyte concentrations from the initial visit until either the clinical diagnosis of PE or delivery (in cases of SGA and normal pregnancies). Conversely, the retrospective analysis considered the gestational age at which PE was diagnosed or delivery occurred (in cases of SGA and normal pregnancies) as the starting time point, and the changes of analyte concentrations were modeled in decreasing chronological order, to the initial visit.
The growth curve model of each analyte was derived using linear mixed effects models (fixed effects + random effects), which included a polynomial function of the gestational age for the prospective analysis and the number of weeks before the development of disease or delivery for the retrospective analysis. The fixed effect component of the models includes time-dependent (e.g., gestational age) and time-independent (e.g., baseline clinical characteristics) covariates, as well as the clinical diagnosis (normal pregnancy, SGA, and PE). The random effect component of the models examines the deviation of each individual from the average profile of each diagnostic group, which allows adjustment for unknown variability among patients Citation[43].
Growth curve models were fitted to the transformed plasma concentration (log (1 + concentration)) of each analyte adjusting for baseline and clinical risk factors. This log transformation also has a variance stabilization property Citation[44]. This logarithmic transformation was employed to achieve normality. The fixed effect component included diagnosis, body mass index (BMI), maternal age, and up to the fifth order polynomial terms of gestational age or number of weeks before diagnosis or delivery. The random effect component includes the intercept (baseline concentration), linear and quadratic effects of gestational age or number of weeks before diagnosis or delivery. Statistical significance of fixed effects was assessed using F-tests based on ‘robust sandwich estimates for the variance’Citation[43],Citation[45-48], which yields asymptotically consistent covariance matrix estimates without making distributional assumptions, even if the assumed model underlying the parameter estimates is incorrect. Random effects were assessed employing likelihood ratio tests with a mixture of Chi-square distributions Citation[43].
The polynomial order (up to fifth) was determined by the following steps: (1) smoothing the log transformed analyte to identify a growth curve pattern of each diagnosis group, and then fitting a polynomial of a high enough order to capture the previously identified trend and (2) determining the polynomial order by testing on the parameter significance of the highest order term and keeping the order of the highest order of statistical significance. This ensures the polynomial will capture the growth curve trend and yield as little bias as possible.
A piece-wise growth curve model was fitted to maternal plasma PlGF concentration and the PlGF/s-Eng ratio for each diagnostic group. The first part of this model assigned a zero value to the plasma PlGF concentration when this analyte was undetectable in early pregnancy. The second part of the model is a growth curve, which starts at the elevation time. The group-specific elevation time was defined as the gestational age before and at which the PlGF concentration was zero (undetectable concentration), and after which the PlGF elevated to become detectable. The growth curve model was fitted with a fourth order polynomial (with gestational age as an independent variable) to the concentration of PlGF or the PlGF/s-Eng ratio. The group-specific elevation time was then estimated by solving the growth curve polynomial equation for each diagnostic group. A bootstrap method was used to compute the standard error of the estimated elevation time Citation[49]. Hypothesis testing on the differences in the elevation time between diagnosis groups was conducted with a non-parametric statistical permutation test Citation[49].
The statistical package SAS version 9.1 (SAS Institute Inc., Cary, NC, USA) was used for fitting mixed effects models (PROC MIXED), and the statistical package R (version 2.1.1) for the graphical display of the plasma concentration of the analytes during gestation. A p-value of <0.05 was considered significant.
Results
Demographic and clinical characteristics of patients in the three study groups
The demographic and clinical characteristics of the study groups are displayed in . Patients who developed PE (preterm or term) had a significantly higher proportion of nulliparae women than those with normal pregnancies. A significantly lower proportion of smokers were observed in patients who developed PE at term, as compared to those with normal pregnancies ().
Table I. Demographic and clinical characteristics of the study groups (N = 144)
Maternal plasma concentrations of PlGF, s-Eng, and sVEGFR-1 in normal pregnancy
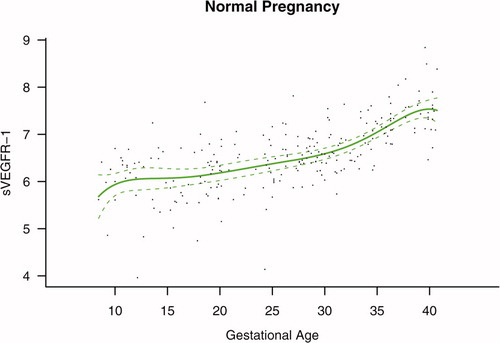
Among patients with normal pregnancy outcome, plasma s-Eng and sVEGFR-1 increased with advancing gestational age. In contrast, plasma PlGF concentrations followed a bell-shaped curve (see –). Figures S1 and S2 display the change in the ratio of both PlGF/s-Eng and PlGF/sVEGFR-1 with gestational age (see Supplemental material). These results are based upon the forward modeling of analyte concentrations as a function of gestational age.
Figure 1. Maternal plasma concentration of soluble endoglin (log(1 + s-Eng)) in normal pregnancies. The solid line represents the mean plasma concentration of s-Eng and the dotted line the 95% confidence interval.
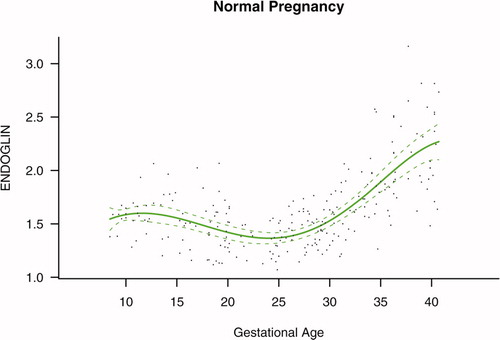
Figure 2. Maternal plasma concentration of placental growth factor (log(1 + PlGF)) in normal pregnancies. The solid line represents the mean plasma concentration of PlGF and the dotted line the 95% confidence interval.
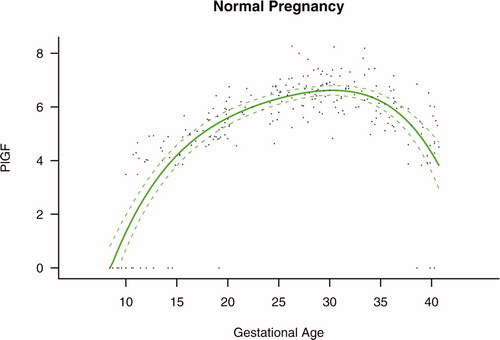
Figure 3. Maternal plasma concentration of soluble vascular endothelial growth factor receptor-1 (log(1 + sVEGFR-1)) in normal pregnancies. The solid line represents the mean plasma concentration of sVEGFR-1 and the dotted line the 95% confidence interval.
s-Eng in PE and SGA neonates
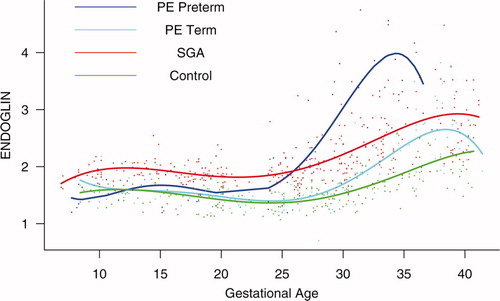
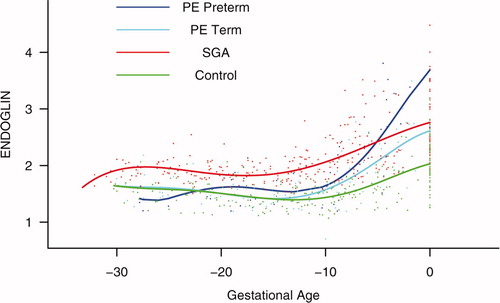
Patients who delivered an SGA neonate had a significantly higher plasma concentration of s-Eng from 10 weeks of gestation onwards than the controls (p < 0.0001; see ). Among women who developed PE, the increment in plasma s-Eng in patients destined to develop preterm PE surpassed that of patients with normal pregnancies at 13 weeks and became significant at 23 weeks (p = 0.036; ). In patients destined to develop PE at term, the maternal plasma concentration of s-Eng became significantly higher than in the case of normal patients at 30 weeks (p = 0.002).
Figure 4. Forward analysis of the maternal plasma concentration of soluble endoglin (s-Eng) in patients with normal pregnancies and those with pregnancy complications. Patients who delivered an SGA neonate had a significantly higher plasma concentration of s-Eng from 10 weeks of gestation onwards than controls (p < 0.0001). The increment in plasma s-Eng in patients destined to develop preterm PE surpassed that of patients with normal pregnancies at 13 weeks and became significant at 23 weeks. In patients destined to develop PE at term, the maternal plasma concentration of s-Eng became significantly higher that that of normal patients at 30 weeks.
Backward analysis indicates that patients destined to deliver an SGA neonate had a significantly higher plasma s-Eng concentration than controls up to 30 weeks before delivery (). In other words, a higher maternal plasma concentration of s-Eng was detectable in these women from the first trimester onwards (). It is noteworthy that the elevation of s-Eng after 25 weeks was more pronounced in the second trimester of pregnancy in patients who developed preterm PE than in those who delivered SGA neonates ().
Figure 5. Backward analysis of the maternal plasma concentration of soluble endoglin (s-Eng) in patients with normal pregnancies and those with pregnancy complications. Patients destined to deliver an SGA neonate had a significantly higher plasma s-Eng concentration than controls up to 30 weeks before delivery.
Placental growth factor in PE and SGA neonates
The maternal plasma concentration of PlGF throughout gestation in normal pregnancy could be described with a curvilinear function in which the concentration increased from the first trimester onwards, peaked at approximately 33 weeks, and decreased slowly toward term ().
Figure 6. Forward analysis of the maternal plasma concentration of placental growth factor (PlGF) in patients with normal pregnancies and those with pregnancy complications. Patients destined to develop PE (term or preterm) and those who delivered an SGA neonate had a lower plasma concentration of PlGF throughout gestation than controls. These differences were statistically significant at 10 weeks of gestation for SGA and term PE and at 11 weeks for preterm PE.
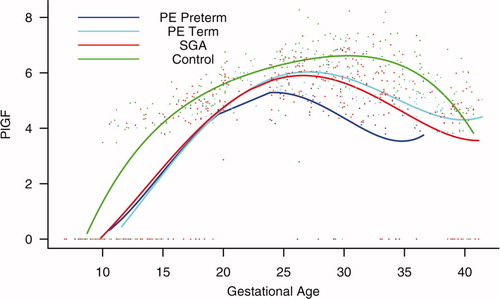
Patients destined to develop PE (term or preterm) and those who delivered an SGA neonate had lower plasma concentrations of PlGF throughout gestation than controls (). These differences were statistically significant at 10 weeks of gestation for SGA and term PE (p = 0.0009 and p < 0.001, respectively) and at 11 weeks for preterm PE (p = 0.0145).
Sixty-nine percent (11/16) of patients destined to develop preterm PE, 69% (18/26) of those destined to develop term PE, as well as 84% (47/56) of patients who delivered an SGA neonate had undetectable plasma concentrations of PlGF in early pregnancy (first and early second trimester). In contrast, only 33% (15/46) of controls had undetectable plasma concentrations of PlGF (p < 0.0001). Plasma PlGF concentration became detectable on average at 10.7 (±0.4) weeks, 9.4 (±1.1) weeks, and 9.7 (±0.4) weeks of gestation in patients with PE at term, preterm PE, and SGA neonates, respectively. Among normal pregnancies, the plasma concentration of PlGF became detectable on average at 8.5 (±0.5) weeks of gestation. Pairwise root comparisons indicated that the PlGF elevation time was significantly different between normal pregnant patients and those destined to develop PE at term (p = 0.0182), but not significantly different between normal pregnancy and preterm PE or SGA (p > 0.05 for both comparisons; see ). Similar results were obtained when comparing the PlGF/s-Eng ratio among study groups, except that there was a significant delay in the elevation time among patients who delivered an SGA neonate compared with normal pregnancy (p = 0.0303) (see ).
Table II. Maternal plasma placental growth factor (PlGF) elevation time
Table III. Maternal plasma placental growth factor/soluble endoglin (PlGF/s-Eng) ratio elevation time
The maternal concentration of PlGF peaked in all pregnant women. The gestational age at which this peak was reached, however, differed dramatically among groups. In women who had a normal pregnancy, the peak was reached after 30 weeks. In contrast, the peak developed at earlier gestational age in patients with complications of pregnancy. Women destined to develop preterm PE displayed such a peak before 25 weeks, whereas in patients destined to have SGA neonates and term PE, such a peak was reached after 25 weeks (approximately 27 weeks; see ).
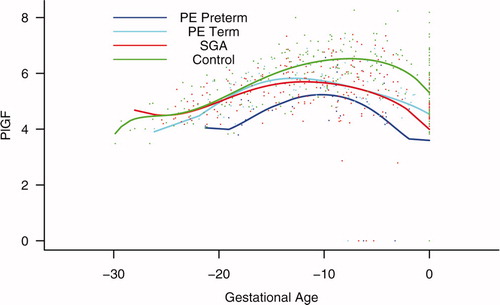
Backward analysis indicated that patients destined to develop preterm and term PE, as well as those destined to deliver an SGA neonate, had a significantly lower plasma PlGF concentration at 12, 20, and 16 weeks, respectively, before the clinical presentation of the disease when compared to controls (p = 0.0485, p < 0.0001 and p = 0.0401, respectively; see ).
Figure 7. Backward analysis of the maternal plasma concentration of placental growth factor (PlGF) in patients with normal pregnancies and those with pregnancy complications. Backward analysis indicated that patients destined to develop preterm PE, term PE, and those destined to deliver an SGA neonate had a significantly lower plasma PlGF concentration at 20, 12, and 16 weeks, respectively, before the clinical presentation of the disease when compared to controls.
sVEGFR-1 in PE and SGA neonates
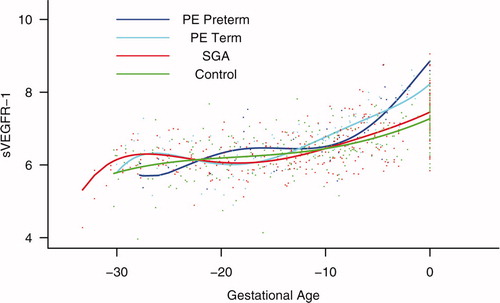
Patients destined to develop preterm and term PE had a significantly higher plasma concentration of sVEGFR-1 at 26 and 29 weeks of gestation than controls (p = 0.009 and p = 0.0199, respectively), and significantly higher concentrations of sVEGFR-1 at 25 and 30 weeks than those destined to deliver an SGA neonate (p < 0.001 and p = 0.0021, respectively). However, there was no difference in the increment of sVEGFR-1 between control patients and those who delivered an SGA neonate (p = 0.147 at 25 weeks and p = 0.8285 at 40 weeks) (). Backward analysis indicated that patients who developed preterm and term PE had a significantly higher plasma sVEGFR-1 concentrations at, respectively, 7 and 11 weeks before the clinical diagnosis of the disease ().
Figure 8. Forward analysis of the maternal plasma concentration of soluble vascular endothelial growth factor receptor-1 (sVEGFR-1) in patients with normal pregnancies and those with pregnancy complications. Patients destined to develop preterm and term PE had a significantly higher plasma concentration of sVEGFR-1 at 26 and 29 weeks of gestation, respectively, than controls. However, there was no difference in the increment of sVEGFR-1 between control patients and those who delivered an SGA neonate.
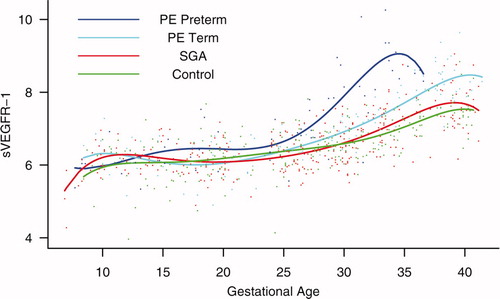
Figure 9. Backward analysis of the maternal plasma concentration of sVEGFR-1 in patients with normal pregnancies and those with pregnancy complications. Patients who developed preterm and term PE had a significantly higher plasma sVEGFR-1 concentration at 7 and 11 weeks, respectively, before the clinical diagnosis of the disease.
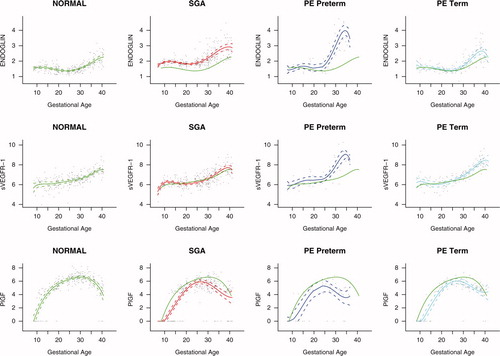
The mean plasma concentration and 95% confidence interval of each analyte in the different pregnancy complications are displayed in . The mean analyte concentration of the normal pregnancy group is added to each plot for comparison.
Figure 10. Mean and 95% confidence interval of the maternal plasma concentration of each analyte (log(1 + analyte)) in patients who developed PE (term and preterm), as well as those who delivered an SGA neonate. The mean analyte concentration of the normal pregnancy group (solid green line) is added to each plot for comparison.
PlGF/endoglin ratio
The maternal plasma PlGF/endoglin ratio throughout gestation in normal pregnancy could be described with a curvilinear function in which the concentration increased from the first trimester onwards, peaked at approximately 28 weeks, and decreased slowly toward term (see Figure S1 in the Supplemental material).
Patients destined to develop PE (term or preterm) and those who delivered an SGA neonate had lower plasma PlGF/endoglin ratios throughout gestation than the controls. These differences were statistically significant at 10 weeks of gestation for SGA (p = 0.0008), preterm PE (p = 0.0341), and term PE (p < 0.0001) (see Figure S3 in the Supplemental material).
Backward analysis indicates that patients who developed preterm PE and those who delivered an SGA neonate had a significantly lower plasma PlGF/endoglin ratio than women with normal pregnancies at 20 weeks before the clinical diagnosis (p < 0.0001 and p = 0.0002, respectively), and 10 weeks before the diagnosis of term PE (p = 0.0002) (see Figure S4 in the Supplemental material).
PlGF/sVEGFR-1 ratio
The maternal plasma PlGF/sVEGFR-1 ratio throughout gestation in normal pregnancy could be described with a curvilinear function in which the concentration increased from the first trimester onwards, peaked at approximately 28 weeks, and decreased slowly toward term (see Figure S2 in the Supplemental material).
Patients destined to develop preterm PE and those who delivered an SGA neonate had lower plasma PlGF/sVEGFR-1 ratios from 15 weeks onwards than controls. These differences were statistically significant at 15 weeks of gestation for SGA (p = 0.01) and preterm PE (p = 0.01), and at 21 weeks onwards for term PE (p = 0.03) (see Figure S5 in the Supplemental material).
Backward analysis indicates that patients who developed preterm and term PE had a significantly lower plasma PlGF/sVEGFR-1 ratio at 20 (p < 0.0001) and 14 weeks (p = 0.01) before the clinical diagnosis, respectively. Patients destined to deliver an SGA neonate had a significantly lower plasma PlGF/sVEGFR-1 ratio at 15 weeks (p = 0.04) before delivery (see Figure S6 in the Supplemental material). Of note, the PlGF/sVEGFR-1 ratio was very similar between patients destined to develop term and preterm PE at 10 weeks before the clinical presentation of these diseases.
Discussion
Principal findings of the study
The key observations of the study are that changes in the concentrations of pro-angiogenic (PlGF) and anti-angiogenic factors (s-Eng and sVEGFR-1) occur prior to the development of the disease in women destined to develop PE. Similar results, but not changes in sVEGFR-1, were observed in those destined to deliver an SGA neonate. Moreover, women destined to deliver an SGA neonate and those destined to develop PE had a lower plasma concentration of PlGF than women with normal pregnancies from the first trimester of pregnancy onwards.
Of major interest is that the pattern of change is different in women destined to develop SGA neonates or PE (preterm or term). Specifically, we found that patients destined to deliver an SGA neonate had a higher plasma concentration of s-Eng than those with normal pregnancies from 10 weeks of gestation onwards. In contrast, patients destined to develop preterm PE and term PE had higher plasma concentration of s-Eng after 24 weeks of gestation. Changes in maternal plasma concentration occurred relatively late in patients who developed preterm and term PE at 26 and 29 weeks, respectively.
PE and SGA: Two distinct phenotypes of an anti-angiogenic state
Our results are consistent with recent reports that PE is associated with an anti-angiogenic state, as demonstrated by high plasma concentrations of sVEGFR-1 Citation[16],Citation[19-21] and s-Eng Citation[26,27], and low plasma or serum concentrations of PlGF Citation[16],Citation[19],Citation[28]. However, our study further demonstrates that patients destined to deliver an SGA neonate show changes in the maternal plasma concentration of s-Eng and PlGF, but not sVEGFR-1, and that these changes differ in timing and magnitude from those of patients destined to develop preterm or term PE.
Placental vascular development: The role of endoglin, PlGF, VEGF, and sVEGFR-1
The regulation of vascular growth and remodeling, also known as angiogenesis, is considered to be central to normal placental and fetal growth and development Citation[50-52]. In the human placenta, angiogenesis has been proposed to be biphasic, with peaks at mid-gestation and at term, resulting from endothelial proliferation early in pregnancy and vascular remodeling in the second half of pregnancy Citation[53].
Angiogenesis is regulated by at least three growth factor families, including: vascular endothelial growth factors (VEGF), angiopoietins, and ephrins Citation[54]. Other factors proposed to regulate angiogenesis include: fibroblast growth factors, transforming growth factors α and β, tumor necrosis factor α, interleukin-8, hepatocyte growth factor, angiogenin, and members of the Notch family Citation[52],Citation[55],Citation[56]. Recent evidence indicates that angiogenesis requires the sequential activation of several receptors, including Tie1, Tie2, and platelet derived growth factor receptor β, by ligands in endothelial and mural cells Citation[57]. However, VEGF signaling represents a critical rate-limiting step in physiological angiogenesis Citation[57].
VEGF family and its receptors
The VEGF are a family of structurally-related dimeric proteins whose members include VEGF-A, VEGF-B, VEGF-C, VEGF-D, and PlGF Citation[56]. The function of VEGF is to promote survival, migration, and differentiation of endothelial cells, as well as mediate vascular permeability Citation[55],Citation[56]. VEGF exerts its biologic effect through VEGFR-2, whereas the precise function of VEGFR-1 is still a subject of debate. Most investigators believe that VEGFR-1 might not be a receptor transmitting a mitogenic signal, but rather a ‘decoy’ receptor that prevents the binding of VEGF to VEGFR-2 Citation[56]. The ‘decoy’ function can be performed not only by the transmembrane, but also the soluble isoform (sVEGFR-1) Citation[56], which is generated by splice variant of VEFGR-1 gene. sVEGFR-1 contains the extracellular ligand-binding, but lacks the signaling tyrosine kinase domain Citation[56],Citation[58] and, thus, is considered to be an anti-angiogenic factor.
A growing body of evidence indicates that vascular growth in the placenta is locally regulated by sVEGFR-1 produced by the placenta. This evidence includes: (1) in situ hybridization studies have demonstrated that sVEGR-1 mRNA is expressed in villous and extravillous trophoblast; (2) sVEGFR-1 protein is present in the supernatant from villous cultures; and (3) sVEGFR-1 has been reported to be present in the serum of patients with uncomplicated pregnancies, but not in non-pregnant women Citation[58]. However, more recent reports indicate that the plasma and serum of healthy non-pregnant individuals have also detectable levels of sVEGFR-1 of monocyte and endothelial cell origin Citation[59], indicating that sVEGFR-1 may contribute to the fine regulation of VEGF bioavailability in both pregnant and non-pregnant women Citation[59]. This fine regulation is of paramount importance as continuous low levels of VEGF are required for endothelial cell proliferation and survival Citation[60]. An additional mechanism by which sVEGFR-1 may regulate the bioavailability of VEGF is the formation of heterodimers with the VEGF receptors in the cell surface, abolishing their signal transduction Citation[59].
Placental growth factor (PlGF)
PlGF is a major member of the VEGF family, which is a ligand for VEGFR-1 that enhances the angiogenic response of VEGF Citation[61],Citation[62]. This has been proposed to be accomplished by: (1) intermolecular cross-talk between VEGFR-1 and VEGFR-2 (transphosphorylation and activation of VEGFR-2 following activation of VEGFR-1 by PlGF); (2) PlGF displacement of VEGF from sVEGFR-1, making more VEGF available to bind VEGFR-2; and (3) PlGF homodimers can destabilize inactive heterodimers of VEGFR-2 and sVEGFR-1, making more VEGFR-2 available for the formation of functional homodimers Citation[61],Citation[62]. Low plasma PlGF concentrations are detectable in non-pregnant women (44 ± 4.7 pg/ml), but the plasma concentration of this pro-angiogenic factor is substantially higher in pregnant women Citation[34].
Endothelial cells release minimal amounts of PlGF but, when activated, produce abundant amounts of PlGF Citation[62]. In addition, other cell types (including vascular smooth muscle cells, inflammatory cells, bone marrow cells, neurons and many tumor cells) also produce PlGF Citation[61],Citation[63-65]. In vitro studies have demonstrated that hypoxia may regulate the expression of PlGF in placental tissues. Indeed, incubation of isolated human term syncytiotrophoblast under hypoxic conditions reduced the mRNA PlGF expression by 75%Citation[66]. Similarly, hypoxia reduced the PlGF concentrations in the supernatant of primary cytotrophoblast cultures Citation[67]. Thus, it is possible that chronic uteroplacental ischemia may account for the low maternal plasma concentration of PlGF in patients destined to develop PE or deliver an SGA neonate.
Endoglin and s-Eng
Endoglin is a functional co-receptor for TGF-β1 and TGF-β3 Citation[37-39]. TGF-β induces migration and proliferation of endothelial cells via the ALK1 pathway. However, TGF-β can have the opposite effect if the ALK5 pathway is activated Citation[40]. Endoglin has been proposed to regulate the balance between these two opposite pathways Citation[40].
Endoglin is primarily expressed in endothelial cells Citation[68], but is also present in macrophages Citation[69],Citation[70], erythroid precursors Citation[71], syncytiotrophoblast Citation[72], activated monocytes Citation[69], and stromal cells Citation[73],Citation[74]. The mechanism by which the soluble form of endoglin is generated is unclear. However, it has been proposed that shedding may account for the circulating s-Eng in normal individuals and those with pathological conditions associated with abnormal angiogenesis Citation[41]. The soluble form of endoglin has been proposed to reduce the bioavailability of TGF-β1, thus inhibiting its signaling pathway Citation[75]. Recently, the anti-angiogenic effect of s-Eng has been confirmed by in vitro experiments, which demonstrated that recombinant s-Eng inhibited endothelial tube formation on Matrigel to the same extent as sVEGFR-1 Citation[26]. Moreover, this anti-angiogenic factor has been reported to contribute to the pathophysiology of PE, as demonstrated by animal experimentation in which the administration of adenoviral expression of s-Eng and sVEGFR-1 in pregnant animals was associated with a nephrotic-range proteinuria, severe hypertension, fetal growth restriction, and biochemical evidence of HELLP (hemolysis, elevated liver enzymes, low platelets) syndrome Citation[26].
Longitudinal studies are required to describe changes over time in angiogenic and anti-angiogenic factors
Most studies conducted to date have focused on the examination of the concentration of many analytes, including angiogenic and anti-angiogenic factors at the time of the diagnosis of the disease. Such studies, however, cannot determine the temporal relationship in the profile of a set of analytes and the clinical onset of the disease; in other words, whether the changes precede or follow the onset of clinical disease. This information is crucial in establishing a cause and effect relationship between analytes and disease states, and exploring whether or not their determination would have predictive clinical value.
Analytical strategies for a longitudinal study of angiogenic and anti-angiogenic factors in pregnancy and their implications for this report
This study was conducted to determine if and when the plasma concentration of three factors involved in the control of angiogenesis changed in patients who subsequently developed PE and SGA. Precise answers to these questions required a longitudinal study, but also the use of statistical methods specifically designed to draw valid inferences in the context of longitudinal analysis.
The key characteristic of a longitudinal study is that repeated observations are made on the same subject. Therefore, the data generated from a subject tend to be intercorrelated Citation[76]. In contrast, cross-sectional studies include each subject only once. Longitudinal studies are powerful research approaches to characterize what are called ‘cohort’ and ‘age’ effects Citation[76],Citation[77]. An age effect is the study of changes sustained by an individual over time (i.e., transformations in the concentration of angiogenic factors with gestational age). A cohort effect refers to the differences among individuals due to baseline characteristics. Longitudinal studies are more effective than cross-sectional studies in examining age and cohort effects Citation[76].
The interdependence of longitudinal data poses statistical challenges derived not only from the lack of cohesion of the observations made about a particular subject, but also the fact that the observations may be taken at different points in time (i.e., gestational age), and some of the observations might be missing Citation[76]. Even though some investigators have analyzed longitudinal data using a cross-sectional approach, such an approach results in loss of statistical power to address specific questions. Although one can argue that large cross-sectional and longitudinal studies analyzed with a cross-sectional approach (e.g., time point analysis) may yield similar results, the crux of the question is often whether or not the study is large enough. Moreover, there is the fundamental issue of whether the results of a cross-sectional analytical approach can be extrapolated to answer inherent longitudinal questions (e.g., growth, which is space over time and, thus, requires a longitudinal design and analysis). Using a cross-sectional analytical approach to longitudinal data could enhance the likelihood of a type I error because of the multiple comparisons conducted in data, which are not independent.
One popular approach in analyzing longitudinal studies is to employ repeated measure analysis of variance. This technique, however, generally assumes that the measurements are taken at equal time points and that no data are missing. Such criteria are rarely met, even in the case of planned studies with human data. Another approach is to use the generalized estimating equations (GEE), where the investigators are interested in the relationship between the response variable (in this study, the concentration of the analytes) and the covariates (i.e., diagnostic group, BMI, nulliparity, etc.), but not in the intra-subject correlation. Since the study of the change in the concentrations of angiogenic and anti-angiogenic factors in the same subject was of primary importance in this study, GEE models were not deemed suitable. The missing data pattern in the study does not meet the requirement of GEE which is ‘missing completely at random’Citation[78]. In this specific study, maternal plasma concentrations for analytes are missing if patients are delivered preterm (SGA or preterm PE). Another approach is the transition Markov model, which relies on previous observations from the same individual and, therefore, is susceptible to missing values.
We have used a general linear mixed effect model (GLMEM) approach because the emphasis of this analytical approach is subject-specific and also provides information about group-effects (i.e., diagnostic category such as SGA, PE, or normal pregnancy). The three key components of GLMEM are: (1) a fixed effect, (2) a random effect, and (3) measurement error. The fixed effect component captures the differences in the mean concentrations of the analytes between diagnostic groups (normal pregnancy, SGA, PE). The random effect examines the deviation of each individual from the average profile of each diagnostic group, and this allows adjustment for unknown variability in the concentration of the analytes among patients. Finally, the measurement error component of the model is estimated from the residuals. The fact that the sandwich estimation of the variance used in this study yields an unbiased estimation of the standard errors of the fixed effects should be emphasized. This assures valid inferences from the analysis.
A particularly challenging statistical aspect of this study was to characterize the behavior of maternal plasma concentration of PlGF. While s-Eng and sVEGFR-1 were detectable through pregnancy in all patients, PlGF was not. In general, PlGF became detectable in the late first trimester of pregnancy, and its concentrations increased with gestational age and subsequently decreased or even became non-detectable before the end of pregnancy. Preliminary analysis indicated that the time at which PlGF became detectable in early pregnancy or non-detectable in late pregnancy contained important information about the membership of a particular patient in a diagnosis group (normal pregnancy, PE, or SGA). To address the question of the detectability of PlGF at a given gestational age and subsequent pregnancy outcome, a piece-wise growth curve model was fitted. This means that a different growth model equation was fitted for different gestational age intervals. Such an approach was required because the concentration of PlGF was not detectable in early pregnancy in at least the first two samples in some women. The conventional mixed effect model would not allow accurate estimations of the parameters in such cases.
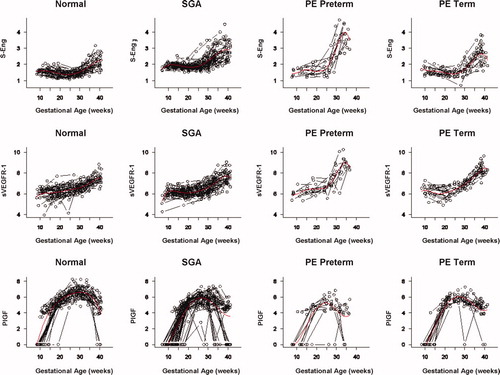
Most figures used to illustrate our results displayed the modeled concentrations of the angiogenic-related factors as a function of gestational age. However, we have shared all data points with the readers by presenting the raw observations for each patient in Figure S7 of the Supplemental material. Our discussion will focus on the model-based figures, as they represent the most accurate summary of the data. The scientific strength and advantages of employing longitudinal methods of analysis rather than a cross-sectional analytical approach for this type of study are now well understood by members of the statistical community.
An elevated concentration of maternal plasma s-Eng in the first trimester predisposes to the delivery of an SGA neonate
An anti-angiogenic state has been implicated as a mechanism of disease in PE Citation[16],Citation[19],Citation[20],Citation[27]. However, recent evidence suggests that it may be a mechanism of disease in other obstetrical syndromes as well, such as fetal death Citation[79], mirror syndrome Citation[80], and SGA Citation[20]. Indeed, Levine et al. Citation[27] reported that normotensive patients who delivered an SGA neonate have a higher maternal serum concentration of s-Eng compared to controls beginning at 17 to 20 weeks of gestation, and that that difference was higher at 37 to 42 weeks. The observation reported herein that mothers destined to deliver an SGA neonate had higher plasma concentrations of s-Eng in the first trimester of pregnancy than patients who had a normal pregnancy and also patients who developed PE (preterm and at term) is novel and noteworthy for several reasons. First, it indicates that a chronic anti-angiogenic state may exist in early pregnancy and may be detectable by measuring the plasma concentrations of this soluble factor. In contrast to Levine et al. Citation[27], angiogenic and anti-angiogenic factors were measured in plasma rather than serum. We believe that plasma is more likely to truly reflect the circulating anti-angiogenic state rather than serum, which contains factors liberated ex vivo from the platelets. Second, the profile of maternal plasma concentrations of s-Eng is dramatically different among patients who subsequently developed SGA and PE. Specifically, the mean concentration of s-Eng became significantly higher in patients destined to develop preterm PE at 23 weeks than that of patients destined to deliver an SGA neonate (and at 30 weeks in those destined to develop PE at term). Third, it is of interest that the maternal plasma concentration of s-Eng remained higher through the entire duration of pregnancy in women destined to deliver an SGA neonate than in those who had a normal pregnancy. Further studies are required to determine the clinical value of such determinations in the prediction of both SGA and PE. Backward analysis indicates that a significant elevation in the plasma concentration of s-Eng is detectable at 30 weeks before delivery in SGA, and at 10 weeks before the diagnosis of preterm and term PE. These observations have implications for the timing of blood sampling for prediction purposes.
Maternal plasma sVEGFR-1 in PE and SGA
Maynard et al. Citation[16] reported the central observation that sVEGFR-1 participates in the pathophysiology of PE, and Levine et al. Citation[19], as well as Chaiworapongsa et al. Citation[21], demonstrated that the maternal plasma concentrations of this anti-angiogenic factor increase at 5 to 10 weeks prior to the development of the disease. The findings in the current study show that maternal plasma concentrations of sVEGFR-1 increased prior to the diagnosis of PE ( and ), and that a significant difference was detected at 7 weeks prior to the diagnosis of preterm PE and at 11 weeks prior to the diagnosis of term PE. It should be noted that we could not demonstrate a difference in the plasma concentration of sVEGFR-1 in patients who delivered an SGA at any point in gestation. We have previously reported that mothers who deliver an SGA neonate have a higher median concentration of sVEGFR-1 than normal pregnant women Citation[20]. An explanation for the different results could lie in the syndromic natures or multiple etiologies of SGA. Our previous results were based on a large number of SGA patients who had abnormal uterine/umbilical artery Doppler velocimetries. Two clear implications of our findings are that changes in the plasma concentrations of sVEGFR-1 are unlikely to have predictive value for SGA (without consideration of Doppler results), and that the changes prior to the diagnosis of PE occurred late in the natural history of the clinical disease.
Placental growth factor in PE and SGA
Our study confirms the findings of Tidwell et al. that the maternal plasma concentrations of PlGF follow a curvilinear profile, which increases for the first trimester toward the beginning of the third trimester, and then demonstrates a slight decrease as term approaches Citation[29]. Moreover, the results of this study are consistent with accumulating evidence that a low maternal plasma concentration of PlGF in the second trimester is associated with the delivery of an SGA neonate Citation[30-32],Citation[81],Citation[82]. Of major interest is that the maternal plasma concentration of PlGF in patients who delivered an SGA neonate or developed PE (term or preterm) was significantly lower than in patients who had a normal pregnancy in the first trimester as well as through the rest of pregnancy. Backward analysis indicated that maternal plasma concentrations of PlGF were significantly lower in patients destined to deliver an SGA neonate at 16 weeks prior to delivery but, importantly, 20 weeks before diagnosis in patients destined to develop preterm PE and 12 weeks before term PE.
A novel observation reported herein is that the time at which PlGF becomes detectable is 8.5 ± 0.51 weeks of gestation in normal pregnancy, with a major delay in patients with pregnancy complications: 9.4 ± 1.1 weeks for preterm PE, 10.7 ± 0.4 weeks for term PE, and 9.8 ± 0.4 weeks for SGA. Collectively, these observations suggest that the maternal plasma concentration of PlGF at early gestational ages may have a major predictive value for both PE and SGA.
Maternal plasma PlGF/s-Eng ratio in PE and SGA
We computed the PlGF/s-Eng ratio to have an index of the balance of angiogenic and anti-angiogenic factors. PlGF was placed in the numerator because its concentrations are sometimes undetectable and a value 0 in the denominator (i.e., s-Eng/PlGF ratio) would render calculation impossible. The profile of the PlGF/s-Eng ratio (see Figure S3 for forward analysis and Figure S4 for backward analysis) was very similar to that of PlGF (see and ). A major finding is that this ratio appears to offer great promise in the prediction of the different disease phenotypes, and comparison with the determination of s-Eng and PlGF alone for classification/prediction purposes is justified.
Maternal plasma PlGF/sVEGFR-1 ratio in PE and SGA
This ratio was not different among women with normal pregnancy and those destined to developed PE (term and preterm) or SGA in the first trimester and early second trimester of pregnancy. Therefore, this ratio is less informative in terms of prediction/classification than the PlGF/endoglin ratio.
The results reported in this study confirm that PE and SGA are conditions associated with an anti-angiogenic state. However, other pregnancy complications are also characterized by an anti-angiogenic state such as placental abruption Citation[83], ‘mirror syndrome’ Citation[80],Citation[84],Citation[85], PE with parvovirus-induced hydrops Citation[86], and unexplained fetal death Citation[79].
Conclusions
Collectively, our results indicate that patients destined to deliver an SGA neonate show changes in the plasma concentration of pro- and anti-angiogenic factors from the first trimester of pregnancy onwards, and these changes differ from those in patients destined to develop preterm or term PE.
Implications
The determination of maternal plasma concentrations of pro- and anti-angiogenic factors in the first trimester of pregnancy may help in the identification of patients destined to deliver an SGA neonate. Thus, it provides the opportunity for prophylactic interventions aimed at correcting and/or preventing fetal growth deceleration.
Supplemental Material
A longitudinal study of angiogenic (placental growth factor) and anti-angiogenic (soluble endoglin and soluble vascular endothelial growth factor receptor-1) factors in normal pregnancy and patients destined to develop preeclampsia and deliver a small for gestational age neonate
Piece-wise growth curve model
A piece-wise growth curve model was fitted to the log-transformed data of placental growth factor (PlGF) and the ratio of PlGF/s-Eng. This is a special statistical piece-wise model, where the response variable is often believed to follow a different pattern in each different domain of the independent variable, such as the log-transformed PlGF changes with the gestation in our study. Since many readings of PlGF in early gestation had an undetectable level of concentration and were assigned a zero value by common clinical practice, a growth curve model from 0 to 40 weeks of gestation will not fit the data well. In fact, the above zero PlGF readings will be outliers if such a growth curve model is assumed for PlGF. To achieve a better fit, we adopted a statistical piece-wise model. The first piece assumes the PlGF level is at 0 in early gestation till certain gestation – called the elevation time that is specific to each prognosis group. The second piece is a growth curve model that starts at the elevation time to become detectable. This model allows the analyte to grow after the elevation time and become detectable (positive reading) and remains 0 before the elevation time. It fits better than a one-piece model since it fits the zero level reading in early gestation and captures the growing trend of the analyte in later gestation.
The elevation time
The elevation time was defined for each diagnosis group so that before this gestation, the analyte was assumed to be 0 before this elevation time, becoming detectable (positive reading) after that. The group-specific elevation time reflects the fact that different diagnosis groups had a different proportion of subjects having an undetectable level of PlGF in early gestation. Since the elevation time was determined by the growth curve of each group after the elevation time, potentially more sensitive assays have a lower level and thus fewer number of undetectable PlGF readings. Thus, the elevation time may decrease with more sensitive assay. However, any assay has its own limitation by the technical design and thus the elevation time is believed to exist no matter what assays are used. Therefore, the elevation time remains an important issue. The late elevation in the small for gestational age (SGA) group and the preeclampsia (PE) group will still remain in relatively the same order.
Table SI. Sensitivity (detection limit) and intra- and inter-assay coefficients of variation of the immunoassays for soluble endoglin, soluble vascular endothelial growth factor receptor-1, and placental growth factor.
Figure S1. Ratio of the maternal plasma concentration of placental growth factor and soluble endoglin (log(1 + PlGF/s-Eng)) in normal pregnancies. The solid line represents the mean ratio of PlGF/s-Eng and the dotted line the 95% confidence interval.
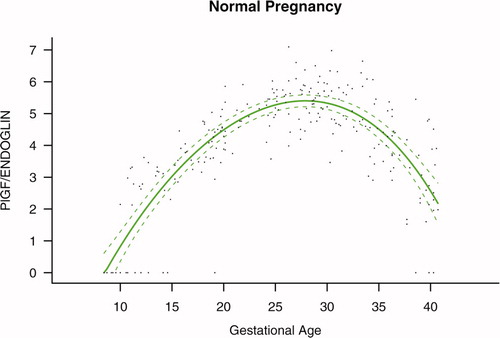
Figure S2. Ratio of the maternal plasma concentration of placental growth factor and soluble vascular endothelial growth factor receptor-1 (log(1 + PlGF/sVEGFR-1)) in normal pregnancies. The solid line represents the mean ratio of PlGF/s-VEGFR-1 and the dotted line the 95% confidence interval.
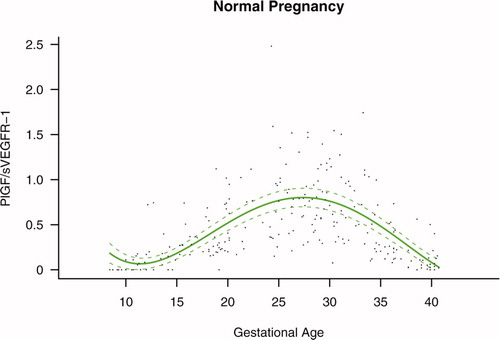
Figure S3. Forward analysis of the maternal plasma concentration of placental growth factor/soluble endoglin (PlGF/s-Eng) ratio in patients with normal pregnancies and those with pregnancy complications. Patients destined to develop preeclampsia (PE; term or preterm) and those who delivered a small for gestational age (SGA) neonate had lower plasma PlGF/s-Eng ratios throughout gestation than controls. These differences were statistically significant at 10 weeks of gestation.
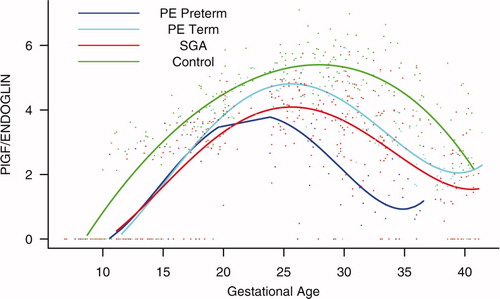
Figure S4. Backward analysis of the maternal plasma concentration of placental growth factor/soluble endoglin (PlGF/s-Eng) ratio in patients with normal pregnancies and those with pregnancy complications. Patients who developed preterm preeclampsia (PE) and those who delivered a small for gestational age (SGA) neonate had a significantly lower plasma PlGF/s-Eng ratio than those with normal pregnancies 20 weeks before the clinical diagnosis, and 10 weeks before the diagnosis of term PE.
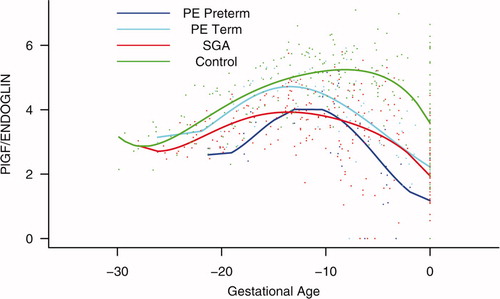
Figure S5. Forward analysis of the maternal plasma concentration of placental growth factor/soluble vascular endothelial growth factor receptor-1 (PlGF/s-VEGFR-1) ratio in patients with normal pregnancies and those with pregnancy complications. Patients destined to develop preterm preeclampsia (PE) and those who delivered a small for gestational age (SGA) neonate had lower plasma PlGF/sVEGFR-1 ratios from 15 weeks onwards than controls. These differences were statistically significant at 15 weeks of gestation for SGA and preterm PE, and at 21 weeks for term PE.
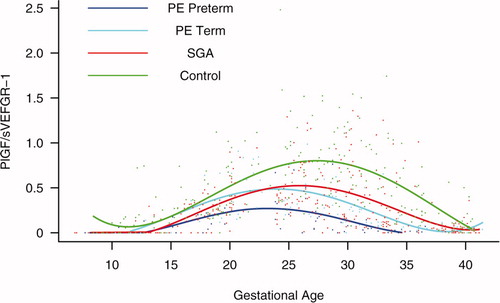
Figure S6. Backward analysis of the maternal plasma concentration of placental growth factor/soluble vascular endothelial growth factor receptor-1 (PlGF/s-VEGFR-1) ratio in patients with normal pregnancies and those with pregnancy complications. Patients who developed preterm and term preeclampsia (PE) had a significantly lower plasma PlGF/sVEGFR-1 ratio 20 and 14 weeks before the clinical diagnosis, respectively. Patients destined to deliver a small for gestational age (SGA) neonate had a significantly lower plasma PlGF/sVEGFR-1 ratio 15 weeks before delivery.
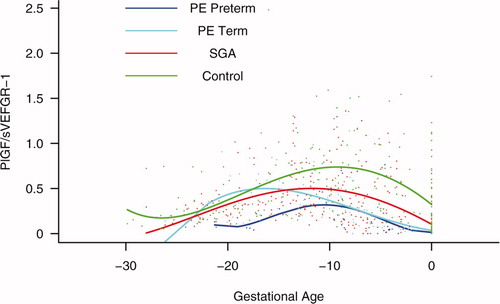
Figure S7. Individual changes in the maternal plasma concentration of soluble vascular endothelial growth factor receptor-1 (sVEGFR-1), placental growth factor (PlGF), and soluble endoglin (s-Eng) in normal patients and those destined to deliver a small for gestational age (SGA) neonate as well as in those destined to develop preterm preeclampsia (PE) and term PE. The dichotomous-looking PlGF values (zero versus non-zero) reflect the undetectable (0 value) concentration of PlGF in early gestation and the detectable concentration (>0) in mid and late gestation. For better model fitting, a piece-wise growth curve model for PlGF was used.
Acknowledgement
This research was supported by the Intramural Research Program of the National Institute of Child Health and Human Development, NIH, DHHS.
Disclosure
Dr. Karumanchi is a co-investigator of patients filed by the Beth Isreal Deaconess Medical Center for the use of angiogenic proteins for the diagnosis and therapy of preeclampsia. Dr. Karumanchi is a consultant to the Johnson & Johnson, Beckman Coulter and Abbott Diagnostics.
References
- Campbell S, Diaz-Recasens J, Griffin D R, Cohen-Overbeek T E, Pearce J M, Willson K, Teague M J. New Doppler technique for assessing uteroplacental blood flow. Lancet 1983; 1: 675–677
- Harrington K F, Campbell S, Bewley S, Bower S. Doppler velocimetry studies of the uterine artery in the early prediction of pre-eclampsia and intra-uterine growth retardation. Eur J Obstet Gynecol Reprod Biol 1991; 42(Suppl)S14–20
- Bower S, Schuchter K, Campbell S. Doppler ultrasound screening as part of routine antenatal scanning: Prediction of pre-eclampsia and intrauterine growth retardation. Br J Obstet Gynaecol 1993; 100: 989–994
- Harrington K, Cooper D, Lees C, Hecher K, Campbell S. Doppler ultrasound of the uterine arteries: The importance of bilateral notching in the prediction of pre-eclampsia, placental abruption or delivery of a small-for-gestational-age baby. Ultrasound Obstet Gynecol 1996; 7: 182–188
- Dekker G A, Sibai B M. Etiology and pathogenesis of preeclampsia: Current concepts. Am J Obstet Gynecol 1998; 179: 1359–1375
- Albaiges G, Missfelder-Lobos H, Lees C, Parra M, Nicolaides K H. One-stage screening for pregnancy complications by color Doppler assessment of the uterine arteries at 23 weeks' gestation. Obstet Gynecol 2000; 96: 559–564
- Papageorghiou A T, Yu C K, Bindra R, Pandis G, Nicolaides K H. Multicenter screening for pre-eclampsia and fetal growth restriction by transvaginal uterine artery Doppler at 23 weeks of gestation. Ultrasound Obstet Gynecol 2001; 18: 441–449
- Papageorghiou A T, Yu C K, Nicolaides K H. The role of uterine artery Doppler in predicting adverse pregnancy outcome. Best Pract Res Clin Obstet Gynaecol 2004; 18: 383–396
- Roberts J M, Taylor R N, Musci T J, Rodgers G M, Hubel C A, McLaughlin M K. Preeclampsia: An endothelial cell disorder. Am J Obstet Gynecol 1989; 161: 1200–1204
- Redman C W, Sacks G P, Sargent I L. Preeclampsia: An excessive maternal inflammatory response to pregnancy. Am J Obstet Gynecol 1999; 180: 499–506
- Poston L, Chappell L C. Is oxidative stress involved in the aetiology of pre-eclampsia?. Acta Paediatr Suppl 2001; 90: 3–5
- Roberts J M, Lain K Y. Recent insights into the pathogenesis of pre-eclampsia. Placenta 2002; 23: 359–372
- Johnson M R, Anim-Nyame N, Johnson P, Sooranna S R, Steer P J. Does endothelial cell activation occur with intrauterine growth restriction?. BJOG 2002; 109: 836–839
- Redman C W, Sargent I L. Latest advances in understanding preeclampsia. Science 2005; 308: 1592–1594
- Ness R B, Sibai B M. Shared and disparate components of the pathophysiologies of fetal growth restriction and preeclampsia. Am J Obstet Gynecol 2006; 195: 40–49
- Maynard S E, Min J Y, Merchan J, Lim K H, Li J, Mondal S, Libermann T A, Morgan J P, Sellke F W, Stillman I E, et al. Excess placental soluble fms-like tyrosine kinase 1 (sFlt1) may contribute to endothelial dysfunction, hypertension, and proteinuria in preeclampsia. J Clin Invest 2003; 111: 649–658
- Koga K, Osuga Y, Yoshino O, Hirota Y, Ruimeng X, Hirata T, Takeda S, Yano T, Tsutsumi O, Taketani Y. Elevated serum soluble vascular endothelial growth factor receptor 1 (sVEGFR-1) levels in women with preeclampsia. J Clin Endocrinol Metab 2003; 88: 2348–2351
- Tsatsaris V, Goffin F, Munaut C, Brichant J F, Pignon M R, Noel A, Schaaps J P, Cabrol D, Frankenne F, Foidart J M. Overexpression of the soluble vascular endothelial growth factor receptor in preeclamptic patients: Pathophysiological consequences. J Clin Endocrinol Metab 2003; 88: 5555–5563
- Levine R J, Maynard S E, Qian C, Lim K H, England L J, Yu K F, Schisterman E F, Thadhani R, Sachs B P, Epstein F H, et al. Circulating angiogenic factors and the risk of preeclampsia. N Engl J Med 2004; 350: 672–683
- Chaiworapongsa T, Romero R, Espinoza J, Bujold E, Mee K Y, Goncalves L F, Gomez R, Edwin S. Evidence supporting a role for blockade of the vascular endothelial growth factor system in the pathophysiology of preeclampsia. Young Investigator Award. Am J Obstet Gynecol 2004; 190: 1541–1547
- Chaiworapongsa T, Romero R, Kim Y M, Kim G J, Kim M R, Espinoza J, Bujold E, Goncalves L, Gomez R, Edwin S, et al. Plasma soluble vascular endothelial growth factor receptor-1 concentration is elevated prior to the clinical diagnosis of pre-eclampsia. J Matern Fetal Neonatal Med 2005; 17: 3–18
- McKeeman G C, Ardill J E, Caldwell C M, Hunter A J, McClure N. Soluble vascular endothelial growth factor receptor-1 (sFlt-1) is increased throughout gestation in patients who have preeclampsia develop. Am J Obstet Gynecol 2004; 191: 1240–1246
- Shibata E, Rajakumar A, Powers R W, Larkin R W, Gilmour C, Bodnar L M, Crombleholme W R, Ness R B, Roberts J M, Hubel C A. Soluble fms-like tyrosine kinase 1 is increased in preeclampsia but not in normotensive pregnancies with small-for-gestational-age neonates: Relationship to circulating placental growth factor. J Clin Endocrinol Metab 2005; 90: 4895–4903
- Staff A C, Braekke K, Harsem N K, Lyberg T, Holthe M R. Circulating concentrations of sFlt1 (soluble fms-like tyrosine kinase 1) in fetal and maternal serum during pre-eclampsia. Eur J Obstet Gynecol Reprod Biol 2005; 122: 33–39
- Robinson C J, Johnson D D, Chang E Y, Armstrong D M, Wang W. Evaluation of placenta growth factor and soluble Fms-like tyrosine kinase 1 receptor levels in mild and severe preeclampsia. Am J Obstet Gynecol 2006; 195: 255–259
- Venkatesha S, Toporsian M, Lam C, Hanai J, Mammoto T, Kim Y M, Bdolah Y, Lim K H, Yuan H T, Libermann T A, et al. Soluble endoglin contributes to the pathogenesis of preeclampsia. Nat Med 2006; 12: 642–649
- Levine R J, Lam C, Qian C, Yu K F, Maynard S E, Sachs B P, Sibai B M, Epstein F H, Romero R, Thadhani R, et al. Soluble endoglin and other circulating antiangiogenic factors in preeclampsia. N Engl J Med 2006; 355: 992–1005
- Torry D S, Wang H S, Wang T H, Caudle M R, Torry R J. Preeclampsia is associated with reduced serum levels of placenta growth factor. Am J Obstet Gynecol 1998; 179: 1539–1544
- Tidwell S C, Ho H N, Chiu W H, Torry R J, Torry D S. Low maternal serum levels of placenta growth factor as an antecedent of clinical preeclampsia. Am J Obstet Gynecol 2001; 184: 1267–1272
- Tjoa M L, van Vugt J M, Mulders M A, Schutgens R B, Oudejans C B, van Wijk I J. Plasma placenta growth factor levels in midtrimester pregnancies. Obstet Gynecol 2001; 98: 600–607
- Chappell L C, Seed P T, Briley A, Kelly F J, Hunt B J, Charnock-Jones D S, Mallet A I, Poston L. A longitudinal study of biochemical variables in women at risk of preeclampsia. Am J Obstet Gynecol 2002; 187: 127–136
- Taylor R N, Grimwood J, Taylor R S, McMaster M T, Fisher S J, North R A. Longitudinal serum concentrations of placental growth factor: Evidence for abnormal placental angiogenesis in pathologic pregnancies. Am J Obstet Gynecol 2003; 188: 177–182
- Thadhani R, Mutter W P, Wolf M, Levine R J, Taylor R N, Sukhatme V P, Ecker J, Karumanchi S A. First trimester placental growth factor and soluble fms-like tyrosine kinase 1 and risk for preeclampsia. J Clin Endocrinol Metab 2004; 89: 770–775
- Krauss T, Pauer H U, Augustin H G. Prospective analysis of placenta growth factor (PlGF) concentrations in the plasma of women with normal pregnancy and pregnancies complicated by preeclampsia. Hypertens Pregnancy 2004; 23: 101–111
- Levine R J, Thadhani R, Qian C, Lam C, Lim K H, Yu K F, Blink A L, Sachs B P, Epstein F H, Sibai B M, et al. Urinary placental growth factor and risk of preeclampsia. JAMA 2005; 293: 77–85
- Parra M, Rodrigo R, Barja P, Bosco C, Fernandez V, Munoz H, Soto-Chacon E. Screening test for preeclampsia through assessment of uteroplacental blood flow and biochemical markers of oxidative stress and endothelial dysfunction. Am J Obstet Gynecol 2005; 193: 1486–1491
- Barbara N P, Wrana J L, Letarte M. Endoglin is an accessory protein that interacts with the signaling receptor complex of multiple members of the transforming growth factor-beta superfamily. J Biol Chem 1999; 274: 584–594
- Lastres P, Letamendia A, Zhang H, Rius C, Almendro N, Raab U, Lopez L A, Langa C, Fabra A, Letarte M, et al. Endoglin modulates cellular responses to TGF-beta 1. J Cell Biol 1996; 133: 1109–1121
- Letamendia A, Lastres P, Botella L M, Raab U, Langa C, Velasco B, Attisano L, Bernabeu C. Role of endoglin in cellular responses to transforming growth factor-beta. A comparative study with betaglycan. J Biol Chem 1998; 273: 33 011–33 019
- Goumans M J, Valdimarsdottir G, Itoh S, Rosendahl A, Sideras P, ten Dijke P. Balancing the activation state of the endothelium via two distinct TGF-beta type I receptors. EMBO J 2002; 21: 1743–1753
- Fonsatti E, Del Vecchio L, Altomonte M, Sigalotti L, Nicotra M R, Coral S, Natali P G, Maio M. Endoglin: An accessory component of the TGF-beta-binding receptor-complex with diagnostic, prognostic, and bioimmunotherapeutic potential in human malignancies. J Cell Physiol 2001; 188: 1–7
- Gonzalez R P, Gomez R M, Castro R S, Nien J K, Merino P O, Etchegaray A B, Carstens M R, Medina L H, Viviani P G, Rojas I T. [A national birth weight distribution curve according to gestational age in Chile from 1993 to 2000]. Rev Med Chil 2004; 132: 1155–1165
- Verbeke G, Molenberghs G. Linear mixed models for longitudinal data. Springer-Verlag, New York 2000
- Sen A, Srivastava M. Unequal variances. Regression analysis theory, methods, and applications, A Sen, M Srivastava. Springer, New York 1990; 111–131
- Huber P J. The behavior of maximum likelihood estimates under nonstandard conditions. Proceedings of the Fifth Berkeley Symposium on Mathematical Statistics and Probability. University of California Press, Berkeley, CAUSA 1967; 221–223
- White H. Maximum likelihood estimation of misspecified models. Econometrica 1982; 50: 1–25
- Liang K Y, Zeger S L. Longitudinal data analysis using generalized linear models. Biometrika 1986; 73: 13–22
- Carroll RJ, Wang S, Simpson DG, Stromberg AJ, Ruppert D. The sandwich (robust covariance matrix) estimator; 1998. Available at: http://www.stat.tamu.edu/ftp/pub/rjcarroll/sandwich.pdf (accessed December 2007)
- Efron B, Tibshirani R. An introduction to the bootstrap. Chapman Hall, New York 2003
- Wulff C, Wilson H, Dickson S E, Wiegand S J, Fraser H M. Hemochorial placentation in the primate: Expression of vascular endothelial growth factor, angiopoietins, and their receptors throughout pregnancy. Biol Reprod 2002; 66: 802–812
- Carmeliet P. Mechanisms of angiogenesis and arteriogenesis. Nat Med 2000; 6: 389–395
- Yancopoulos G D, Davis S, Gale N W, Rudge J S, Wiegand S J, Holash J. Vascular-specific growth factors and blood vessel formation. Nature 2000; 407: 242–248
- Mayhew T M. Fetoplacental angiogenesis during gestation is biphasic, longitudinal and occurs by proliferation and remodelling of vascular endothelial cells. Placenta 2002; 23: 742–750
- Gale N W, Yancopoulos G D. Growth factors acting via endothelial cell-specific receptor tyrosine kinases: VEGFs, angiopoietins, and ephrins in vascular development. Genes Dev 1999; 13: 1055–1066
- Matsumoto T, Claesson-Welsh L. VEGF receptor signal transduction. Sci STKE 2001; 2001: RE21
- Ferrara N, Gerber H P, LeCouter J. The biology of VEGF and its receptors. Nat Med 2003; 9: 669–676
- Ferrara N. Vascular endothelial growth factor: Basic science and clinical progress. Endocr Rev 2004; 25: 581–611
- Clark D E, Smith S K, He Y, Day K A, Licence D R, Corps A N, Lammoglia R, Charnock-Jones D S. A vascular endothelial growth factor antagonist is produced by the human placenta and released into the maternal circulation. Biol Reprod 1998; 59: 1540–1548
- Barleon B, Reusch P, Totzke F, Herzog C, Keck C, Martiny-Baron G, Marme D. Soluble VEGFR-1 secreted by endothelial cells and monocytes is present in human serum and plasma from healthy donors. Angiogenesis 2001; 4: 143–154
- Luttun A, Carmeliet P. Soluble VEGF receptor Flt1: The elusive preeclampsia factor discovered?. J Clin Invest 2003; 111: 600–602
- Autiero M, Luttun A, Tjwa M, Carmeliet P. Placental growth factor and its receptor, vascular endothelial growth factor receptor-1: Novel targets for stimulation of ischemic tissue revascularization and inhibition of angiogenic and inflammatory disorders. J Thromb Haemost 2003; 1: 1356–1370
- Autiero M, Waltenberger J, Communi D, Kranz A, Moons L, Lambrechts D, Kroll J, Plaisance S, De Mol M, Bono F, et al. Role of PlGF in the intra- and intermolecular cross talk between the VEGF receptors Flt1 and Flk1. Nat Med 2003; 9: 936–943
- Beck H, Acker T, Puschel A W, Fujisawa H, Carmeliet P, Plate K H. Cell type-specific expression of neuropilins in an MCA-occlusion model in mice suggests a potential role in post-ischemic brain remodeling. J Neuropathol Exp Neurol 2002; 61: 339–350
- Iyer S, Acharya K R. Role of placenta growth factor in cardiovascular health. Trends Cardiovasc Med 2002; 12: 128–134
- Luttun A, Tjwa M, Moons L, Wu Y, Angelillo-Scherrer A, Liao F, Nagy J A, Hooper A, Priller J, De Klerck B, et al. Revascularization of ischemic tissues by PlGF treatment, and inhibition of tumor angiogenesis, arthritis and atherosclerosis by anti-Flt1. Nat Med 2002; 8: 831–840
- Shore V H, Wang T H, Wang C L, Torry R J, Caudle M R, Torry D S. Vascular endothelial growth factor, placenta growth factor and their receptors in isolated human trophoblast. Placenta 1997; 18: 657–665
- Nagamatsu T, Fujii T, Kusumi M, Zou L, Yamashita T, Osuga Y, Momoeda M, Kozuma S, Taketani Y. Cytotrophoblasts up-regulate soluble fms-like tyrosine kinase-1 expression under reduced oxygen: An implication for the placental vascular development and the pathophysiology of preeclampsia. Endocrinology 2004; 145: 4838–4845
- Gougos A, Letarte M. Identification of a human endothelial cell antigen with monoclonal antibody 44G4 produced against a pre-B leukemic cell line. J Immunol 1988; 141: 1925–1933
- Lastres P, Bellon T, Cabanas C, Sanchez-Madrid F, Acevedo A, Gougos A, Latarte M, Bernabeu C. Regulated expression on human macrophages of endoglin, an Arg–Gly–Asp-containing surface antigen. Eur J Immunol 1992; 22: 393–397
- O'Connell P J, McKenzie A, Fisicaro N, Rockman S P, Pearse M J, d'Apice A J. Endoglin: A 180-kD endothelial cell and macrophage restricted differentiation molecule. Clin Exp Immunol 1992; 90: 154–159
- Buhring H J, Muller C A, Letarte M, Gougos A, Saalmuller A, van Agthoven A J, Busch F N. Endoglin is expressed on a subpopulation of immature erythroid cells of normal human bone marrow. Leukemia 1991; 5: 841–847
- Gougos A, St Jacques S, Greaves A, O'Connell P J, d'Apice A J, Buhring H J, Bernabeu C, Van Mourik J A, Letarte M. Identification of distinct epitopes of endoglin, an RGD-containing glycoprotein of endothelial cells, leukemic cells, and syncytiotrophoblasts. Int Immunol 1992; 4: 83–92
- St Jacques S, Cymerman U, Pece N, Letarte M. Molecular characterization and in situ localization of murine endoglin reveal that it is a transforming growth factor-beta binding protein of endothelial and stromal cells. Endocrinology 1994; 134: 2645–2657
- Rokhlin O W, Cohen M B, Kubagawa H, Letarte M, Cooper M D. Differential expression of endoglin on fetal and adult hematopoietic cells in human bone marrow. J Immunol 1995; 154: 4456–4465
- Calabro L, Fonsatti E, Bellomo G, Alonci A, Colizzi F, Sigalotti L, Altomonte M, Musolino C, Maio M. Differential levels of soluble endoglin (CD105) in myeloid malignancies. J Cell Physiol 2003; 194: 171–175
- Diggle P, Heagerty P, Liang K Y, Zeger S L. Analysis of longitudinal data. Oxford University Press, Oxford 2002; 1–21
- Pahwa P, Blair T. Statistical model for the analysis of longitudinal data; 2002. Available at: http://www.cacr.ca/news/2002/0204pahwa.htm (accessed December 2007)
- Diggle P, Heagerty P, Liang K Y, Zeger S L. Missing values in longitudinal data. Analysis of longitudinal data. Oxford University Press, Oxford 2002; 282–318
- Espinoza J, Chaiworapongsa T, Romero R, Kim Y M, Kim G J, Nien J K, Kusanovic J P, Erez O, Bujold E, Goncalves L F, et al. Unexplained fetal death: Another anti-angiogenic state. J Matern Fetal Neonatal Med 2007; 20: 495–507
- Espinoza J, Romero R, Nien J K, Kusanovic J P, Richani K, Gomez R, Kim C J, Mittali P, Gotsh F, Erez O, et al. A role for the anti-angiogenic factor sVEGFR-1 in the ‘mirror syndrome’ (Ballantyne's syndrome). J Matern Fetal Neonatal Med 2006; 19: 607–613
- Bersinger N A, Odegard R A. Second- and third-trimester serum levels of placental proteins in preeclampsia and small-for-gestational age pregnancies. Acta Obstet Gynecol Scand 2004; 83: 37–45
- Crispi F, Dominguez C, Llurba E, Martin-Gallan P, Cabero L, Gratacos E. Placental angiogenic growth factors and uterine artery Doppler findings for characterization of different subsets in preeclampsia and in isolated intrauterine growth restriction. Am J Obstet Gynecol 2006; 195: 201–207
- Signore C, Mills J L, Qian C, Yu K, Lam C, Epstein F H, Karumanchi S A, Levine R J. Circulating angiogenic factors and placental abruption. Obstet Gynecol 2006; 108: 338–344
- Espinoza J, Nien J K, Kusanovic J P, Richani K, Gomez R, Kim C J, Mittal P, Chaiworapongsa T, Romero R. A role of the anti-angiogenic factor sVEGFR-1 in the ‘mirror syndrome’ (Ballantyne's syndrome). Am J Obstet Gynecol 2005; 193: S134
- Rana S, Venkatesha S, DePaepe M, Chien E K, Paglia M, Karumanchi S A. Cytomegalovirus-induced mirror syndrome associated with elevated levels of circulating antiangiogenic factors. Obstet Gynecol 2007; 109: 549–552
- Stepan H, Faber R. Elevated sFlt1 level and preeclampsia with parvovirus-induced hydrops. N Engl J Med 2006; 354: 1857–1858