Abstract
A mathematical model is formulated to study the evolution of a continuous flotation process; the model yields a lower bound for the long-time deinking efficiency. Some of the theoretical predictions of the model are analysed using data obtained at a recycle mill.
Nomenclature
| 1. | Bo′modified Bond number | ||||
| 2. | C | ||||
| 3. | C Bparameter characterizing the bubble surface mobility | ||||
| 4. | C 1 gas constant | ||||
| 5. | d p particle diameter | ||||
| 6. | Eff(t) global process efficiency at time t, equal to 1 − | ||||
| 7. | erf(x) error function | ||||
| 8. | f fluid flow friction factor | ||||
| 9. | g acceleration due to gravity | ||||
| 10. | g(r) | ||||
| 11. | G dimensionless particle settling velocity | ||||
| 12. | h 0 initial thickness of the film separating a bubble and a particle | ||||
| 13. | h crit film thickness at which the film ruptures spontaneously | ||||
| 14. | k(r) | ||||
| 15. | k 1 forward (attachment) rate parameter | ||||
| 16. | k 2 reverse (detachment) rate parameter | ||||
| 17. |
| ||||
| 18. | K maximum number of particles that can attach to a bubble along an arc, on one hemisphere, of a great circle on the bubble | ||||
| 19. | n B constant (total) bubble concentration | ||||
| 20. |
| ||||
| 21. |
| ||||
| 22. |
| ||||
| 23. |
| ||||
| 24. | n p constant particle concentration | ||||
| 25. |
| ||||
| 26. | n p0 initial concentration of particles ( | ||||
| 27. |
| ||||
| 28. | P the overall probability of the formation of a stable bubble – particle aggregate, ( =P c P asl P tpc P stab), | ||||
| 29. | P asl probability of adhesion by sliding | ||||
| 30. | P c probability of collision between a particle and a bubble | ||||
| 31. | P destab probability of destabilization of a bubble – particle aggregate | ||||
| 32. | P stab probability of stability of a bubble – particle aggregate | ||||
| 33. | P tpc probability of the formation of a three-phase contact | ||||
| 34. | r radial distance from the centre of a bubble | ||||
| 35. | R B bubble radius | ||||
| 36. | R p particle radius | ||||
| 37. | Re B bubble Reynolds number | ||||
| 38. |
| ||||
| 39. | Re p particle Reynolds number | ||||
| 40. |
| ||||
| 41. |
| ||||
| 42. | υB bubble rise velocity | ||||
| 43. | υp particle velocity | ||||
| 44. | υps particle settling velocity | ||||
| 45. | Z collision frequency divided by the number of bubbles available to capture particles at time t > 0 | ||||
| 46. | Z′ detachment frequency of particles from bubbles | ||||
| 47. | α system parameter mediating the stability of bubble/particle aggregates | ||||
| 48. | γ | ||||
| 49. | ϵ (Kolmogorov) turbulent energy density | ||||
| 50. | θ contact angle | ||||
| 51. |
| ||||
| 52. |
| ||||
| 53. |
| ||||
| 54. | μl fluid viscosity | ||||
| 55. | υl kinematic viscosity | ||||
| 56. | ρ B bubble (gas) density | ||||
| 57. | ρ l fluid density | ||||
| 58. | ρ p particle density | ||||
| 59. | σ surface tension | ||||
| 60. |
| ||||
1 The continuous flotation model
We present, in this paper, a mathematical model, of chemical kinetics type, to describe the overall flotation deinking process. We begin, in section 1, by making explicit those expressions for the microprocess probabilities which are used in the formulation of the relevant kinetic constants; this, in turns, leads to the basic nonlinear ordinary differential equation governing the evolution of free (ink) particles. The relevant model system is solved in section 2 and is followed in section 3 by a theoretical discussion of model predictions, including an explicit lower bound for the asymptotic (i.e., long-time) efficiency of the process. Section 4 is concerned with a description of the experimental methodology that has been employed in the process of conducting flotation deinking trials in a recycle mill in Texas. Finally, in section 5, we compare some of the ‘experimental’ results obtained in the aforementioned trials with the corresponding model predictions, including long-time deinking efficiency.
In modelling continuous flotation processes associated with deinking the balance equation for the concentration of free ink particles can be shown to have the form given by Bloom and Heindel [Citation1]
In (1), k 1 and k 2 are the rate parameters for the forward and reverse reactions respectively; these two parameters depend upon the various microprocess probabilities that constiture the mechanism of bubble – particle aggregate formation and destruction and are functions of the bubble, particle, fluid and system properties. In (1), the rate parameters, both of which have the dimensions of frequency (i.e. s − 1), are given by
By combining (1) with (2a) we observe that
The probability P stab of stability, addresses the stabilization and destabilization of a bubble – particle aggregate. Modifying the work of Schulze [Citation2], we take as the form for P stab
The various other parameters introduced in (4) are defined as follows:
For the probability (P c) of collision and probability (P asl) of adhesion by sliding we use, in this paper, new results which were developed in [Citation4] and [Citation5] respectively for flotation deinking conditions. Beginning with P c, if υp represents the particle velocity, and Re p is the particle Reynolds number given by
In (12) it is still necessary to insert the value of h 0 /h crit ≡ γ; in fact, because of the manner in which Equationequation (12) is derived, γ = γ* (h 0 /h crit) in (12) where the asterisk indicates that we are using that specific value of h 0 /h crit that corresponds to φ0 = φ* ≡ φ*crit. However, in recent work [Citation7], it has been shown that, for the intermediate flow given by Yoon and Luttrell [Citation6], γ*∼1.5 and, furthermore, that (12) may be replaced by
Finally it has been shown by Bloom and Heindel [Citation8] that Z, which mediates the collision frequency, and Z′, the bubble – particle detachment frequency, may be written in the following forms:
As
The work that we present here is in the realm of population balance-type models for flotation which date back to the work of Schuhmann [Citation9]; it is closest in spirit to the work of Schulze [Citation2, Citation3] in that it allows, as we believe no other work in this area does, for the destabilization of bubble – particle aggregates. Almost without exception, other theoretical work on flotation deinking efficiency has involved the study of a particular microprocess probability, for example collision or adhesion as a result of the sliding process, or has looked at one or more of the phenomena underlying such microprocess probabilities, for example thin-film rupture; the work of Bloom and Heindel [Citation1,Citation4,Citation5,Citation8] contains a fairly complete survey of such papers as does the Encyclopedia article [Citation10] by the same authors. A recent exception to the rule noted above occurs in the recent paper by Bloom and Heindel [Citation11] where a comprehensive model of the overall deinking process has been synthesized and experimentally validated in the laboratory, albeit for a semibatch flotation process instead of the continuous flotation deinking process which is employed in an industrial setting and studied here. In the semibatch process described in [Citation11] a WEMCO laboratory flotation cell was employed in which a fixed volume of the liquid – particle mixture is maintained while air is continuously bubbled through the mixture; unlike the situation addressed in the present paper, this is a steady-state process in which the total number of bubbles entering the vessel is identical to the total number of bubbles leaving the flotation cell (per unit time).
In the balance Equationequation (1) for the concentration of free ink particles it was explicitly assumed that only bubbles which do not already have an ink particle attached to them are capable of picking up a particle and removing it from the flotation cell; we now relax this assumption by replacing
Finally, because we no longer assume that the concentration of bubbles with particles attached to them is identical with the concentration of particles attached to bubbles, in the detachment term on the right-hand side of (1) we must replace
The following relations are a direct consequence of the definitions of n B,
We shall study solutions of the system (28) and (29) with the goal of producing an upper bound for
A particularly conservative approach, at this junction, consists, for example, of taking the maximum carrying capacity of a bubble to be the maximum number (K) of particles that can attach to a typical bubble in the flotation cell along an arc (on one hemisphere) of a great circle on the bubble. We note that K is a function only of the radii R p and R B of the particle and bubble respectively; in fact it is easily shown that (2α) K < π so that, in fact, we may take
In order to specify the quantity Λ more precisely we may assume the existence of an experimentally determined distribution function
In (43), x is a non-negative integer which varies from zero up to the maximum carrying capacity of one hemisphere of a typically sized bubble. In order to illustrate the type of results that are possible with an experimentally determined distribution function f (x), we may assume, for example, that f (x) is proportional to a normally distributed random variable with mean
In (32),
The model under consideration is based on the differential inequality (32); this inequality is subject to the constraint that n B and n p are constant as well as to the initial condition (29).
In (32),
Employing the definitions (60) and (61) and replacing γ(t) by Γ(t) = −γ(t) in (59), we obtain
2 Model solutions
To integrate the model system (62a) and (62b) we write (62a) in the form
Remark: In view of the definitions of A and B we have the explicit expressions
Returning to the model system written in terms of x(t), we note that (66) is a separable first-order equation which may be integrated explicitly so as to yield
3 Theoretical model predictions
We write the solution (73) to the initial-value problem (66) and (67) in the form
Now let t* represent the time required for γ(t), the ratio of free ink particles to the (constant) total number of ink particles, to fall to a specified level γ*, γ ∞ < γ* < 1.
Then from (83) we easily compute that
A second measure of the efficiency of the deinking process which we have is represented by the long-time limit of the ratio
4 Experimental methodology
Flotation deinking trials were performed on the B-line at Abitibi's recycle mill in Sheldon, Texas. The B-line consists of a mixing cell, seven primary Ecocells and two secondary cells manufactured by Voith Sulzer. Only two variables, namely the feed flow rate and feed consistency, were varied for the initial experiments. shows the experimental conditions that were varied for the five experiments that were conducted. A total of 17 samples were collected from experiment 1; 12 samples were collected from each of the remaining four experiments. The samples were shipped immediately and stored in a cold room upon arrival. The samples were then tested for consistency, made into handsheets, and used for analysis and dirt count measurements. The analysis and dirt count measurements were performed at the laboratories of Eka Chemicals in Marietta, Georgia, USA.
Table 1. Factors varied during the mill trial.
4.1 Surface tension measurement
Aliquots of the 64 mill samples were filtered through a Whatman No. 4 filter paper and the filtrates were used to determine the surface tension. Approximately 100 ml of the filtrates was collected from each sample. Surface tension was measured using a Cahn DCA 312 apparatus (Wilhelmy plate method). – list the data for the surface tension measurements. It is observed that the surface tension of the overflows is lower than that of the other samples for all the experiments. In general, the range of surface tension values lies between 41 and 44 dyn/cm for all overflows and primary rejects, and between 45 and 50 dyn/cm for all other samples.
Table 2. Surface tension measurements on filtrates from pulp samples: experiment 1.
Table 3. Surface tension measurements on filtrates from pulp samples: experiment 2.
Table 4. Surface tension measurements on filtrates from pulp samples: experiment 3.
Table 5. Surface tension measurements on filtrates from pulp samples: experiment 4.
Table 6. Surface tension measurements on filtrates from pulp samples: experiment 5.
4.2 Handsheet-making procedure
First, the consistency of the pulp samples was determined. The amount of pulp necessary for making a 3 g handsheet was calculated. The desired amount of pulp was transferred to a graduated cylinder and diluted to 1000 ml using deionized water. A 150 mm filter paper was placed in a levelled fritted-glass Buchner funnel and wetted with deionized water from a wash bottle. Suction was applied to seat the filter paper. With no suction applied to the funnel the 1000 ml stock was rapidly poured. Subsequently, suction was applied until all the excess water was removed. The Buchner funnel was inverted over a standard blotter paper, and the test sheet and filter paper were dislodged from the funnel by blowing into the funnel stem. The blotter paper, test sheet and filter paper were placed on a flat surface, covered with an additional blotter paper and couch plate. A couch roll was rolled five times with no pressure being applied except for the weight of the roll, then the couch plate and top blotter were removed, and an indelible pencil was used to identify the test sheet. Next, a sheet of blotter paper was placed on the press. On this blotter was placed a clean drying plate with its polished surface facing upwards. The test sheet with the filter paper was placed face down on the drying plate. Two more blotter papers were then placed on top. The stack (from the bottom) then consisted of one blotter, a drying plate, the test sheet, filter paper and the two blotters. On this stack a clean drying plate for the next test sheet was added. This sequence was continued until eight test sheets were accumulated. Care was taken to centre the drying sheets. The cover was placed over the final stack and tightened. The pressure was raised to 50 1bf/in2g in 30 s and then maintained for an additional 90 s. After removing the press cover, the filter paper was removed from the test sheets. The handsheets were dried using a commercial drum dryer and were then left in a TAPPI humidity- and temperature-controlled environment until analysis.
4.3 Measurement of handsheet properties
An ERIC value is a measure of the ink attachment to the fibres. ERIC values represent an estimate of the amount of ink below 10 μm that is in the fibre. Two handsheets were made for each pulp sample that was obtained from the mill. To obtain an ERIC value, three measurements were made on the top side of each handsheet and three measurements were made on the bottom side of each handsheet. The results were tabulated as the average of the six readings for each side. The ERIC measurements in were performed on a Technidyne Color Touch ISO instrument. The ink scan evaluates the ink particle distribution from 10 to 200 μm. Five measurements were made from the top side of each handsheet and five measurements from the bottom side of each sheet, for a total of 20 measurements per pulp sample. The average of the 20 measurements is reported in . The particles were divided into three size ranges and the overall efficiency for the flotation line was calculated for the three individual size ranges.
Table 7. ERIC measurements on handsheets.
Table 8. Dirt count measurement on handsheets.
4.4 Determination of model parameter values
The data obtained from the five experiments conducted at the recycle mill were compared with the modified model for continuous flotation; as a first step the parameters used in the model had to be identified. The modified model requires 13 parameters to evaluate the long-time deinking efficiency Eff (∞). Many of these parameters were measured and some that could not be measured were input as ‘educated guesses’.
The Density of fluid and the viscosity of the pulp in the model were specified to correspond to those of water. The viscosity of fibre suspensions is known to be highly non-Newtonian and will deviate significantly from that of water. Also, the consistency of the fibre suspension will affect the apparent viscosity of the suspension. The effect of viscosity will be further discussed in the section on model parametric variations.
The particle diameter was fixed at the upper value in the data range. Since a significant portion of the ink particles were determined to be in the 8 – 20 μm size range, the radius of the particles was fixed at 10 μm. The particle density was specified to be 1.2 g/cm3.
The particle concentration was calculated from the dirt count measurements and the consistency of the feed suspension. Because a narrow range of 45 – 50 dyn/cm was measured for most of the samples in all five experiments, the surface tension parameter was assumed to be a constant with a value of 50 dyn/cm. The contact angle, a tough parameter to measure, was set at 60°. The bubble surface mobility CB , was set to a constant value of 1, signifying that the bubbles behaved as rigid spheres.
The power input was computed to be approximately 7.18 W/kg cell for a recycle line processing 300 ton/day at 1.3% consistency (M. Kemper, Voith Sulzer, personal communications 2003); this calculation is presented below. It was assumed that the entire power consumed by the line was converted into turbulent mixing energy. The calculation proceeds as follows. The inlet pressure of an Ecocell is 0.9 bar. The specific power consumption of a standard Ecocell line is about 27 kW h/ton. A standard Ecocell line consists of five primary cells and one secondary cell. About 12.5 ton/h are processed. Thus
The bubble diameter is a parameter that is currently guessed and needs to be measured in a mill setting; this parameter appears in each of the equations that determine the probability of the individual microprocesses. Flash X-ray radiography is not suitable for measuring bubble diameter in a mill environment and an alternate technique has to be utilized. An optical method described by O'Connor et al. [Citation12] and Hunold et al. [Citation13] is a good candidate for initial investigation. Using (6) an R B,max of 1.1194 mm may be computed as follows. As 1 W/kg = 104 cm2/s3, ϵ = 7.18 W/kg = 7.18 × 104 cm2/s3. For ρ l we take a value of 1 g/cm3 while σ is estimated at 50 dyn/cm. Since 1 dy = 1 g cm/s2 we have σ = 50 g/s2. Solving (6) for R B,max we find that
The two remaining parameters are
5 Some model predictions
In this section we present some model predictions based on the data reported in section 4. It is important to note that we do not view the results presented below as being indicative of the kind of more complete study that would be needed for ‘industrial’ validation of the model. Experimental flotation efficiencies (of ink particles in the 8 – 20 μm range) for the five experiments at the mill varied between 85 and 90%; the upper limit of the size range was used as the particle diameter in the model. Data from experiment 1, wherein standard operating conditions were maintained, was used to determine the value of the fitting parameter α. Maintaining α fixed, the predicted efficiencies of the other experiments were computed. Similar comparisons were made for the deinking efficiency of particles in the 24 – 52 μm range. The bubble radius was set at 0.75 mm for all the comparisons. lists the values of the parameters that were used in the parametric study. In the figures and discussion that follow it is assumed that all parameters, except the parameter being varied, are fixed at the values given in . lists the comparison of the experimental data with the long time deinking efficiency predicted by the mathematical model.
Table 9. Parameter values used in calculating the predicted long-time efficiency.
Table 10. Comparison of experimental and predicted efficiencies.
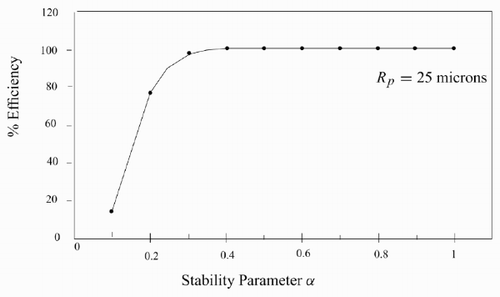
shows the effect of parameter α on the long-time deinking efficiency. It is interesting to note that there are two ranges within which the efficiency is independent of α. The lower range 0.2 < α < 0.5 predicts 100% efficiency for the removal of particles with a radius of 10 μm. The 0.6 < α < 1 range predicts an efficiency of 34% for the same particles. In we see the effect of the parameter α on the flotation of ink particles with a radius of 25 μm by bubbles with a radius of 0.75 mm. Here the efficiency increases with increasing α values and attains 99% at an α value of 0.3.
Figure 1. Effect of the parameter α on the predicted long-time efficiency (R p = 10 μm).
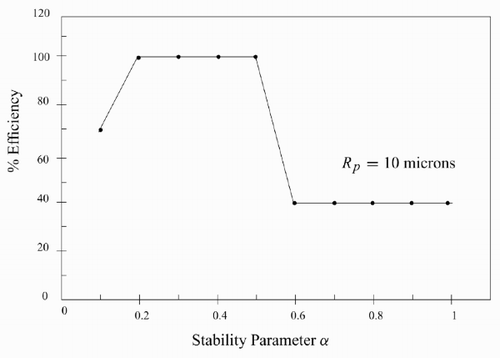
Figure 2. Effect of the parameter α on the predicted long-time efficiency (R p = 25 μm).
As the modified Bond number Bo ′ is a monotonically increasing function of Rp (see (4)) the behaviour displayed here indicates (in view of the expression adopted for P stab in (3)) that the stability parameter α is also a function of R p, and probably of R B as well, as has already been noted in section 1. The precise nature of the dependence of α on the particle and bubble radii has yet to be addressed. It is entirely possible that α exhibits a dependence on other factors as well, for example the turbulent energy density ϵ.
Variations in the turbulent energy density ϵ influence the predicted removal efficiency through the collision rates and the probability of stability. shows the dependence of the efficiency on ϵ for α values of both 0.2 and 0.7.
Figure 3. Turbulent energy density versus percentage efficiency for α equal to 0.2 and 0.7 respectively.
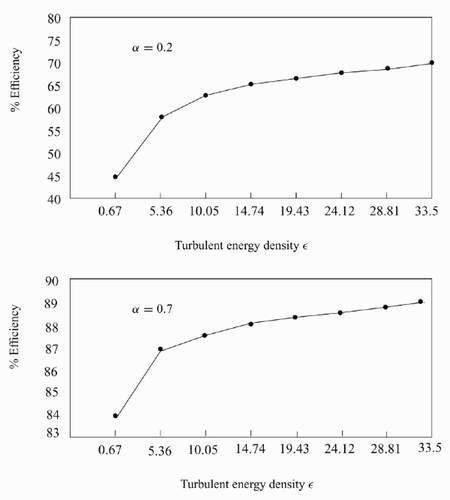
It is clear that, in both cases in , the efficiency is a monotonically increasing function of turbulent energy density which is not an unexpected result in view of the role that increasing ϵ has in facilitating particle – bubble collisions. As ϵ also plays a role in destabilizing particle – bubble aggregates, the implication is that the favourable impact of an increasing ϵ on particle – bubble collision supersedes its negative impact on the stability of particle – bubble aggregates.
The bubble radius has a variable influence on the long-time efficiency. For the value of α = 0.2 in a bubble larger than 0.90 mm in radius has a negligible effect on the removal efficiency for particles with an R p of 10 μm.
Figure 4. Dependence of the predicted long-time efficiency on the bubble radius R B.
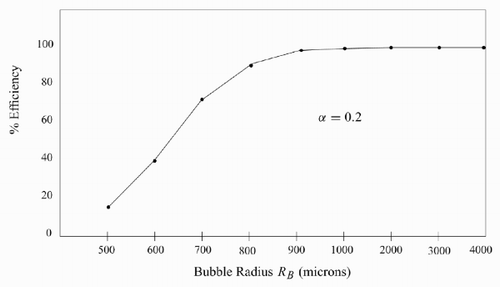
As an increasing bubble radius R B, with fixed particle radius R p, tends to facilitate particle – bubble collisions, adhesion by sliding, and the stability of particle – bubble aggregates, the monotonic increase in efficiency with increasing bubble radius displayed in is to be expected. For very large R B the detrimental effect of increasing R B on, for example, υB could possibly explain the levelling off of the graph in .
shows the effect of the particle radius R p on the long-time efficiency. A high efficiency is predicted by an α of 0.2 at R p 10 μm, but the efficiency drops significantly for higher values of R p. For an α value of 0.7 the efficiency rises sharply for particles larger than 10 μm and decreases slightly for particles larger than 75 μm.
Figure 5. Dependence of the predicted long-time efficiency on the particle radius R p.
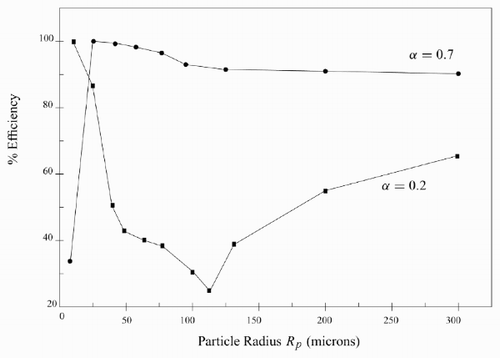
As was the case for the results displayed in and , the unusual behaviour displayed in may not be explainable on physical grounds until a better understanding of the dependences inherent in α are understood.
Experimentally, the feed consistency and feed flow rate were the two factors that were varied during the mill trials. Both of these parameters are not directly required for testing the model. Consistency will be related to the viscosity parameter in the model and a search of the literature should provide a mathematical relationship relating viscosity to consistency, but this has not yet been carried out. A parametric study of viscosity, holding all the other parameters at the values given in , is shown in . The experimental efficiency is shown as the full circle. The predicted long-time efficiency decreases almost linearly with increasing viscosity.
Figure 6. Effect of the viscosity on the predicted long-time efficiency.
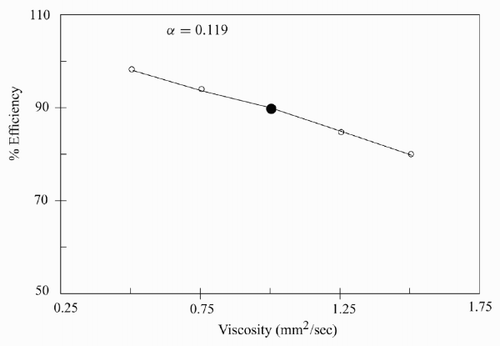
An increase in viscosity υl results in a decrease in the bubble Reynolds number Re B and, almost certainly, a decrease in the particle settling velocity, both of which, by virtue of (8), impact the probability P c of collision in a negative way; the effect of a decrease in υl on P asl and P stab are not as clear and represent an issue that requires further study.
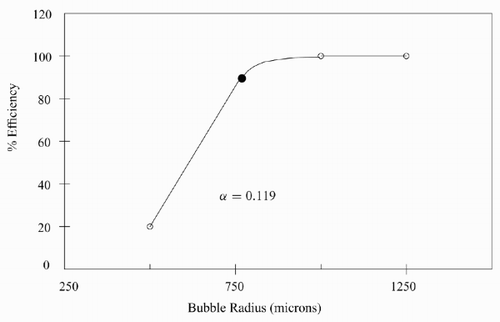
It is widely accepted that there is bubble coalescence at higher consistencies. The effect of bubble coalescence might dominate over the increase in viscosity. shows the change in efficiency due to the increase in bubble radius. The experimental efficiency is denoted by the full circle. For a fixed particle radius, an increase in bubble radius leads to an asymptotic increase in efficiency, which is consistent with the similar result shown in .
Figure 7. Effect of the bubble radius on the predicted long-time efficiency for α = 0.119.
The two main conclusions which follow from the work presented here are the following.
The continuous flotation model shows great promise for being able to predict industrial recycle mill efficiencies if the remaining ‘gaps’ in the model can be closed, specifically the measurement of bubble size, the functional form of the stability parameter α and the relationship between consistency and viscosity. | |||||
Once these ‘gaps’ in the model are closed the model can also be used to optimize mill performance; that is, it can be used to predict, for example, the optimal bubble size to use for particles sizes (in a specific range) so as to maximize long-time efficiency. The model may also be used to determine efficiency at conditions beyond the regime of current equipment. | |||||
Acknowledgments
The author wishes to acknowledge the support of the Institute of Paper Science and Technology of the Georgia Institute of Technology, Atlanta, Georgia, during the period when the research leading to this paper was conducted; the author is especially grateful for the help provided by Dr Suresh Shrauti, who conducted the experimental trials, and to the staff of the Abitibi recycle mill in Sheldon, Texas, for their cooperation during the period when those trials were performed.
References
References
- Bloom , F and Heindel , TJ . 1997 . Mathematical modeling of the flotation deinking process . Mathematical and Computer Modelling , 25 : 13 – 58 .
- Schulze HJ 1993 Flotation as a heterocoagulation process: possibilities of calculating the probability of flotation In: B. Dobiáš (Ed) Coagulation and Flocculation pp. 321 – 353
- Schulze , HJ . 1994 . Hydrodynamik der Flotations-Elementarvorgänge . Wochenblatt für Papierfabrikation , 122 : 160 – 168 .
- Bloom , F and Heindel , TJ . 1999a . New exact and appropriate expressions for the microprocess probability of collision in flotation . Journal of Colloid and Interface Science , 213 : 101 – 111 .
- Bloom , F and Heindel , TJ . 1999b . An approximate analytical expression for the probability of attachment by sliding . Journal of Colloid and Interface Science , 218 : 464 – 577 .
- Yoon , RH and Luttrell , GH . 1989 . The effect of bubble size on fine particle flotation . Mineral Processing and Extractive Metallurgy Review , 5 : 101 – 122 .
- Bloom , F . 2005 . Estimating the probability of attachment by sliding in flotation processes . Nonlinear Studies , 12 : 177 – 198 .
- Bloom , F and Heindel , TJ . 2002 . On the structure of collision and detachment frequencies in flotation models . Chemical Engineering Science , 57 : 2467 – 2473 .
- Schuhmann , R . 1942 . Flotation kinetics . International Journal of Physics and Chemistry , 46 : 891 – 902 .
- Bloom F Heindel TJ 2002 Theory of dispersed air flotation In Encyclopedia of Surface and Colloid Science New York Marcel Dekker pp. 5298 – 5311
- Bloom , F and Heindel , TJ . 2003 . Modelling flotation separation in a semi-batch process . Chemical Engineering Science , 58 : 353 – 365 .
- O'Connor , CT , Randall , EW and Goodall , CM . 1990 . Measurement of the effects of physical and chemical variables on bubble size . International Journal of Mineral Processing , 28 : 139 – 149 .
- Hunold , M , Krauthauf , T , Müller , J and Putz , HJ . 1997 . Effect of air volume and air bubble size distribution of flotation in injector-aerated deinking cells . Journal of Pulp and Paper Science , 23 : 555 – 560 .
Appendix
Some basic concepts of flotation separation
Flotation separation is a process used in many industries to separate one constituent from another. Dispersed air flotation is commonly found in mineral processing (mineral flotation) and paper recycling (flotation deinking). In these processes, relatively large bubbles are formed by mechanical agitation or sparger air injection. Bubble – particle aggregates then form between bubbles and naturally or chemically induced hydrophobic particles. Bubbles with sufficient buoyant force carry the particles to the surface for removal. Dispersed air flotation is a selective process in that it separates, for example, hydrophobic mineral or contaminant particles from gangue or desired fibre in mineral flotation and flotation deinking respectively. In particular, flotation deinking is a separation process used to remove ink and other contaminant particles from reclaimed cellulose fibre. Despite the many differences between mineral flotation and flotation deinking, all flotation cells operate on similar principles. In modern flotation cells, three separate processes take place in tandem:
aeration, where air bubbles are introduced into the system; | |||||
mixing, where bubbles and particles are intimately mixed to maximize bubble – particle interaction; | |||||
separation, where bubbles and bubble – particle aggregates are allowed to separate from the bulk mixture and are skimmed away. | |||||
The modelling of this complex process must be based on the fundamentals of bubble – particle interaction, aggregate formation and aggregate stability. Based on experimental observations, the flotation separation process is thought to be analogous to a chemical reactor which can be described by an ordinary differential equation. In what has become a common assumption in the attempt to develop a model of the flotation process that is independent of the flotation equipment, the overall macroprocess of flotation separation is thought to be composed of a series of microprocesses. These microprocesses include the following:
the approach of a particle to an air bubble and the subsequent interception of that particle by the bubble; | |||||
the sliding of the particle along the surface of the thin liquid film that separates the particle from the bubble, which leads to film rupture; | |||||
upon film rupture, the formation of a three-phase contact between the bubble, particle and fluid; | |||||
the stabilization of the bubble – particle aggregate and its transport to the froth layer for removal from the flotation cell. | |||||
Each of these microprocesses has probabilities associated with it that will successfully occur. The overall probability that a stable bubble particle aggregate will form and be lifted to the froth layer is a product of the various microprocess probabilities; this leads to a kinetic- or population balance-type model where the population of free particles is modelled. Bloom and Heindel [Citation1] extended the idea of a population-balance model to include a forward and reverse reaction (i.e. the birth and death of free particles); this model has the form (1) in this paper where
Figure 8. Forces acting on a particle in the neighbourhood of a bubble.
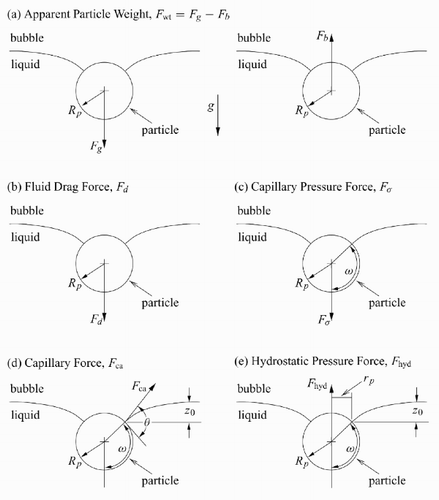
Figure 9. Particle – bubble collision.
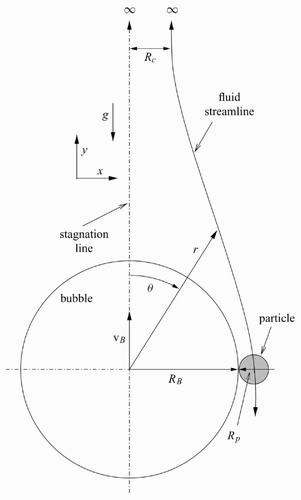
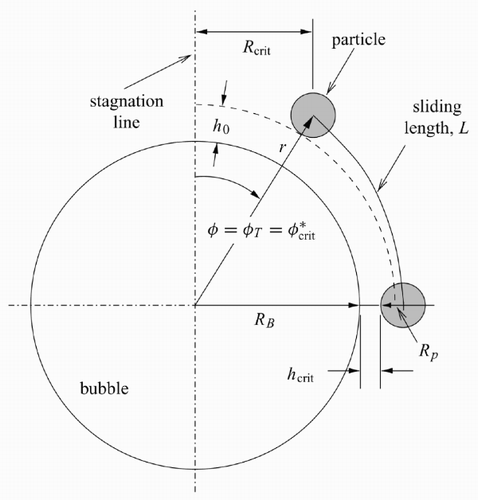
Figure 10. Sliding of a particle along the ‘surface’ of a bubble.