
Abstract
We present detailed results of the field evolution of the de Haas–van Alphen (dHvA) effect in . A magnetic field-induced reconstruction of the Fermi surface is clearly shown to occur inside the antiferromagnetic state, in an applied field of around
T, which is evidenced by the appearance of several new dHvA branches. The angular dependence of the dHvA frequencies reveals that the Fermi surfaces of
at
and
are similar. The results suggest that the Ce-4f electrons in
become itinerant at
due to the Kondo effect, prior to the field-induced quantum critical point (QCP) at
T. The electronic states at the field-induced QCP are therefore different from that of the pressure-induced QCP where a dramatic Fermi surface reconstruction occurs exactly at the critical pressure, indicating that multiple types of QCP may exist in
.
1. Introduction
Heavy fermions are prototype examples of strongly correlated electron systems, in which the localised f-electrons strongly hybridise with itinerant electrons via the Kondo interaction, leading to a significant enhancement of the effective mass of the quasiparticles. In such systems, the energy scales of various competing interactions are small, so that their ground states may be readily tuned by non-thermal parameters, such as pressure, magnetic field and doping. Quantum critical behaviour has been observed in a number of heavy-fermion compounds upon applying different tuning parameters. One outstanding issue is whether one can find a way to universally characterise quantum critical points (QCPs), just as in the case of classical phase transitions.
In recent years, several theoretical models have been proposed to understand the physics at the QCP in heavy-fermion systems [Citation1,Citation2], among which two different scenarios have been widely discussed. The conventional spin-density wave (SDW)-type QCP [Citation3–Citation5] resembles that of classical phase transitions, where the unusual behaviour in the vicinity of the QCP arises from fluctuations of the order parameter, that is spin fluctuations. Such a QCP has been found in several Ce-based heavy-fermion superconductors [Citation6,Citation7] such as [Citation8] and
[Citation9]. However, in the case of an unconventional QCP, in addition to order parameter fluctuations, there is the critical destruction of the Kondo effect at the QCP [Citation10–Citation12], as observed in
[Citation13] and
[Citation14]. An important method for distinguishing between the two types of QCP is to examine the nature of the Fermi surface (FS). For an unconventional QCP, the Kondo screening only develops at the QCP, so the f-electrons are well localised in the antiferromagnetic (AF) state but delocalised and contribute to the FS in the paramagnetic (PM) state, leading to a sudden increase in the size of the FS upon crossing the QCP. However, for the SDW-type QCP, Kondo screening already occurs within the magnetic state and hence no sharp FS reconstruction is expected at the QCP.
The so-called ‘115’ family [ (
)] has provided a valuable opportunity to study quantum criticality, unconventional superconductivity, magnetism and their interplay. An important but open issue in Ce-based heavy fermions is the role of the 4f-electrons and their degree of itinerancy. The Ce 4f-electrons are localised in
at ambient pressure [Citation15], while they are itinerant in
and
[Citation16,Citation17]. When a moderate pressure is applied, AF order is suppressed and a QCP accompanied by superconductivity is observed in
[Citation18,Citation19]. Across this pressure-induced QCP, a sharp change of the FS has been detected via the de Haas–van Alphen (dHvA) effect [Citation20]. Here, the smooth disappearance of AF order and the abrupt jump of the FS are consistent with a Kondo destroying QCP.
To study the quantum criticality of induced via other tuning parameters, we have carried out systematic measurements using high magnetic fields. Based on detailed measurements of the specific heat, dHvA effect and Hall effect, our previous work mapped the B-T phase diagram of
[Citation21]. With increasing magnetic field,
is gradually suppressed and converges to zero temperature at an SDW-type QCP at around 50 T. Additionally, there is a FS reconstruction inside the AF state, with evidence showing that the FS changes from small to large [Citation21]. Here, we provide further evidence for this scenario from detailed dHvA measurements with magnetic fields applied along different crystallographic directions, in particular with the field rotated in the ac-plane. The dHvA frequencies can be directly compared with
and
, in the case of localised and itinerant 4f-electrons, respectively. In addition, we provide a schematic B-p-T phase diagram, based on the current results.
2. Experimental details
Single crystals of were grown using an influx method [Citation15], with a residual resistance ratio as high as 1000, indicating a very high sample quality. The orientation of the crystals were determined using Laue x-ray diffraction. Measurements of the dHvA effect of
were performed down to 330 mK using a 75 T pulsed magnet and a 45 T DC magnet at the National High Magnetic Field Laboratory, USA. The dHvA effect is the most sensitive probe of the FS properties of metals, where the oscillation frequency is directly proportional to extremal cross sectional areas of the FS, while the amplitude of the oscillations yields important information concerning the electronic interactions [Citation22]. In a pulsed magnetic field, we performed the dHvA measurements using a susceptometer coil, while in the DC magnet a capacitive torque magnetometer was used. To measure the angular dependence of the dHvA effect, the capacitive torque magnetometer was mounted on a rotating probe. Due to the large magnetisation of the sample in high magnetic fields, the sample plate of the capacitor can be bent significantly away from the a-axis, making measurements near to
challenging. However, the real angle between the sample and magnetic field can be estimated using the absolute value of the capacitance, which gives rise to an error less than 5
.
3. Results
3.1. Pulsed magnetic field, 
In Figure , we present results of the magnetic susceptibility of at various temperatures which demonstrate clear signals of dHvA oscillations. Besides the oscillations, a tiny jump around 2.5 T denoted by
is detected at low temperatures, which corresponds to the first-order metamagnetic transition reported previously [Citation23–Citation26]. In addition, a step in the signal is observed around
T, which is consistent with the presence of an AF to PM phase transition. From combining with the results of the AC-specific heat [Citation21], and magnetisation [Citation26], we are able to map the boundary between these two phases. The dHvA measurements in a pulsed field allow us to investigate the evolution of the FS with magnetic field in a much larger field range.
Figure 1. (colour online) Magnetic susceptibility (with arbitrary units) as a function of magnetic field at various temperatures for . Data are equally shifted for comparison.
and
mark the critical fields for the metamagnetic transition and the AF transition, respectively.
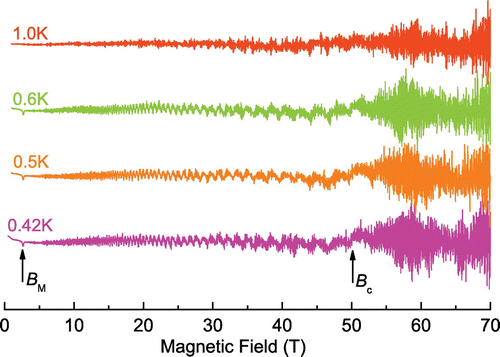
Figure 2. (colour online) FFT spectra of the dHvA oscillations for at various magnetic fields with
. The values of
and the measured temperatures are given in (a)–(d). Here a field interval of
T is used for each FFT spectrum. Curves of different
are equally shifted along the vertical direction.
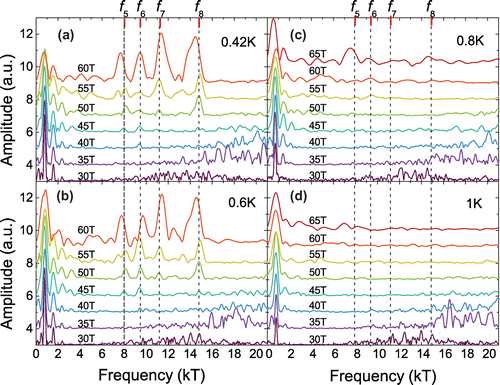
To reveal the evolution of the FS with increasing magnetic field, we applied a fast Fourier transform (FFT) to the dHvA signals over a range of [,
], where
represents the midpoint of the analysed data range and
T. The FFT spectra for different temperatures and various values of
are shown in Figure (a)–(d), with the value of
marked on each curve. At low field, several sharp peaks located in the frequency range of 200 T–1000 T are well-defined. These frequencies are consistent with the previous results of
and are also similar to those of
for
[Citation16,Citation23,Citation27]. Since no 4f-electrons exist in
, this observation supports that the 4f-electrons in
are localised and do not contribute to the FS at low fields. It is noted that the vibration of the magnet and other background noise generates several frequencies with broad peaks and high values in the FFT spectra, which shift to higher frequencies with increasing magnetic field, as seen in Figure . At very low temperatures, several high frequencies (
) emerge at around 40 T and their amplitudes grow with increasing magnetic field. In a DC magnetic field, the appearance of new frequencies occurs around
T [Citation21], while in a pulsed magnetic field, the high noise level can damp the dHvA oscillations and therefore the new frequencies are seen here above
. The new dHvA frequencies vary from about 8000 T to 15,000 T, well beyond those observed at low fields, indicating a sudden reconstruction of the FS with large cross sectional areas. Evidence for the delocalisation of the 4f-electrons in
at
comes from a comparison with the band structure calculations of
[Citation16,Citation28], where the new frequencies
should correspond to the
(band 15) and
branches (band 14). Additionally, upon increasing the temperature the amplitudes of the high frequency oscillations are suppressed much faster than those with lower frequencies. At
K, the high dHvA frequencies still appear near 55 T (above
), but cannot be resolved at
K. According to the Lifshitz–Kosevich (LK) formula [Citation22], such a fast suppression of the high-frequency dHvA oscillations indicates that these bands have higher effective masses. The enhancement of the effective mass can also be understood as resulting from the presence of Kondo screening inside the AF phase.
Figure 3. (colour online) dHvA signals of for
at temperatures of (a) 4.0 K, (b) 3.0 K and (c) 0.33 K. The corresponding FFT spectra for
are shown in (d)–(f). The dHvA oscillations are obtained by subtracting the background shift from the magnetic field dependence of the capacitance of the cantilever.
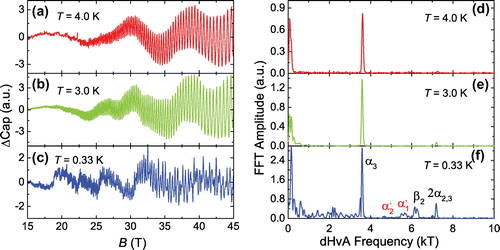
Figure 4. (colour online) A comparison of the FFT spectra for , in the case of (a)
(
) and
(
) for
; (b)
(
) and
from Ref. [Citation20]; (c)
(
), and
[Citation29]. For
, the new frequencies are shown in red. The curves are distinguished by different colours and the upper curve is shifted along the vertical axis for clarity.
![Figure 4. (colour online) A comparison of the FFT spectra for , in the case of (a) () and () for ; (b) () and from Ref. [Citation20]; (c) (), and [Citation29]. For , the new frequencies are shown in red. The curves are distinguished by different colours and the upper curve is shifted along the vertical axis for clarity.](/cms/asset/b9c50ac5-aea3-4de6-949c-100f30efacf2/tphm_a_1282181_f0004_oc.gif)
3.2. DC magnetic field,
In Figure , we present the dHvA signals of measured in a 45 T DC field for
at three temperatures. At high temperature (
K) quantum oscillations with two dominant frequencies can be clearly resolved from the data and the FFT spectra of the signal (for
) shows that these frequencies correspond to 80 T and 3620 T. Both values are comparable to the cross sectional areas of the
and
branches, as reported in previous experiments and theoretical calculations [Citation16,Citation27]. Upon cooling the sample to lower temperatures, the dominant frequency (
) shows no clear shift across
. However, several new dHvA oscillation frequencies could be observed above 30 T as shown by the FFT spectrum displayed in Figure (f), which is similar to the case where
. These new frequencies are not observed either in the calculations assuming localised f-electrons or dHvA measurements in small magnetic fields. The evolution of the dHvA frequencies below and above
at 0.33 K is plotted in Figure (a), in which we could resolve several dHvA frequencies with sharp peaks. Frequencies marked as
(5000 T),
(5700 T) and
(11,900 T) appear only above
, which are not detectable below 30 T [Citation16,Citation27]. From the comparison in Figure (a), we found the origin of the new frequencies likely results from an expansion of the FS above
.
Figure 5. (colour online) (a) dHvA oscillations at various angles in the ac plane for a magnetic field range of 30–45 T, where is the angle between the magnetic field and c-axis. The data were collected in a 45 T DC magnet and a smooth background signal has been subtracted from the raw data (b) Comparison of the angular dependence of the large dHvA frequencies of
, and
[Citation28]. The dashed–dotted lines are
1/cos
fits to the experimental data.
![Figure 5. (colour online) (a) dHvA oscillations at various angles in the ac plane for a magnetic field range of 30–45 T, where is the angle between the magnetic field and c-axis. The data were collected in a 45 T DC magnet and a smooth background signal has been subtracted from the raw data (b) Comparison of the angular dependence of the large dHvA frequencies of , and [Citation28]. The dashed–dotted lines are 1/cos fits to the experimental data.](/cms/asset/bbba42a5-7b2d-4188-a498-f9ef0dc78051/tphm_a_1282181_f0005_oc.gif)
Figure 6. (colour online) Schematic B-p-T phase diagram of . The different phases are labelled in the figure, where AF, P and SC represent antiferromagnetic, paramagnetic and superconducting phases, respectively, while the subscripts S and L represent small and large FS, respectively. Symbols are experimental data reproduced from this work as well as the literature [Citation18,Citation19,Citation21,Citation33]. All the dashed and dotted lines are guide to the eyes.
![Figure 6. (colour online) Schematic B-p-T phase diagram of . The different phases are labelled in the figure, where AF, P and SC represent antiferromagnetic, paramagnetic and superconducting phases, respectively, while the subscripts S and L represent small and large FS, respectively. Symbols are experimental data reproduced from this work as well as the literature [Citation18,Citation19,Citation21,Citation33]. All the dashed and dotted lines are guide to the eyes.](/cms/asset/884cac7c-fe26-4532-81f7-f86b024b76c8/tphm_a_1282181_f0006_oc.gif)
The dHvA frequencies measured by us at low fields are similar to the results of [Citation20], as shown in Figure (b). It is clear that dHvA frequencies of these two cases are highly similar. Since
contains no f-electrons, this suggests that the f-electrons in
can be reasonably treated as localised below
. In Figure (c), we compare the new frequencies obtained in high field with those of
[Citation29], where we focus on the closed orbits of the dominant
and
bands. Other closed orbits such as
,
and
orbits cannot be clearly identified in either
[Citation29] or
, due to their small sizes and an insufficient experimental resolution. It can be seen that the new frequencies are similar to those of
. It is known that the Ce 4f-electrons are itinerant in
and therefore our results indicate that the appearance of the new dHvA frequencies above
is due to the delocalisation of Ce 4f-electrons, which occurs well inside the AF state. Figure also reveals that the
and
branches are nearly independent of magnetic field. These two branches centre around the A-point in k-space, while other expanded branches (
,
, and
) centre around the M-point, suggesting that the hybridisation strength may have a
dependence in momentum space.
3.3. DC magnetic field with
In order to study the FS topology of , we also performed angular dependent dHvA measurements in the ac plane on this sample up to 45 T at 0.33 K. As shown in Figure (a), clear quantum oscillations can be observed at different
, where
is the angle between the magnetic field and the c-axis. Due to the relatively large magnetisation of
, it is experimentally difficult to measure the angular dependence of the dHvA effect close to a-axis. However, quantum oscillations with high resolution were obtained for
. The period and shape of the oscillating signal change continuously with increasing
. After performing a FFT to the data above
, we obtained the angular dependence of the new frequencies, which are displayed in Figure (b) by solid symbols. To further compare with
, we also plot the typical dHvA frequencies of
in the same figure (open symbols) [Citation28]. For clarity, we only plot the high frequencies. For both compounds, the data show nearly
1/cos
behaviour (dashed–dotted lines) which is expected for a quasi-cylinder-like FS. Despite small differences which may arise due to a small misalignment at high fields, the similarity of the two data-sets displayed in Figure indicates a similar FS topology between
at high fields and
.
4. Discussion and concluding remarks
From our previously reported dHvA, specific heat and Hall effect results [Citation21], we have concluded a 3D-SDW QCP in at 50 T, with a FS reconstruction around 30 T. Here, we provide further data and analysis of the dHvA results. Based on all the measurements of the dHvA effect and Hall effect, we can reach a consistent picture of a magnetic field induced FS reconstruction. Furthermore, Moll et al. recently reported measurements of the resistivity of
fabricated into a microstructure using a focused ion beam technique [Citation30], where a similar FS reconstruction is also observed. Various effects may induce new oscillations in dHvA signals at high magnetic fields, such as metamagnetic transitions, Zeeman splitting, magnetic breakdown or the formation of new magnetic order [Citation31]. Firstly, a thermodynamic phase transition or metamagnetic transition at
is not likely, since no anomaly in the magnetisation or heat capacity can be detected around
. Zeeman splitting is also an unlikely origin for this behaviour in
, due to the new frequencies being much higher than those in low magnetic fields, which can therefore not result from splitting the low frequencies. For a quasi-2D FS such as in
, the magnetic breakdown effect should be very anisotropic. However
is very isotropic for both field directions in our study. On the other hand, as we discussed above and as shown in Ref. [Citation21], our measurements of dHvA oscillations and Hall resistivity suggest that the change of FS at
= 30 T arises due to the formation of Kondo screening.
By comparing the two tuning parameters of pressure and magnetic field, we provide a schematic B-p-T phase diagram for , in Figure . At T = 0, the phase diagram can be qualitatively interpreted in terms of the global phase diagram [Citation34,Citation35]. Above 3.8 K,
is in the PM state at ambient pressure, while below this temperature there is an ordered AF state with a small FS (
). Application of a sufficient large magnetic field gives rise to the formation of a heavy-fermion state inside the AF state, leading to a change of the FS volume from small to large, due to the delocalisation of Ce-4f electrons. Further increasing the magnetic field suppresses the AF order at an SDW-type QCP at
= 50 T, through which the FS evolves smoothly. It is noted that only when the magnetic field is strong enough to break the single-ion Kondo effect, the spin of the conduction electrons can be completely polarised by the external magnetic field. Since the temperature for the onset of Kondo screening (
10 K) is more than twice the Néel temperature (3.8 K) in this compound, antiferromagnetism would be expected to be suppressed at a lower magnetic field than the Kondo effect. Given that the AFM critical magnetic field is about 50 T, the breakdown of single-ion Kondo effect is expected to be higher than the measurable magnetic field range as we have addressed earlier [Citation21]. On the other hand, upon applying pressure,
is gradually suppressed, while the superconducting transition temperature
initially increases. Around
GPa, the
state abruptly disappears. Upon applying a sufficiently high magnetic field, long-range magnetic order reemerges with a transition temperature below
[Citation32]. The magnetic order is completely suppressed at around
GPa where a sudden change of FS is observed [Citation20], being consistent with the scenario of a Kondo breakdown QCP [Citation7].
These results suggest that multiple QCPs can be realised in the same compound, which can be universally characterised by the evolution of the FS. To further compare it with the theoretically proposed global phase diagram, systematic measurements under both the extreme conditions of high pressure and high magnetic fields are needed, which is very experimentally challenging. It is also important to extend similar studies to other heavy-fermion compounds which is crucial for establishing whether the global phase diagram universally explains heavy fermion compounds. To do this, suitable systems need to be selected, where the ground states can be tuned by multiple external parameters and the localised to itinerant transitions are readily accessible with techniques such as the dHvA effect or Hall resistivity.
Acknowledgements
We would like to thank M. Jaime, Y. Kohama, H.-O. Lee, T. Park, Q. Si, F. Steglich and J.X. Zhu for valuable discussions.
Additional information
Funding
Notes
No potential conflict of interest was reported by the authors.
References
- G.R. Stewart, Non-Fermi-liquid behavior in d- and f-electron metals, Rev. Mod. Phys. 73 (2001), pp. 797–855.
- H. von Löhneysen, A. Rosch, M. Vojta, and P. Wölfle, Fermi-liquid instabilities at magnetic quantum phase transitions, Rev. Mod. Phys. 791015 (2007), pp. 1015–1075.
- J.A. Hertz, Quantum critical phenomena, Phys. Rev. B 14 (1976), pp. 1165–1184.
- T. Moriya, Spin Fluctuations in Itinerant Electron Magnetism, Springer, Berlin, 1985.
- A.J. Millis, Effect of a nonzero temperature on quantum critical points in itinerant fermion systems, Phys. Rev. B 48 (1993), pp. 7183–7196.
- Q. Si and F. Steglich, Heavy fermions and quantum phase transitions, Science 329 (2010), p. 1161–1166.
- P. Gegenwart, Q. Si, and F. Steglich, Quantum criticality in heavy-fermion metals, Nat. Phys. 4 (2008), p. 186–197.
- J. Arndt, O. Stockert, K. Schmalzl, E. Faulhaber, H.S. Jeevan, C. Geibel, W. Schmidt, M. Loewenhaupt, and F. Steglich, Spin fluctuations in normal state CeCu2Si2 on approaching the quantum critical point, Phys. Rev. Lett. 106 (2011), p. 246401.
- A.V. Silhanek, T. Ebihara, N. Harrison, M. Jaime, K. Tezuka, V. Fanelli, and C.D. Batista, Nonlocal magnetic field-tuned quantum criticality in cubic CeIn3–xSnx (x = 0.25), Phys. Rev. Lett. 96 (2006), p. 206401.
- Q. Si, S. Rabello, K. Ingersent, and J.L. Smith, Locally critical quantum phase transitions in strongly correlated metals, Nature 413 (2001), pp. 804–808.
- P. Coleman, C. Pépin, Q. Si, and R. Ramazashvili, How do Fermi liquids get heavy and die?, J. Phys.: Condens. Matter 13 (2001), pp. R723–R738.
- T. Senthil, M. Vojta, and S. Sachdev, Weak magnetism and non-Fermi liquids near heavy-fermion critical points, Phys. Rev. B 69 (2004), p. 035111.
- S. Paschen, T. Lühmann, S. Wirth, P. Gegenwart, O. Trovarelli, C. Geibel, F. Steglich, P. Coleman, and Q. Si, Hall-effect evolution across a heavy-fermion quantum critical point, Nature 432 (2004), pp. 881–885.
- A. Schröder, G. Aeppli, R. Coldea, M. Adams, O. Stockert, H.v. Löhneysen, E. Bucher, R. Ramazashvili, and P. Coleman, Onset of antiferromagnetism in heavy-fermion metals, Nature 407 (2000), pp. 351–355.
- H. Hegger, C. Petrovic, E.G. Moshopoulou, M.F. Hundley, J.L. Sarrao, Z. Fisk, and J.D. Thompson, Pressure-induced superconductivity in quasi-2D CeRhIn5, Phys. Rev. Lett. 84 (2000), pp. 4986–4989.
- H. Shishido, R. Settai, D. Aoki, S. Ikeda, H. Nakawaki, N. Nakamura, T. Iizuka, Y. Inada, K. Sugiyama, T. Takeuchi, K. Kindo, T.C. Kobayashi, Y. Haga, H. Harima, Y. Aoki, T. Namiki, H. Sato, and Y. Ōnuki, Fermi surface, magnetic and superconducting properties of LaRhIn5 and CeTIn5 (T: Co, Rh and Ir), J. Phys. Soc. Jpn. 71 (2002), pp. 162–173.
- N. Harrison, U. Alver, R.G. Goodrich, I. Vekhter, J.L. Sarrao, P.G. Pagliuso, N.O. Moreno, L. Balicas, Z. Fisk, D. Hall, R.T. Macaluso, and J.Y. Chan, 4f-electron localization in CexLa1–xMIn5 with M = Co, Rh, or Ir, Phys. Rev. Lett. 93 (2004), p. 186405.
- T. Park, F. Ronning, H.Q. Yuan, M.B. Salamon, R. Movshovich, J.L. Sarrao, and J.D. Thompson, Hidden magnetism and quantum criticality in the heavy fermion superconductor CeRhIn5, Nature 440 (2006), pp. 65–68.
- G. Knebel, D. Aoki, D. Braithwaite, B. Salce, and J. Flouquet, Coexistence of antiferromagnetism and superconductivity in CeRhIn5 under high pressure and magnetic field, Phys. Rev. B 74 (2006), p. 20501.
- H. Shishido, R. Settai, H. Harima, and Y. Ōnuki, A drastic change of the Fermi surface at a critical pressure in CeRhIn5: dHvA Study under Pressure, J. Phys. Soc. Jpn. 74 (2005), pp. 1103–1106.
- L. Jiao, Y. Chen, Y. Kohama, D. Graf, E.D. Bauer, J. Singleton, J. Zhu, Z. Weng, G. Pang, T. Shang, J. Zhang, H. Lee, T. Park, M. Jaime, J.D. Thompson, F. Steglich, Q. Si, and H.Q. Yuan, Fermi surface reconstruction and multiple quantum phase transitions in the antiferromagnet CeRhIn5, Proc. Natl. Acad. Sci. USA 112 (2015), pp. 673–678.
- I.M. Lifshitz and A.M. Kosevich, Theory of magnetic susceptibility in metals at low temperature, Sov. Phys. JETP 2 (1956), pp. 636–645.
- A.L. Cornelius, A.J. Arko, J.L. Sarrao, M.F. Hundley, and Z. Fisk, Anisotropic electronic and magnetic properties of the quasi-two-dimensional heavy-fermion antiferromagnet CeRhIn5, Phys. Rev. B 62 (2000), p. 14181.
- V.F. Correa, W.E. Okraku, J.B. Betts, A. Migliori, J.L. Sarrao, and A.H. Lacerda, High-magnetic-field thermal expansion and elastic properties of CeRhIn5, Phys. Rev. B 72 (2005), p. 12407.
- S. Raymond, E. Ressouche, G. Knebel, D. Aoki, and J. Flouquet, Magnetic structure of CeRhIn5 under magnetic field, J. Phys.: Condens. Matter 19 (2007), p. 242204.
- T. Takeuchi, T. Inoue, K. Sugiyama, D. Aoki, Y. Tokiwa, Y. Haga, K. Kindo, and Y. Ōnuki, Magnetic and thermal properties of CeRhIn5 and CeRhIn5, J. Phys. Soc. Jpn. 70 (2001), pp. 877–883.
- D. Hall, E.C. Palm, T.P. Murphy, S.W. Tozer, C. Petrovic, E. Miller-Ricci, L. Peabody, C.Q.H. Li, U. Alver, R.G. Goodrich, J.L. Sarrao, P.G. Pagliuso, J.M. Wills, and Z. Fisk, Electronic structure of CeRhIn5: de Haas-van Alphen and energy band calculations, Phys. Rev. B 64 (2001), p. 64506.
- D. Hall, E.C. Palm, T.P. Murphy, S.W. Tozer, Z. Fisk, U. Alver, R.G. Goodrich, J.L. Sarrao, P.G. Pagliuso, and T. Ebihara, Fermi surface of the heavy-fermion superconductor CeCoIn5: The de Haas van Alphen effect in the normal state, Phys. Rev. B 64 (2001), p. 212508.
- R. Settai, H. Shishido, S. Ikeda, Y. Murakawa, M. Nakashima, D. Aoki, Y. Haga, H. Harima, and Y. Ōnuki, Quasi-two-dimensional Fermi surfaces and the de Haas-van Alphen oscillation in both the normal and superconducting mixed states of CeCoIn5, J. Phys.: Condens. Matter 13 (2001), pp. L627–L634.
- P.J.W. Moll, B. Zeng, L. Balicas, S. Galeski, F.F. Balakirev, E.D. Bauer, and F. Ronning, Field-induced density wave in the heavy-fermion compound CeRhIn5, Nat. Commun. 6 (2015), p. 6663.
- D. Shoenberg, Magnetic Oscillations in Metals, Cambridge University Press, 1984.
- T. Park, M.J. Graf, L. Boulaevskii, J.L. Sarrao, and J.D. Thompson, Electronic duality in strongly correlated matter, Proc. Natl. Acad. Sci. USA 105 (2008), pp. 6825–6828.
- G.F. Chen, K. Matsubayashi, S. Ban, K. Deguchi, and N.K. Sato, Competitive coexistence of superconductivity with antiferromagnetism in CeRhIn5, Phys. Rev. Lett. 97 (2006), p. 17005.
- Q. Si, Global magnetic phase diagram and local quantum criticality in heavy fermion metals, Physica B 378–380 (2006), pp. 23–27.
- P. Coleman and A.H. Nevidomskyy, Frustration and the Kondo effect in heavy fermion materials, J. Low Temp. Phys. 161 (2010), pp. 182–202.