
 ?Mathematical formulae have been encoded as MathML and are displayed in this HTML version using MathJax in order to improve their display. Uncheck the box to turn MathJax off. This feature requires Javascript. Click on a formula to zoom.
ABSTRACT
Slip transmission between neighbouring grains is needed for the occurrence of plastic deformation in polycrystals. A geometric factor defined for a pair of grains with a certain orientation relationship is used to determine the slip transmission. Two slip transmission factors are calculated for randomly oriented grains. One is the slip transmission factor averaged for randomly oriented grains and the other is the minimum of the transmission factors among all possible orientation relationships. The possible number of slip systems in a grain varies for different metals and alloys. The effects of the number of slip systems on the transmission factors are discussed.
1. Introduction
Plastic deformation of metals and alloys is usually caused by slip deformation which depends on their crystal structures. Because metal and alloy polycrystals are aggregates of crystal grains with different orientations, slip transmission between slip systems of neighbouring grains is necessary for plastic deformation [Citation1–5]. In a metal with a hexagonal close-packed (hcp) crystal structure, the total number of possible slip systems in a grain is generally lower than in a metal with a face-centred cubic (fcc) crystal structure. Although slip transmission between neighbouring grains is considered to be more difficult in the former crystal structure, the degree of difficulty of slip transmission has not yet been evaluated quantitatively as a function of the number of slip systems.
With regard to the plastic deformation of polycrystals from an atomistic perspective, the microscopic structures of grain boundaries or dislocations should be included when discussing the slip transmission between neighbouring grains [Citation4,Citation5]. However, in such cases, it is difficult to determine the overall effects of the total number of possible slip systems on the degree of slip transmission, because atomistic analysis involves many factors. Therefore, in this study, we will discuss the slip transmission between neighbouring grains from a macroscopic perspective using a geometric slip transmission factor. We will evaluate the degree of slip transmission for randomly oriented crystal grains, and demonstrate the effects of the number of slip systems on slip transmission in a polycrystal.
2. Geometric slip transmission factor
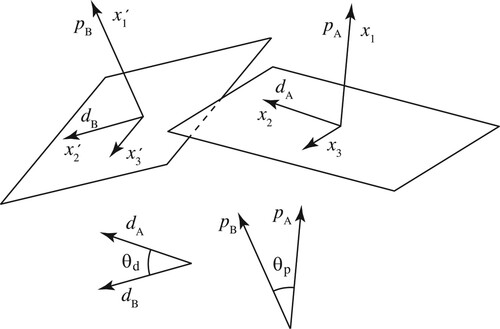
In the present study, we adopt the geometric slip transmission factor fLM described by Luster and Morris [Citation3]. shows a schematic illustration of slip planes in neighbouring grains. The right plane is one of the slip planes of Grain A, and pA and dA represent the slip plane normal and the slip direction, respectively. The left plane is one of the slip planes of Grain B, and pB and dB represent the slip plane normal and the slip direction, respectively, of that slip system. The geometric factor fLM is given by
(1)
(1) where
and
are the acute angles between pA and pB and dA and dB, respectively. The range of fLM is
and the slip transmission between the slip systems is easier for larger fLM values.
Figure 1. Schematic illustration showing the slip systems in Grains A and B. Arrows p and d with subscripts A and B indicate the slip plane normal and slip direction in Grains A and B, respectively.
The deformation of a material is a change in the displacement as a function of the position
. The distortion
is the quantity that describes the deformation. If a shear deformation as large as α occurs as a result of the activation of the slip system of pA and dA, using the coordinate system
fixed to the slip system in Grain A, the following component of distortion is related to α:
(2)
(2)
We can describe the shear deformation α using the coordinate system fixed to the slip system in Grain B. The transformation of the coordinate systems from the unprimed to the primed systems gives the magnitude of shear of the slip system of pB and dB written as
(3)
(3)
Therefore, the factor fLM is a coefficient of the component of distortion given by the transformation of the coordinate systems. When fLM is 1, all the shear deformation on the slip system of Grain A is transmitted to that of Grain B. In contrast, when fLM is zero, the shear deformation on the slip system of Grain A is not transmitted to that of Grain B.
Other slip transmission factors have been proposed. The stress transmission factor fLC proposed by Livingston and Chalmers is one of them [Citation1]. The two factors fLM and fLC give different values for the same orientation relationship between neighbouring grains. For example, when the slip planes and directions of Grains A and B are perpendicular to each other, we have and this causes fLM = 0 but fLC = 1 [Citation1]. The factor fLC is considered to be a coefficient of stress or strain components after the transformation of the coordinate systems. Although strain components
for fLM are symmetrical and always satisfy
, distortion components
for fLC are unsymmetrical. This causes the difference in the transmission factors. As far as we consider the transmission of plastic shear deformation, slip transmission may be impossible when
. The factor fLM for unsymmetrical distortion components is appropriate as the slip transmission factor for plastic shear deformation.
In addition to the orientation relationship of slip planes and directions, there are other factors that affect slip transmission in a polycrystal [Citation4,Citation5]. Structure of grain boundary including its orientation is one of the factors [Citation5]. The boundary structure affects motion and arrangement of dislocations and changes stress states near grain boundary regions in polycrystals. Such factors are not included and we cannot discuss, for example, strength of polycrystals or bicrystals with the present analysis. However, simplified geometric analysis made in the present study is useful to extract the effects of number of slip systems on slip transmission as will be shown later.
3. Polycrystals composed of randomly oriented grains
When there are two or more slip systems in a crystal grain, fLM values for a pair of crystal grains exist for various combinations of the slip systems. Among the various values of fLM, fMax which is the maximum of fLM is treated as a characteristic transmission factor for the pair of crystal grains. When the orientation relationship between the pair of crystal grains changes, fMax also changes.
Polycrystals without texture are considered to be composed of randomly oriented grains. Such polycrystals were generated computationally. Using sets of three random numbers, three dimensionally random orientations of grains can be generated computationally [Citation6]. In the present study, pairs of grains with random orientations were generated using the random numbers. Orientations of grains can be described by rotation axes and angles with respect to a certain reference coordinate system. Depending on the symmetry of the crystal structure of a grain, many equivalent expressions of rotation axes and angles exist for the same crystallographic orientation relationship. Among the various rotation angles, the minimum angle is called the disorientation angle
. In the present study, the disorientation angle
is adopted as a parameter in discussions about the dependence of fMax on the orientation relationship. For example, the range of
for a cubic structure is
and the average value of
for random orientation has been analytically determined to be
[Citation7,Citation8]. The present numerical calculations for
random pairs of grains reproduce this analytical result of the average of
well and deviations from the analytical result were smaller than 0.05% in five times trials. This demonstrates that the computationally generated number of pairs of grains, i.e.
, is sufficient for accurate discussion on the characteristics of a random distribution. Analytical considerations were also taken into account when interpreting the results obtained from the numerical calculations.
4. Slip transmission factor fMax for the  slip system of fcc metals
Here we first consider the slip transmission factor fMax for the slip system of fcc metals. Because there are four
and three
on each
, the number N of slip systems in a grain is
in this case. shows the relationship between
and fMax when two neighbouring grains have all possible orientation relationships. When
is zero (Point O in ), the orientations of two grains are identical and fMax is unity. For the lower-angle side of
, fMax generally decreases with increasing
, but the relationship between
and fMax does not show one-to-one correspondence. This is because different orientation relationships with different values of fMax exist for a certain value of
.
Figure 2. Relationship between the disorientation angle and the transmission factor fMax for fcc metals with
slip systems of
.
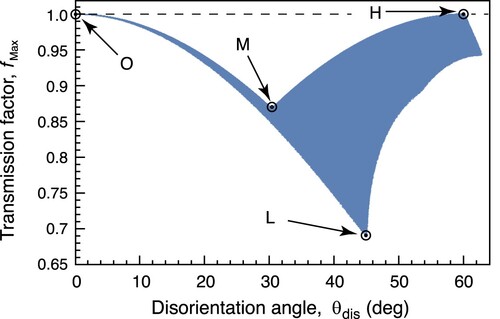
When is larger than
, the relationship between
and fMax is different from the lower-angle side. From Points M to H, fMax increases with increasing
owing to the multiple slip systems in the grain. Analytical considerations revealed that Point H with
and fMax = 1 corresponds to the orientation relationship of coherent twins, where one of the slip planes and three slip directions on the slip plane are the same between two grains. The worst orientation relationship for the slip transmission is represented by Point L with
and fMax = 0.687. The curve in from Points O to L is given by the rotation around
, and the rotation around
gives smaller values of fMax. In contrast, the curve in from Points M to H is given by the rotation around
from approximately
to
, and the rotation around
generally gives larger values of fMax. Other characteristics of obtained by analytical considerations are explained in Appendix 1.
As shown in , two angles, and
, between the slip plane normal and the slip directions are used to derive the slip transmission factor fLM [Citation3]. Hence even if the slip plane normal and the slip direction are changed and the
slip system is considered for body-centred cubic (bcc) metals instead of the
for fcc metals, the relationship between
and fMax is not affected. Therefore is also considered to be the result for the
slip system for bcc metals.
5. Slip transmission factor fMax for other slip systems of cubic and hexagonal metals
(a,b) show the relationship between and fMax for other slip systems of cubic metals. In (a), the results for the
slip system reported for high-temperature deformation of an Al-1%Mn alloy [Citation9] are shown. The number N of the slip systems for
is 6. In contrast to for
, the overall tendency of the change of fMax is a monotonical decrease with increasing
. The minimum value of fMax is 0.5 at
. This minimum value fMax = 0.5 is smaller than the minimum value fMax = 0.687 for
. In contrast, (b) shows the results for
which is known as one of the slip systems of bcc metals. The number N of the slip systems for
is 24. In this case, as shown in (b), there are three orientation relationships giving fMax = 1. They are
,
and
. The minimum value of fMax for
is 0.802 at
. This value is larger than the minimum value fMax = 0.687 for
. (c) shows the result for
of the slip system of hcp metals for
. Although the overall tendency of the change of fMax is similar to that shown in (a) of
, there is only one slip plane in a grain for this case and fMax is zero when slip planes in neighbouring grains are perpendicular to each other. The maximum of
for a hcp structure is
[Citation10] and the condition
is a necessary condition of fMax
.
Figure 3. Relationships between the disorientation angle and the transmission factor fMax for (a) the Al-1%Mn alloy with
slip systems [Citation9] of
, (b) bcc metals with
slip systems of
and (d) hcp metals with
slip systems of
.
![Figure 3. Relationships between the disorientation angle θdis and the transmission factor fMax for (a) the Al-1%Mn alloy with {001}/〈110〉 slip systems [Citation9] of N=6, (b) bcc metals with {123}/〈111¯〉 slip systems of N=24 and (d) hcp metals with (0001)/〈112¯0〉 slip systems of N=3.](/cms/asset/3fff3814-0816-4ff7-ab38-ef30bc0dc031/tphm_a_2068808_f0003_oc.jpg)
show the frequency of fMax for randomly oriented grains when the grains are those of (a) fcc alloys with slip systems[Citation9] of
, (b) fcc metals with
slip systems of
, (c) bcc metals with
slip systems of
and (d) hcp metals with
slip system of
. In (a–c), the peaks of frequency are shown and the peaks become sharper and shift to higher values with increasing N from 6 to 24. In contrast to this tendency, the variation for
shown in (d) is fairly flat. The frequency of fMax is the highest at fMax
and decreases monotonically with increasing fMax.
Figure 4. Frequency of the transmission factor fMax for randomly oriented grains when the grains are (a) fcc alloys with slip systems [Citation9] of
, (b) fcc metals with
slip systems of
, (c) bcc metals with
slip systems of
and (d) hcp metals with
slip systems of
.
![Figure 4. Frequency of the transmission factor fMax for randomly oriented grains when the grains are (a) fcc alloys with {001}/〈110〉 slip systems [Citation9] of N=6, (b) fcc metals with {111}/〈011¯〉 slip systems of N=12, (c) bcc metals with {123}/〈111¯〉 slip systems of N=24 and (d) hcp metals with (0001)/〈112¯0〉 slip systems of N=3.](/cms/asset/f0de57f8-c9e4-44c2-b49a-a95ed8ea2965/tphm_a_2068808_f0004_oc.jpg)
6. Average and minimum slip transmission factors: FAve and FMin
We will derive two slip transmission factors for the polycrystal. One is FAve which is the average of fMax for randomly oriented grains. The other is FMin which is the minimum of fMax among all possible orientation relationships of neighbouring grains. For the initial stage of plastic deformation, occurrence of plastic deformation is resticted to regions where it occurs easily and elastic accommodation compensates the difference in the amount of plastic deformation. The average slip transmission factor FAve may be appropriate as a measure of the slip transmission of such initial stage of plastic deformation. On the other hand, for the occurrence of overall plastic deformation in a polycrystal, slip transmission between all neighbouring grains are needed. The minimum slip transmission factor FMin may be appropriate as a measure of the occurrence of such deformation stage.
The values of FAve can be obtained from , which are 0.752 for (a) of
,
for (b)
of
,
for (c)
of
and 0.468 for (d)
of
. The values of FMin obtained from are 0.5 for
of
,
for
of
,
for
of
and 0 for
of
.
Considering that materials have various crystal structures and slip systems, we calculated values of FAve and FMin for a wide range of N values. summarises the results, including those obtained from . Although two different slip systems are considered for and
as shown in , the values of FAve and FMin for the slip systems with the same N values are almost the same. The slip systems for tetragonal and orthorhombic structures shown in are those assumed from the crystal structures. The other slip systems are well known ones and have been reported previously [Citation9,Citation11,Citation12]. In the numerical calculations to obtain the values of FAve, appropriate symmetrical operations should be made depending on the crystal structure[Citation10]. The soundness of the symmetrical operations made in the present numerical calculations is explained in Appendix 2.
Table 1. The number N of slip systems, the average slip transmission factor FAve and the minimum slip transmission factor FMin for various crystal structures and slip systems.
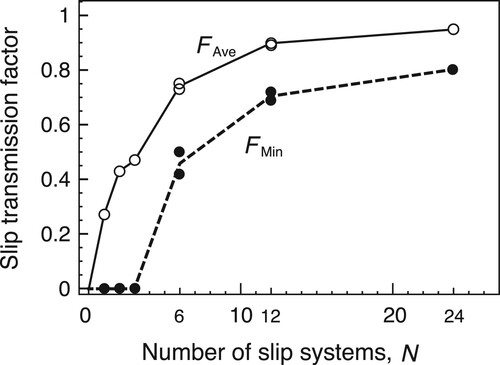
Using the values shown in , the relationship between N and FAve or FMin is graphically indicated in . FAve increases monotonically with increasing N for . On the other hand, the variation of FMin shows no slip transmission occurs for
. However, the increasing behaviour of FAve and FMin are similar for
and shows that the slip transmission becomes easier with increasing N. Although this is the result obtained only by using the geometric factor fLM described by Luster and Morris [Citation3], we succeeded to extract the effect of the number N of slip systems that the slip transmission in polycrystals becomes easier with increasing N.
Figure 5. Relationships between the number N of slip systems and the average FAve and the minimum FMin transmission factors for polycrystals composed of randomly oriented grains.
In the present study, we have obtained the average slip transmission factor FAve and the minimum slip transmission factor FMin for polycrystals composed of randomly oriented grains. When textures with a certain tendency of grain orientations are included, the effects of texture on the average slip transmission between neighbouring grains can be discussed using the present method of analysis. This will be the subject of our future work.
7. Conclusions
In the present paper, the necessity of slip transmission between neighbouring grains for plastic deformation in polycrystals was discussed from a macroscopic perspective. The average transmission factor FAve and the minimum transmission factor FMin for randomly oriented grains were used to evaluate the slip transmission in polycrystals. The number N of possible slip systems in a grain differs according to the metal or alloys. The effects of N on FAve and FMin were discussed. We succeeded to extract the effect of the number N of slip systems that the slip transmission in polycrystals becomes easier with increasing N.
Disclosure statement
No potential conflict of interest was reported by the author(s).
Additional information
Funding
References
- J.D. Livingston and B. Chalmers, Multiple slip in bicrystals deformation. Acta Metall. 5 (1957), pp. 322–327.
- R.C. Pond, W.A.T. Clark and R.H. Wagoner, On the crystallography of slip transmission in hexagonal metals. Scripta Metall 20 (1986), pp. 1291–1295.
- J. Luster and J.M. Morris, Compatibility of deformation in two-phase Ti-Al alloys: dependence on microstructure and orientation relationship. Metall. Mat. Trans. A 26 (1995), pp. 1745–1756.
- D.E. Spearot and M.D. Sangid, Insight on slip transmission at grain boundaries from atomistic simulations. Curr. Opin. Solid State Mater. Sci. 18 (2014), pp. 188–195.
- T.R. Bieler, P. Eisenlohr, C. Zhang, H.J. Phukan and M.A. Crimp, Grain boundaries and interface in slip transfer. Curr. Opin. Solid State Mater. Sci. 18 (2014), pp. 212–226.
- F. Yoshimasu, N. Miyazawa, N. Nakada and S. Onaka, Probability densities of disorientation angles among randomly oriented grains in tricrystals. J. Mat Sci. 57 (2022), pp. 3010–3017.
- J.K. Mackenzie and M.J. Thomson, Some statistics associated with the random disorientation of cubes. Biometrika 44 (1957), pp. 205–210.
- J.K. Mackenzie, Second paper on statistics associated with the random disorientation of cubes. Biometrika 45 (1958), pp. 229–240.
- F. Perocheau and J.H. Driver, Slip system rheology of Al-1%Mn crystals deformed by hot plane strain compression. Int. J. Plasticity 18 (2002), pp. 185–202.
- A. Morawiec, Misorientation-angles distribution of randomly oriented symmetric objects. J. Appl. Cryst 28 (1995), pp. 289–293.
- R. Le Hazif and J.P. Poirier, Evidence of extensive glide on {110} planes in single crystals of aluminum. Scripta Metall 6 (1972), pp. 367–370.
- R. Le Hazif and J.P. Poirier, Glissment {110} <110 > dans les metaux de structure cubique a faces centrees. Acta Metall. 21 (1973), pp. 903–911.
Appendix
Appendix 1. Details of
The curve from Points O to M illustrates the upper bound of fMax for the range of the disorientation angle . Analysis reveals that the change along this curve is the rotation as much as
around the axis
written as
This axis has the angle of
with respect to both of
and
. Because the change in orientation from Points M to H results from rotation around
, the coordinates of Point M are
and fMax = 0.868.
We have the following analytical expressions for the boundaries of the region shown in :
Curve from Points from O to L:
Curve from Points from O to M:
Curve from Points from M to H:
Because the symmetry of the cubic crystal affects the relationship between and fMax for larger values of
, the curve from Points L to H at the right-hand-side of cannot be expressed by a simple function of
.
Appendix 2. Characteristic values of the disorientation angle for various crystal structures
Characteristic values of the disorientation angle for various crystal structures are shown in . The numerical results shown in this table were obtained by computationally generating
pairs of randomly oriented grains. The present numerical results of average values of
for randomly oriented grains are very close to the previous analytical results of average of
[Citation10]. This demonstrates the soundness of the symmetrical operations used in the present numerical calculations.
Table A1. Maximum values of the disorientation angle for various crystal structures [Citation10]. Analytical [Citation10] and numerical results of average of
for random orientations.