
 ?Mathematical formulae have been encoded as MathML and are displayed in this HTML version using MathJax in order to improve their display. Uncheck the box to turn MathJax off. This feature requires Javascript. Click on a formula to zoom.
ABSTRACT
The effect of Sn micro-alloying on microstructure evolution, formability and precipitation behaviour of Al-Mg-Si-Cu-Zn alloys were systematically studied by experimental techniques and theoretical calculations. Results show that Sn addition can accelerate both the precipitation and re-dissolution of the Fe-rich phase during casting and homogenising treatments, which thereby determined the final microstructure. A significant retarding effect to natural ageing precipitation was observed with increasing Sn content in quenching samples, but this effect was weakened in pre-aged samples, as explained by DSC and simulations. The different number densities of the strengthening phase β″at the same artificial aging state are mainly attributed to the changed activation energy of the β″ phase affected by the formed Sn-containing Mg-Zn clusters and Mg-Si clusters. Trace Sn participating in the formation of GP zones, Sn-containing MgZn2 phase and new precipitating sequences during ageing were proposed for the first time.
1. Introduction
Al alloys have been used for car body panels for recent decades owing to their significant advantages in corrosion resistance, strength to weight ratio, and energy consumption compared with other automotive lightweight materials [Citation1]. Age-hardening behaviour is the crucial factor that makes Al alloys special, and it is generally accepted that the precipitation sequence of 6xxx series Al alloys (Al-Mg-Si alloys) during ageing is as follows [Citation2]: SSSS → Clusters/GP zones → β″→ β′→ β, where SSSS represents a supersaturated solid solution, clusters/GP zones are metastable precipitates that have full coherency with the matrix, β″ phase (Mg5Si6) is the most strengthening phase, which is coherent with the matrix and intended to be formed during bake-hardening processing, with the main contribution to the strength, β′ phase (Mg9Si5) is semi-coherent with the matrix, resulting from continuous growth/precipitation of the β″ phase, and β phase is the final equilibrium phase in Al-Mg-Si series alloys.
In industrial generation, Al alloy plates are normally stored at room temperature (RT) for some time before stamping to the final shape. Before stamping, less precipitation and lower strength are necessary, while after stamping, a more and finer strengthening phase is needed. However, precipitation during storage is inevitable, and to control precipitation during natural aging (NA), pre-aging (PA) was proposed and proven to be effective [Citation3–5]. During the heat treatment process, clusters/GP zones are supposed to be formed during PA, which can, on the one hand, capture the quench-in vacancies to avoid phase formation and, on the other hand, act as the nuclei of β″ phase to enhance the bake-hardening response in later artificial aging (AA) process [Citation6]. Inevitably, other expected phases will also precipitate together with clusters/GP zones, causing the hardness to increase. Apart from that, the stability of clusters/GP zones during NA is another hamper to hinder its wide application.
Micro-alloying has been a promising replacement method to inhibit natural aging precipitation and enhance stability during storage. In recent years, Zn, Mn, Zr, Cd, In, La, Er, Li and also other new elements/composites have been used as micro-alloying additions to optimise the aging behaviour [Citation7–14]. Zn was gradually taken into Al-Mg-Si system owing to its pronounced effect on bake hardening response [Citation15]. Sn was first added to Al-Cu series alloys [Citation16], and the effect of Sn on GP zone reversion has aroused wide attention; however, its addition to Al-Mg-Si or Al-Zn-Mg series alloys was expected to be more complete due to the complex interactions between solute elements.
Sn has been proven to be effective in sluggish natural aging precipitates for up to two weeks for quenched alloys even with a part-per-million addition [Citation17] due to its sufficient solubility in the Al matrix and optimal binding energy to vacancies. A thermodynamic model of the retardation factor was developed to explain the concept that Sn trapped vacancies at low temperature and released them at elevated temperature, but no Sn-containing clusters were detected during artificial aging. Further studies were performed [Citation18–20] to reveal the effect of Sn at elevated temperatures and exhibit ultrafast aging kinetics. Again, the researchers want to propose the theory that small Sn precipitates act as heterogeneous nucleation sites for strengthening phase as was reported in 2xxx alloys, yet no evidence was observed. However, better artificial aging hardenability even after long-term storage (6 months) was obtained with appropriate alloying composition and heat treatments. Sn-containing precipitates (β′/β″composite) were successfully observed in reference [Citation21], which was attributed to β″ growing on the first formed β′ phase. Sn was found to sit at the centre of precipitates; therefore, it is inferred that the precipitation reaction involves the participation of Sn-containing β′ (Mg9Si5-xSnx) with Si sites partially occupied by Sn. The initial β′ may directly nucleate at the Sn-vacancy pairs and afterwards act as a heterogeneous nucleus for β″. This theory was proven by direct observation via 3DAP technology and then fully utilised to improve the ageing or hardening performance at varied ageing conditions [Citation22–26]. Although most studies focus on the precipitation behaviour of the strengthening phase during the artificial ageing process at elevated temperatures, Sn participating in clusters and the following influence was barely directly detected by high-resolution techniques [Citation25,Citation27]. However, most studies on the effect of Sn micro-alloying were performed by analysing the composition and mechanical properties, and very limited studies were focused on the precipitation behaviour of the β″ or Mg2(Si, Sn) phase [Citation28,Citation29]. Additionally, less attention was given to understanding the formation mechanisms of Sn-containing GP zones/clusters, which is also of great importance to determine the heat treatment parameters and hence controlling the subsequent microstructure evolution and further greatly improve the mechanical properties.
In present work, quenched and pre-aged alloys with 0%, 0.01% and 0.03% (weight percentage) Sn addition were designed and characterised by hardness measurements combined with transmission electron microscopy (TEM) and differential scanning calorimetry (DSC). In particular, thermodynamic calculations were performed to interpret the effect of Sn on precipitation behaviours of Al-Mg-Si-Cu-Zn alloys. Altogether, the effect of Sn on the microstructure and properties was fully discussed by experimental and modelling methods.
2. Materials and experimental methods
The chemical compositions of the Al-Mg-Si-Cu-Zn alloys are given in and marked as B (base composition without Sn addition), B-0.01 (base composition with 0.01wt.% Sn addition), and B-0.03 (base composition with 0.03wt.% Sn addition). A DDZP-45 intermediate frequency induction heating furnace was used for smelting materials, and then the ingots were cast into a water-cooled mold for solidification. Ingots were homogenised at 485°C for 3 h and 555°C for 38 h to eliminate segregation, followed by hot rolling to 6 mm plates, first cold rolling to 3 mm plates, intermediate annealing at 400°C for 2.5 h, and final cold rolling to 1 mm thickness.
Table 1. Chemical composition of the experimental alloys (wt.%).
The final plates with a thickness of 1 mm were machined to get the desired geometry, and a solid solution treatment was performed at 555°C for 2 min, followed by immediate water quenching to room temperature and then pre-aging treatment from 80°C to 40°C with a cooling rate of 0.2°C/min in a DHG9055A type electric thermostatic drying oven.
Scanning electron microscopy (SEM) was performed using a Phenom XL-type SEM equipped with an X-ray energy-dispersive spectrometer (EDS) system operating at 20 kV. Transmission electron microscopy (TEM) images of precipitates were obtained using a Tecanai G2 F20 S-TWIN operated at an acceleration voltage of 200 kV. The specimen was prepared by standard mechanical grinding to a thickness of ∼80 μm and then subjected to twin-jet electropolishing at −20°C in a mixture solution with 30% HNO3 and 70% CH3OH. High-resolution TEM (HRTEM) characterisation was performed in the [001]Al direction. Vickers hardness measurements were performed under a load of 200 g and holding time of 15 s using a Wolpert-402MVD microhardness tester. Each value was obtained by averaging at least seven indentations. Meanwhile, the precipitation behaviour was analyzed by differential scanning calorimetry (DSC) atmosphere with pure aluminium using QS2000 under an argon as a reference. The DSC test was carried out from 20°C to 370°C at a heating rate of 10°C/min. The tensile specimens were cut according to the requirements in GB/T228-2002, and the tensile tests were carried out on an MTS810 electrohydraulic servo material testing machine with a tensile rate of 3 mm/min. The mechanical properties of alloys in the T4P state (pre-aging sample) were tested along three directions, i.e. 0°, 45°, 90°, with respect to rolling direction. The plastic strain ratio (r) and strain hardening exponent (n) can be calculated from the testing data. Accordingly, the average plastic strain ratio and plane anisotropy Δr of the alloy can be described as follows:
(1)
(1)
(2)
(2) where
,
, and
are the plastic strain ratios of the alloy in the directions of 0°, 45° and 90°, respectively. Electron backscatter diffraction (EBSD) was performed on a SUPRA 55 scanning electron microscope. A final polishing step with electrolytic polishing in a solution of 5%vol perchloric acid and 95% vol ethanol at −20°C was included for EBSD analysis. Data acquisition was performed with an acceleration voltage of 20 kV, working distance of 15–20 mm and step size of 2 µm. The postprocessing was done with Channel 5 software.
3. Results
3.1. Microstructure evolution
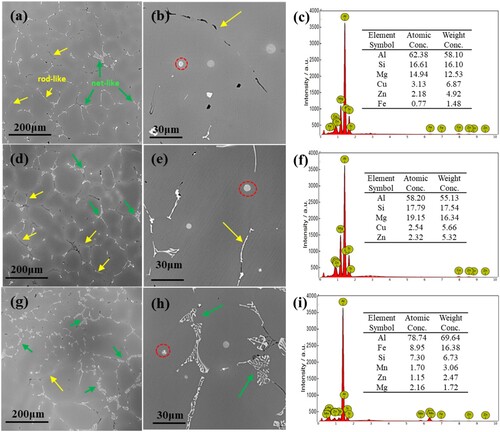
shows the SEM microstructures of the three alloys at as-cast state and the compositional analysis of the second phase. Apparently, there are differences in the size, morphology and distribution of precipitates in the alloys. In alloy B, as can be seen from (a)–(c), the grain size is uniform, the intergranular white phase is mostly rod-like (yellow arrow) and slightly net-like (green arrow), and the intragranular gray phase is mainly spherical particles, with/without finer white particles inside. The EDS analysis results revealed that all the white phase is detected to be the Fe-rich phase (with varied element content), and the gray phase is the Mg-Si (Q) phase(with varied element content). With the addition of 0.01% Sn, as shown in (d)–(f), alloy B-0.01 has a similar grain size and uniform distribution, but with a wider intergranular phase, a more net-like and less rod-like morphology is observed. Q phase particles are also found within grains. With the addition of 0.03% Sn, as shown in (g)–(i), alloy B-0.03 differs greatly in microstructure: the grain size varies from 50 µm to 200 µm in diameter; the intergranular phase becomes much wider and coarser, changing from rod-like to wide net-like precipitates.
Figure 1. SEM microstructure and EDS analysis of alloys with different contents of Sn in the as-cast state, (a–c) alloy B, (d–f) alloy B-0.01, (g–i) alloy B-0.03.
To eliminate the adverse effects of inhomogeneity, i.e. micro- and intergranular segregation, homogenisation was employed, aiming to optimise the morphology and homogenise the distribution of the Fe-rich phase. As shown in , the intergranular phase partially redissolved back to the Al matrix and partially spheroidised to zipper-like shapes (α-Fe-rich phase), remaining discontinuous rod/net-like blocks. In comparison, the transformation rate of the rod-shaped phase is higher than that of the net-shaped phase. The intergranular phase in the base alloy is more thermally stable than that in Sn-containing alloys; only a small rod-like phase can be redissolved, and most rod- and net-shaped phases remain in the alloy matrix. Compared with the other two alloys, the alloy B-0.01((d)–(f)) has the highest transformation or redissolution portion than that of the other two alloys, almost all the rod phases are spheroidised or redissolved into the matrix, and only some net-shaped phases remain in the alloy matrix. The alloy B-0.03 ((g)–(i)) shows a similar situation to the alloy B-0.01, but because of the large amount of net-like intergranular precipitation, alloy B-0.03 still accommodates some Fe-rich phase, including the spheroidised α- Fe-rich phase and original larger size net-like phase.
Figure 2. SEM Homogeneous microstructures and EDS analysis of alloys with different contents of Sn, (a–c) alloy B, (d–f) alloy B-0.01, (g–i) alloy B-0.03.
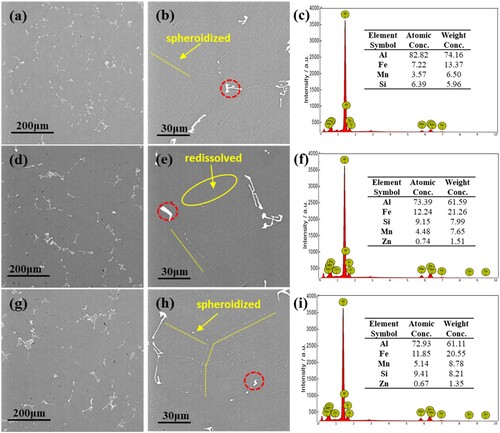
Additionally, the gray particles (Q phase) inside grains were fully dissolved (as shown in ). EDS analysis results reveal the composition of the remaining rod/net-like phase, which are all Fe-rich phases but with varied Fe contents. With the addition of Sn, the precipitates in the both alloys contain the higher contents of Fe, Mn and Si compared with the Sn-free alloy from the detected particles. In addition, Zn is also detected in Sn-containing alloys instead of alloy B (compare the difference in (c), (f) and (i)). Whether the difference can be generalise to the entire alloy and what’s the relation between Zn containing Fe-rich phase and Sn-alloying, will be explained in discussion part. It can be found that the accelerating effect of Sn is found not only in the solidification/precipitation process but also in the homogenisation/redissolution treatment.
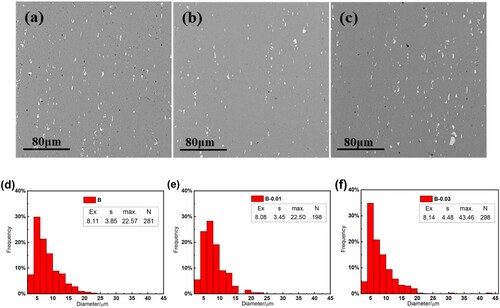
And if the alloys are hot rolled and cold rolled by the optimised thermomechanical processing, the microstructure of the alloy in the final cold rolling state changes greatly as shown in , together with the size distribution statistics of crushed Fe-rich phase particles (the diameter represents geometric mean diameter of irregular shaped particles). Five random SEM images were selected and processed in Image Tool software, to distinguish the precipitates automatically under same settings for all the images. The expected value mean grain size (Ex), standard deviation (s), maximum grain size (max), and detected average number of grains (N) are also shown with statistical results. Significant differences in the amount and size of the Fe-rich phase among the three alloys can be observed. The alloy B ((a, d)) contains Fe-rich phase with the sizes mostly distributed in the range of 5–10 µm and no larger than 25 µm in diameter. The alloy B-0.01((b, e)) exhibits a size distribution similar to that of the alloy B but with less amount, which corresponds to the higher re-dissolution portion during the homogenisation process. The alloy B-0.03 ((c, f)) contains the highest amount and the largest size of Fe-rich phase, with several phase particles exceeding 40 µm in diameter and much higher standard deviation than the other two alloys, this can be attributed to the previously undissolved large net-shaped precipitates.
Figure 3. SEM microstructure of alloys in the final cold rolling state, (a), (d) alloy B, (b), (e) alloy B-0.01, (c), (f) alloy B-0.03.
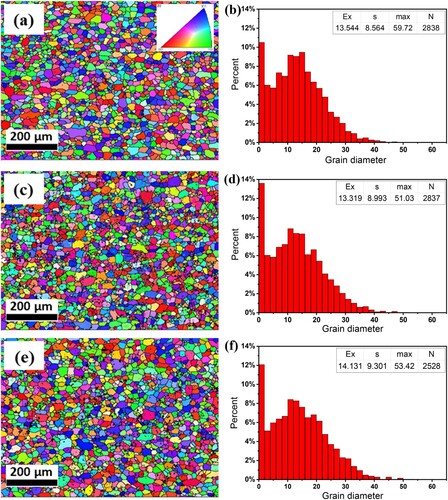
For the final cold rolled alloys, if the alloys are solution treated at high temperature, the recrystallisation can be occurred in them, which gives a great influence on the formability. shows the IPF images and grain size statistics from EBSD scanning of pre-aged alloy samples. The expected value, mean grain size (Ex), standard deviation (s), maximum grain size (max), and detected number of grains (N) are also shown with statistical results. Apparently, the grain size distribution does not exhibit an obvious changing tendency with varied compositions, and all distribution peaks occur in the range of 10 µm–20 µm. However, the alloy B-0.01((d)) has an average grain size and standard deviation similar to those of the alloy B ((b)). The alloy B-0.03((f)) has a larger average grain size and standard deviation but fewer grains, indicating a decreasing uniformity. Both Sn-containing alloys show a higher percentage of grains with diameters less than 2 µm, considering the minimum grain size threshold of EBSD measurement is 2 µm, so the first column with grain size between 0 and 2 in three graphs will not be used for strong evidence.
Figure 4. IPF images and grain size statistics of alloys in the pre-aging state (a), (b) alloy B, (c), (d) alloy B-0.01 and (e), (f) alloy B-0.03.
displays the texture components in the three alloys in the pre-aging state. It has been found that typical textures in FCC structural materials, including rolling textures, i.e. Copper, S, Brass, and recrystallisation textures, i.e. Cube, Goss, R, P, Q [Citation30–34], are all detected in the studied alloys. As seen from , recrystallisation textures are much more abundant than rolling textures, Cube texture and P texture, and Copper texture have relative higher volume fraction in each alloy. This is because Cube-orientation grains can recover faster than grains in other directions during the recrystallisation process, which makes the nucleation of Cube-orientation recrystallised grains have a size advantage [Citation35–37]. The P texture has a 40°<111> orientation relationship with the rolled texture S, i.e. in the fastest growth direction. The CubeND texture also shows high strength, which is approximately equal to the cube texture strength. This is because CubeND also has a 40°<111> orientation relationship with the rolling texture Copper, and the rolling process provides enough strain storage energy to fully transform the rolling texture to the recrystallised texture during the solid solution process. In addition, the PSN effect of Fe-rich phase particles is another contribution to the CubeND and R textures [Citation38–41].
Figure 5. The volume fraction of texture components after pre-aging treatment of the three alloys, and the volume fraction reduction compared to alloy B (Reduction = volume fraction in B – volume fraction in B-0.01/0.03), only reduced fraction was displayed.
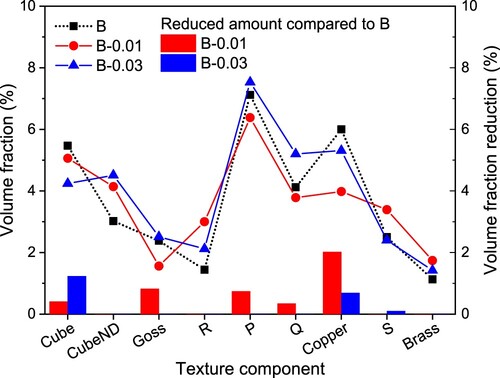
Sn addition changed the volume fraction of textures in different ways. For recrystallisation textures, the alloy B-0.01 has higher CubeND and R textures but lower Goss, P and Q textures than the alloy B; the alloy B-0.03 has all recrystallisation textures higher than the alloy B except Cube. For rolling textures, both Sn-containing alloys decreased the volume fraction of Copper texture. As reported in reference [Citation42], both the average r and Δr values contributed by Goss texture are the highest among all the texture components, but that the average r and Δr values contributed by the Cube texture are the lowest. Additionally, the r values of one single texture component are quite different from each other in different directions, it can be easily seen that only one texture component is not beneficial to improve the formability of Al alloys. Thus, it would be a better way to improve the formability by weakening textures. As can be seen from right Y-axis, compared to alloy B, alloy B-0.01 has weakened textures with reduced volume fraction, but alloy B-0.03 didn’t. Suggesting that the large Fe-rich phase particles in are not beneficial to the formability.
3.2. Mechanical property characterisation
To further understand the effect of micro-alloying and the size distribution of the Fe-rich phase on the mechanical properties, tensile tests are performed on pre-aged samples along 0°, 45°, and 90° with respect to the rolling direction. The engineering stress–strain curves and testing results are shown in and . For each alloy, the plastic strain ratio r values are relatively higher in the 0° and 45° directions but lower in the 90° direction. Comparing the three alloys, as shown in (d), it seems that r in the 90° direction does not change with varying composition, yet there are changes in the 0° and 45° directions, which results in the alloy B-0.01 having a higher average r value, while the alloy B-0.03 has a lower r value than the alloy B. Increasing the alloying content of Sn shows opposite effects, which means the mechanical properties are related not only to the chemical composition but also other factors, such as the morphology and size of the Fe-rich phase. The strain hardening exponent n values are similar in the three tensile directions of each alloy. The addition of 0.01% Sn had no obvious effect, and 0.03% Sn slightly improved the hardening exponent, indicating a better ability for uniform deformation.
Figure 6. Engineering stress–strain curves of (a) alloy B, (b) alloy B-0.01 and (c) alloy B-0.03, and (d) the plastic strain ratio r value in different directions of the three alloys.
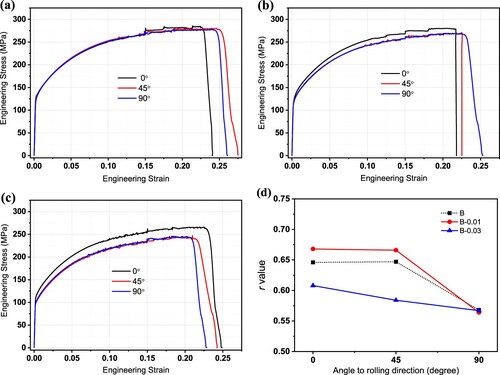
Table 2. Tensile test results of T4P alloys in different directions.
The most significant change caused by Sn addition is reflected in the yield strength. Compared with the alloy B, alloy B-0.01 lowers the yield strength by approximately 10 MPa in the 45° and 90° directions, and alloy B-0.03 further lowers the yield strength by 10 MPa in the 0° and 30 MPa in the 45° and 90° directions. Generally, a lower yield strength is preferred because it is beneficial to the stamping deformation of the plate.
Researchers have proven that there is a positive correlation between the r value and limited drawing ratio (LDR) [Citation43]. The plastic strain ratio r value can be easily determined by tensile tests; however, the formability can be better evaluated by LDR, which depends on both the r and n values [Citation43,Citation44]. The theoretical LDR value can be obtained using the following equation:
(3)
(3) where f is the factor of drawing efficiency. When f is 0.9, the calculated LDR value should be more accurate. Therefore, the LDR values of alloys B, B-0.01 and B-0.03 are 2.016, 2.021 and 1.996, respectively, it is observed a positive correlation between r and LDR values.
Above all, after the addition of Sn, the yield strength of the alloy is significantly reduced, although the plastic strain ratio r (anisotropy) changes in different ways. The difference in formability between alloys is supposed to be caused by differences in microstructures and textures. Additionally, with the change of Sn content, the precipitation behaviour of the alloys should be also changed greatly. Thus, in the following section, we will discuss in detail the precipitation behaviour of the three alloys in the different aging routes.
3.3. Precipitation behaviour
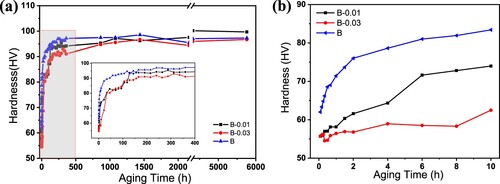
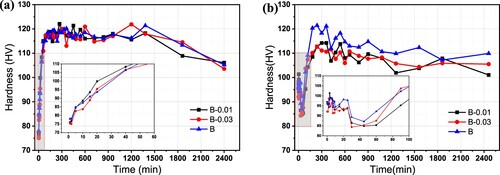
It can be seen from the above analysis that the addition of Sn to alloy B has different effects on the properties. However, with Sn addition, alloys have better forming properties, and these differences will be further revealed in the subsequent aging process. Therefore, it is necessary to characterise the natural aging behaviour through microhardness testing at first, the hardness values were obtained by averaging at least seven indentations after remove a maximum value and a minimum value, the error bars for all the hardness measurements are ±1 HV. shows the hardness curves during the natural ageing process of alloys after solid solution treatment. The hardness change is very different at the first ten hours, as shown in (b). The hardness of the alloy B increases rapidly from 60 HV to 85 HV within 10 h after solid solution. In contrast, the hardness of alloy B-0.01 increased slowly, from 55 HV to approximately 70 HV within 10 h; with increasing Sn content, the hardness of alloy B-0.03 only increased from 55 HV to approximately 65 HV within 10 h. With the extension of the natural aging time, as shown in (a), the hardness of the two Sn-containing alloys gradually increased and reached the same hardness level as the alloy B at approximately 200 h, indicating that Sn effectively inhibited the natural aging precipitation, and the more Sn addition there was, the more significant the inhibitory effect.
Figure 7. Microhardeness curves of (a) solution-treated alloys during the natural aging process microhardness change in 8 months (6000 h), inserted with enlarged 15 days hardness change and (b) enlarged curves in the first 10 h.
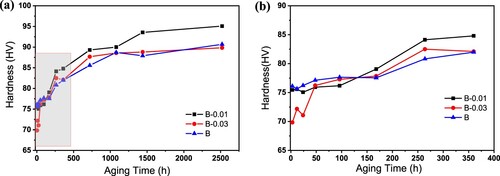
Although without pre-aging, Sn-containing alloys exhibit better natural aging stability than alloy B. Nevertheless, pre-aging is the most important/only method to inhibit aging precipitation after solid solution treatment. It is necessary to study whether Sn can play a similar role in pre-aged alloys. As shown in , after solid solution treatment, alloys are subjected to pre-aging treatment followed by natural aging. As shown in (b), the hardness value of alloy B-0.03 is the lowest immediately after pre-aging, only 70 HV, while the hardness values of the alloy B-0.01 and alloy B are both approximately 76 HV. After natural aging for 150 h, the hardness value of both Sn-containing alloys increases to more than 75 HV and exceeded that of the hardness alloy B. With the further increase of the natural aging time, the hardness value of the alloy continues to increase, in (a), the hardness of the alloy B-0.01 is the highest, while that of the alloy B-0.03 is not much different from that of the alloy B.
Figure 8. Microhardeness curves of pre-aged alloys during the natural aging process. (a) microhardness change in 3 months (2400 h) and (b) enlarged curves in the first 15 days (360 h).
It can be seen from the hardness curve that after applying the pre-aging treatment, the inhibitory effect of Sn on natural aging was no longer significant. According to the thermodynamic behaviour, the formation energy of Mg2Sn is 167.3 kJ/mol, while that of Mg2Si is 76.7 kJ/mol, meaning that Mg2Sn is easier to form and more stable. Therefore, the possible reason is that Sn and Mg react with each other during the pre-aging process, resulting in the loss of pinning vacancies during the subsequent natural aging. The remaining vacancies may interact with the solute elements Mg, Si, Zn, etc., and continue to precipitate fine solute clusters, thereby reducing the stability against natural aging.
Through the analysis of the aging hardness curve, it was initially found that the addition of Sn affects the natural aging stability of alloys. Through tensile tests, it is found that the addition of Sn improves the forming performance of alloys. To further study the influence of Sn on the precipitation behaviour, DSC analysis was used to study the precipitation behaviour and precipitation kinetics of the alloy samples that were naturally placed for different times after pre-aging. The DSC curves are shown in . Generally, during the heating process, when the aluminium alloy undergoes a phase transformation, the change in heat flow will appear in the DSC curves [Citation42–45]. The exothermic peak at approximately 250°C corresponds to the precipitation of acicular β″ phase; the exothermic peak at approximately 295°C to 300°C corresponds to the precipitation of β′ and Q′ phases. As the β′ and Q′ phases coarsen, the hardness of the alloy decreases.
Figure 9. DSC results of pre-aged alloys after natural aging for (a) 0 days and (b) 5 months.
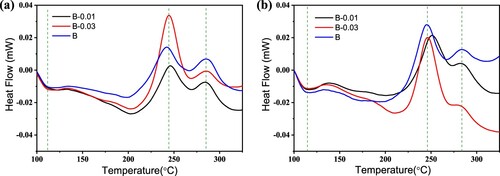
shows that there are two obvious exothermic peaks, which appear at approximately 240°C and 270°C, corresponding to the precipitation of the β″ phase and β′ + Q′ phases, respectively. In addition, there is also one endothermic peak at approximately 120°C, representing the re-dissolution of GP zones or clusters that formed during the aging process. For alloys without natural aging after pre-aging ((a)), the β″ peak area of the alloy B-0.03 is much larger than that of the other two alloys. There was no significant difference between the peak area of the alloys B-0.01 and B, indicating that most of the β″ phase precipitated in the alloy B-0.03, and the alloy B-0.01 had the least precipitated β″ phase. After 5 months of natural aging, as shown in (b), the β″ phase precipitation peak area of the alloy B-0.03 is still the largest, and that of the alloy B-0.01 is the smallest, but compared with that in (a), the precipitation peak area decreases slightly. Moreover, the area of the endothermic peak is larger than that of the samples without natural aging, indicating the occurrence of precipitation during natural aging.
To better compare the difference in precipitation behaviour accurately, the Avrami-Johnson-Mehl model [Citation45,Citation46] was employed to calculate the precipitation activation energy Q and the rate constant k0 of the β″ phase base d on experimental results. The temperature range relating to half peak of β″ phase (starting point of the peak to the highest point of the peak) was considered into analytical equation. The calculation process is shown in and .
Figure 10. Calculation procedure of β″ phase activation energy for alloys B, B-0.01 and B-0.03 after pre-aging (a)Y-T curves of β″ phase fraction with temperature, (b) lnln(1/(1-Y))-lnt curves for n fitting, (c) [(dY/dT)*φ/f(Y)]-1/T curves for calculation slope Q, (d) Y-t curves of β″ phase fraction with time.
![Figure 10. Calculation procedure of β″ phase activation energy for alloys B, B-0.01 and B-0.03 after pre-aging (a)Y-T curves of β″ phase fraction with temperature, (b) lnln(1/(1-Y))-lnt curves for n fitting, (c) [(dY/dT)*φ/f(Y)]-1/T curves for calculation slope Q, (d) Y-t curves of β″ phase fraction with time.](/cms/asset/f2668b20-eaeb-496c-983a-e65c4e27f10c/tphm_a_2154401_f0010_oc.jpg)
Figure 11. Calculation procedure of β″ phase activation energy for alloys B, B-0.01 and B-0.03 after pre-aging and natural aging for 5 months (a)Y-T curves of β″ phase fraction with temperature, (b) lnln(1/(1-Y))-lnt curves for n fitting, (c) [(dY/dT)*φ/f(Y)]-1/T curves for calculation slope Q, (d) Y-t curves of β″ phase fraction with time.
![Figure 11. Calculation procedure of β″ phase activation energy for alloys B, B-0.01 and B-0.03 after pre-aging and natural aging for 5 months (a)Y-T curves of β″ phase fraction with temperature, (b) lnln(1/(1-Y))-lnt curves for n fitting, (c) [(dY/dT)*φ/f(Y)]-1/T curves for calculation slope Q, (d) Y-t curves of β″ phase fraction with time.](/cms/asset/bcca7c4d-154c-4f02-a0b5-f6eb2240f998/tphm_a_2154401_f0011_oc.jpg)
(a) shows that the β″ phase precipitation of the alloy B begins the earliest, that of the alloys B-0.01 and B-0.03 starts later and ends later, and that of the alloy B-0.01 has a lower volume fraction. (b) shows the slope n is approximately 2 after linear fitting. (c) shows the calculated activation energies of the β″ phase in alloys B, B-0.01 and B-0.03, which are 81.9, 67.1, and 76.9 kJ/mol, respectively. The lower the activation energy is, the easier it is to precipitate, indicating that the bake hardening response of the alloy B-0.01 is much faster than that of the other two alloys. Accordingly, the kinetics equations are obtained, as shown in .
Table 3. Activation energy and kinetics equation of β″ after pre-aging and natural aging for 0 days.
Similarly, calculations and analyses are applied to the three alloys after natural aging for 5 months. (a) shows that the β″ phase begins to precipitate in the alloy B at the earliest stage. Alloys B-0.01 and B-0.03 precipitation starts later and ends later, and the alloy B-0.01 has the lowest β″ phase volume fraction. (b) shows the slopes of the lnln(1/(1−Y))-lnt curves, where n is also approximately 2 after linear fitting. The calculated activation energies in (c) of alloys B, B-0.01 and B-0.03 are 73.7, 90.8 and 82.0 kJ/mol, respectively, which means that the alloy B still has a better bake hardening response after long-term natural aging. Hence, the improvement of pre-aged alloy properties by Sn microalloying is no longer obvious after 5 months of natural aging ().
Table 4. Activation energy and kinetics equation of β″ after pre-aging and natural aging for 5 months.
In summary, the results after natural aging for 0 days show that the alloy B-0.03 has the most precipitated β″ phases and the strongest hardening ability; the alloy B-0.01 has a better bake hardening response. The results after natural aging for 5 months show that the pre-aged alloy B has the best bake hardening response, and both Sn-containing alloys have poorer bake hardening ability. Apparently, Sn effectively improves the hardening ability within a short natural aging period, but the advantage disappears after long-term natural aging.
To further verify the above mentioned DSC test results, alloys after the same solid solution and pre-aging treatments were naturally aged for 0 days and 5 months and then subjected to artificial ageing at 185 °C. The microhardness curves of alloys B, B-0.01 and B-0.03 are shown in . For samples after natural aging for 0 days, in (a), the three alloys exhibit the same hardness change trend but a slight difference in hardness values. During the first 120 min, the hardness value of the three alloys increases rapidly, reaching a peak hardness at 120 min of approximately 120 HV, and then the hardness fluctuated steadily. The hardness reaches the second peak at 1200 min and then drops significantly. The initial hardness of the alloys B-0.01 and B-0.03 is the lowest, approximately 75 HV, while that of the alloy B is slightly higher. The inserted graph shows that the hardness of the alloy B-0.01 grows with the fastest rate, i.e. the highest bake hardening response, corresponding to the obtained activation energy results as shown above. For samples after natural aging for 5 months, in (b), the hardness value of alloys B and B-0.01 are more or less the same, alloy B-0.03 is the lowest among them, approximately 92HV, indicating that natural aging causes the hardening, but with the increase of Sn content, the inhibitory effect on natural aging hardening is more significant. Within the first 50 min at 185°C, the hardness values of the three alloys constantly decrease due to the redissolution of GP zones or clusters that form during natural aging. As the baking time increases, the strengthening phase is precipitated again, and the hardness begins to rise until reaching the peak value, which is approximately 120 HV for the base alloy and 110 HV for Sn-containing alloys. Different from (a), there is only one hardness peak, after which it will drop continually.
Figure 12. Hardness changes of alloys aged at 185°C after natural aging for (a) 0 days and (b) 5 months.
To determine the reasons behind the hardness variation, precipitates in the peak aging states (aged for approximately 2 h at 185°C) of the base alloy B and alloy B-0.03 were characterised by HRTEM, fast Fourier transformation (FFT) and diffraction spot simulation. As shown in , in the peak-aged alloy matrix, there are uniformly distributed dot-like and needle-like precipitates. The dot-like morphology is the cross-section of the plug-in variant of the β″ phase, and the needle-like morphology is the flat variant of the β″ phase. There are great differences in the morphology, size and density of the strengthening phase for alloys in different states. For alloys with 0 days of natural aging, the size of the β″ phase in alloy B is shown in (a), which has a thicker and longer morphology than that in alloy B-0.03 as shown in (d), the cross-sectional diameter of the β″ phase is >4 nm, and the orientation relationship with the matrix is [0-10]β″//[001]Al, (601)β″//(200)Al, (−403)β″//(020)Al; While the cross-sectional diameter of the β″ phase in alloy B-0.03 is approximately 3-4 nm, the amount of β″ phase are similar in the two alloys (approximate 37 ± 5 in the view of current 10 nm scale bar image size), and its orientation relationship with the matrix is [010]β″//[001]Al, (601)β″//(200)Al, and (40-3)β″//(020)Al, it shows that the addition of Sn element inhibits the growth of β″ phase at the peak aging state. After 5 months of natural aging, the strengthening phases in the matrix of the alloy B and alloy B-0.03 are much less than those in the natural aging for 0 days, only 25 ± 5 in the view of current image were observed. The needle-shaped β″ phase became thinner, and the cross-sectional diameter was approximately 2-3 nm. However, the β″ phase in the alloy B as shown in (g) is slightly larger than that in alloy B-0.03 as shown in (j). The orientation relationship between the inserted β″ phase in alloy B and the matrix is [010]β″//[001]Al, (-403)β″//(200)Al, (601)β″//(020)Al. The orientation relationship between the inserted β″ phase in alloy B-0.03 and the matrix is [0-10]β″//[001]Al, (601)β″//(200)Al, (-403)β″//(020)Al.
Figure 13. The HRTEM morphology and precipitated phase characterisation at the peak-aged state of alloys after natural aging for 0 day and 5 months: (a–c) alloy B natural aging 0 day + 185°C 2 h, (d–f) alloy B-0.03 natural aging for 0 day + 185°C 2 h, (g–i) alloy B natural aging for 5 months + 185°C 2 h, (j–l) alloy B-0.03 natural aging for 5 months + 185°C 2 h.
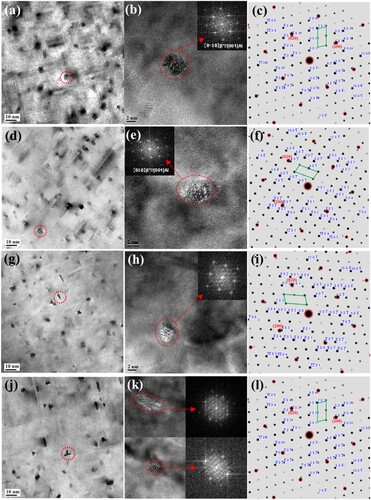
Above all, regardless of whether the alloys were naturally aged for 0 days or 5 months after the pre-aging treatment, the strengthening phase in the matrix was mainly the β″ phase. The number density of the β″ phase in the alloys B and B-0.03 in the same state are also similar, but the size is slightly different, which results in the alloy having no obvious difference in the hardness plateau area during artificial aging. However, after natural aging for 5 months, the size of the β″ phase in alloy B is relatively coarse, resulting in a higher hardness value.
4. Discussion
4.1. Effect of Sn on phase precipitation
The phase diagram with Sn variation was calculated by Thermo-Calc 2021a with the TTAL7 database and MALDEMO for kinetic calculations. The red lines represent two Sn-containing alloys B-0.01 and B-0.03, the Y axis represents the base alloy B, and the red boxes highlight the phase that varied with chemical composition or temperature.
As shown in , with increasing Sn content, the phase field ‘ALPHA + FCC_A1 + MG2SI’ within 300-550°C was reduced, but the following phase field ‘ALPHA + FCC_A1 + MG2SI + MG2X_C1’ within 230-300°C was enlarged. Sn addition improves the precipitation temperature of the MG2X_C1 phase (which is suggested to be Mg2Sn by composition) from approximately 220 to 320°C. At approximately 220°C, the precipitation of MgZn2, black line, was lowered by increasing Sn content, which is divided into two phase fields but with the same constituents ‘AL2CU + AL3M_D022 + ALPHA + FCC_A1 + MG2SI + MG2X_C1’, where the AL3M_D022 phase was an Fe-rich phase. The upper phase field remains tiny to the Y-axis, which can be concluded to be a small fraction of the Fe-rich α phase (particles in the Q phase) that increased with Sn addition.
Figure 14. Phase diagram of studied alloys versus mass percent of Sn content.
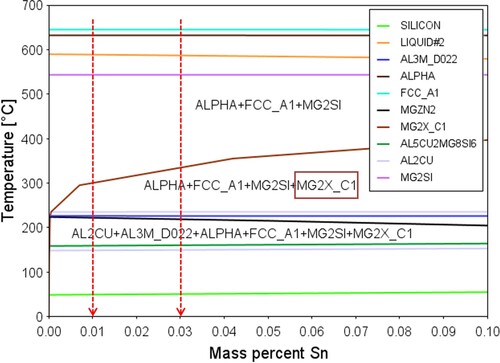
The pre-formed Mg2Sn phase (MG2X_C1 in ) in Sn-containing alloys B-0.01 and B-0.03, will act as nuclei sites for Fe-rich phase and thereby accelerating the precipitation and growth of Fe-rich phase. As observed in , the Fe-rich phase in alloy B-0.03 is larger in size (net-like shape) than that in alloy B-0.01 and alloy B. The difference in Fe-rich phase (as Al matrix grain boundaries) further caused different grain size of Al matrix in the three alloys.
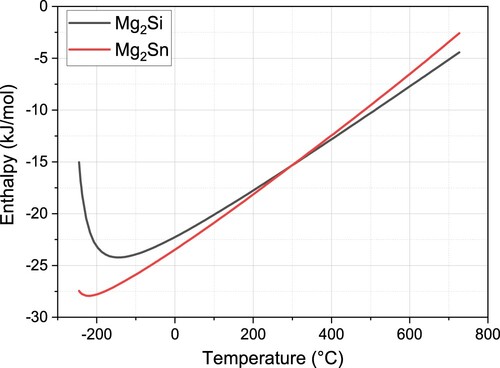
also assists in explaining the effect of Sn on Mg- phase formation in the Sn-containing system. According to the standard molar enthalpy of formation, Mg2Si is more easily formed at temperatures higher than 300°C, and Mg2Sn is more easily formed at temperatures lower than 300°C. Therefore, unlike conventional Al-Mg-Si systems, Sn-containing alloys also have a Mg2Sn phase, which competes with Si and consumes Mg atoms. The ratio among Mg, Si and Sn is essential to the system stability, hardness tendency and precipitation. For example, the lower hardness value of Sn-containing alloys shown in can be explained by (a) Sn trapping vacancies to avoid precipitates and (b) Sn-containing precipitates having lower hardness values. However, all reasons contribute to a general lower energy and hence stabilise the system.
Figure 15. Standard enthalpy of reaction forming Mg2Si and Mg2Sn in the B-0.03 system.
Basically, the phase diagram conveys rough information on the phase precipitation/transformation sequence. In terms of our specific chemical composition, the Fe-rich phase in the calculation and SEM experimental results can correspond well.
4.2. Effect of Sn on formation of GP zones
Since a strong effect of Sn on the natural ageing resistance was observed in the hardness measurements of and , the effect of Sn on the quenching state was explained in the last section and study, which concluded that the Sn atoms trapped vacancies at low temperatures and released vacancies at higher temperatures; hence, a lower hardness value can be obtained during NA after solid solution and quenching. The same reason was also applied to our hardness tendency in . However, the PA alloys in have different situations than quenched alloys, and a relatively higher hardness value was measured after PA treatment, which is believed to be related to the formation of GP zones. Therefore, the formation temperature and precipitating fraction of GP zones were theoretically calculated by Thermo-Calc. During the calculation, we assume that the GP zones have an FCC structure and remove the stable FCC phase (matrix phase) from the system. Then, the remaining metastable FCC structure was fixed from the coherence matrix and allowed us to evaluate the precipitation behaviour. The calculation results are shown in .
Figure 16. Precipitation temperature and precipitating fraction of GP zones versus Sn content.
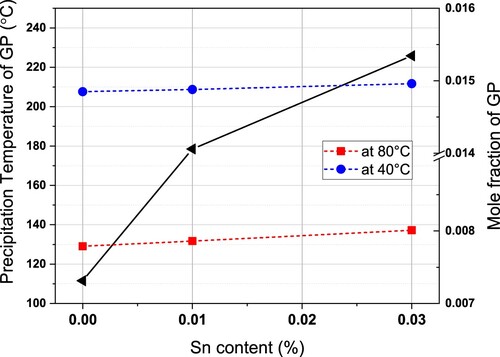
The black line shows that the formation temperature of the GP zones is increased with Sn addition; 0.01% Sn lifts the formation temperature by 70°C, while 0.03% Sn lifts the formation temperature by 100°C. The higher the formation temperature is, the greater the degree of undercooling, the greater the driving force for precipitation. A theoretically higher hardness value relating to more GP zones is expected, but we also need to take the chemical compositions into account.
The expected fraction of GP zones after PA treatment is also shown as red and blue lines. At 80 °C (red line), at the beginning of PA treatment, the alloy B-0.03 contained more GP, the alloy B-0.01 contained less GP and the alloy B contained the least GP. However, with temperature cooling down, the fraction at 40°C (blue line), at the end of PA treatment, did not show much difference. In the final PA microstructure, the fractions of GP zones are similar in the three alloys, but the morphology, structure, and chemical composition are different. A relatively larger size of GP zones in Sn-containing alloys can be assumed, while alloy B precipitates small GP zones with relatively higher number density. The explanations for are as follows: (a) the formation of GP zones after PA causes a higher hardness than the quenched state in , (b) Sn participates in forming GP zones that are softer, B-0.03 has the lowest hardness, and (c) the larger size offsets the drawback of Sn being softer in the alloy B-0.01.
To further understand the difference in GP zones in the three alloys, the composition of the GP zones was also calculated. As shown in and , Zn and Mg are dominant elements that account for approximately 60% and 40%, respectively. Different from conventional alloy systems and traditional Mg-Si clusters, Zn participates most in our studied alloys. The remaining elements Cu, Al, Si and Sn together only account for approximately 1% of the mole fraction. To obtain a visible view of alloying elements, plots the minor chemical composition, excluding dominant Zn and Mg elements. At 80°C, precipitates contain more Al than Cu and others. At 40°C, Cu was much higher than the rest, indicating continuous Cu diffusion into precipitates during PA treatment. Si did not change much with alloys or temperatures. Sn was expected to be more in the alloy B-0.03 at 80°C and then gradually lowered the ratio to half at the end of the PA process. Same tendency of Sn in alloy B-0.01 was expected.
Figure 17. Chemical composition of GP zones in different alloys and at different temperatures.
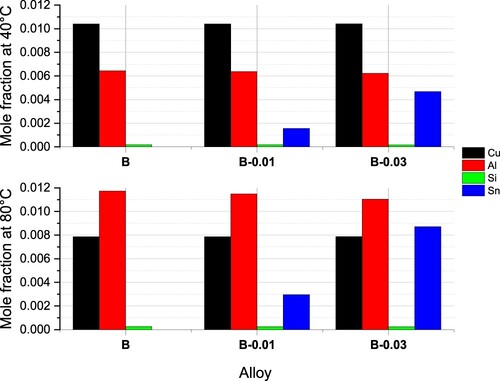
Table 5. Chemical composition of GP zones calculated by Thermal-Calc (mole fraction, %).
Above all, after the pre-aging treatment, most Sn participates in precipitation, and the low hardness value of Sn-containing alloys can be mainly attributed to the Sn-containing soft precipitates rather than Sn-free precipitates. The continuous growth of precipitates during natural aging caused the hardness to increase, as shown in . The alloy B-0.01 increased most compared with the other two alloys: the alloy B with stable Sn-free precipitates and the alloy B-0.03 with relatively large but soft precipitates.
4.3. Effect of Sn on precipitation behavior during aging
As discussed above, the effect of PA treatment and Sn micro-alloying on GP zones was evaluated; then, during the following aging process, GP zones are crucial for forming hardening phase β″. Conventional studies believe that β″ can directly grow from existing GP zones. However, in our study, the GP zones are expected to have a MgZn2 structure instead of Mg-Si clusters, so the chemical composition and the stability of GP zones are the main reasons for the difference in activation energy of the β″ phase measured by DSC in and and . To form a Mg-Si-based β″ phase, Si atoms need to join MgZn2, while at the same time excluding Zn atoms gradually, Sn plays a significant role in MgZn2 collapse.
At a β″ forming temperature higher than 200°C, Mg-Si then takes over the main role from Mg-Sn according to enthalpy in . Therefore, the GP zones in Sn-containing alloys would induce Si atoms to first and more easily transfer to Mg-Si-(Zn) clusters. Alloy B-0.01 finished most quickly and then left nucleation sites for the β″ phase for the less Sn-containing alloy, followed by the alloy B-0.03, but probably left more Sn-vanishing sites and hence more β″ phase, as shown in , the larger β″ peak area, and at the last alloy B, which only counted on the diffusion of Si and Zn. Therefore, the least active energy was observed in the alloy B-0.01, followed by the alloys B-0.03 and B. It should also be noted that the rate parameter k0 varied with alloys; the slowest rate parameter in B-0.01 can be attributed to fewer nucleation sites, the faster rate in B-0.03 to more nucleation sites, and the fastest rate in B to the later starting storage energy caused by the temperature increase.
Additionally, the growing process of β″ explained above can be observed in hardness change during artificial aging process in (a), within the first hundred h, the hardness of B-0.01 are the highest, alloys B and B-0.03 are lower and more or less the same, after reaching peak hardness, three alloys are tangled and have similar values but look further B-0.01 can be seen as the lower position.
The DSC results of PA-treated samples after NA for 5 months show a large discrepancy in changing tendency, as shown in and and . The lowest activation energy of the β″ phase was detected in the alloy B, which was even easier to precipitate than that in the NA 0 d sample. The highest was in alloy B-0.01, B-0.03 in the middle. Compared with the activation energy in , alloy B decreased, alloy B-0.01 increased considerably, and alloy B-0.03 also increased slightly. However, shows that the hardness during NA for 5 months all increased, with contributions of approximately 15, 20, and 20 HV from precipitates during the NA process. (b) shows a decrease in hardness at 185°C within the first hour, which corresponds to the dissolution of precipitates. After precipitate dissolution, the hardness dropped to 85 ± 5 HV, which was still higher than the initial value in . Therefore, there is a stable phase formed during NA, which causes a general hardness increase of 5–10 HV for all 3 alloys; in other words, the Sn-containing/free Mg-Zn structures have already been changed/replaced by Mg-Si clusters/phase (TEM detected only the β″ phase with no other strengthening phase [Citation15]), and Sn also precipitates in a more stable format, which is why (a) shows an endothermic area at approximately 200°C but (b) is much flatter for alloys B and B-0.01.
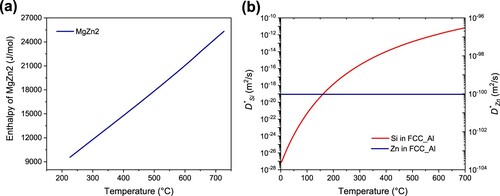
As shown in (a), the standard formation molar enthalpy of MgZn2 is positive, which means that the reaction of forming MgZn2 structures is endothermic (and this phase is not very stable). The exothermic area at approximately 200°C in (a) can be attributed to the decomposition of the MgZn2 structure. Considering the diffusion coefficient of Zn and Si in alloys, as shown in (b), during the long NA process, once the MgZn2 structure starts decomposing, Si or Sn will immediately diffuse to occupy and combine with Mg without the MgZn2 dissolution process, making β″ phase formation easier (lower energy) in the alloy B. Due to the high chance that the MgZn2 structure did not decompose during the NA process due to the precipitation temperature contribution from Sn, an exothermic area would still exist in the alloy B-0.03. For the alloy B-0.01 in the middle, both situations coexisted, and the Mg-Zn-(Sn) and Mg-Si structures worked together, contributing to the highest hardness in . Due to the stable phase formation, related elements were consumed, B-0.01 would need the most energy for β″ phase formation, the consuming elements also cause less β″ phase at 185°C and lower hardness value in alloys B-0.01 and B-0.03 in (b).
Figure 18. Thermo-dynamic calculation of Mg, Si, Zn behaviours in studied alloy systems (a) Standard molar formation enthalpy of MgZn2 (b) Tracer diffusion coefficient of Si and Zn in the alloy matrix. Note: the content of Sn won’t affect the behaviours of other elements in our calculation.
Another difference between the artificial aging hardness changes of the samples with NA-0 and NA-5 months is the presence of a hardness plateau. Based on the above precipitate/element analysis, the reason for the plateau in (a) can be thought of as a continuous formation process of β″ and continuous transformation to the (Q′ + β′) phase. The peak overlap in the DSC curve can explain this dynamic hardness balance in the plateau. In (b), the plateau changes to a slow tendency, and apparently, the continuous transformation to the (Q′ + β′) phase over the amount of β″ formed due to the element consumption of NA and forming a stable phase.
Accordingly, the formation of a stable phase during the NA process makes the system more stable from both the energy and element sides. Therefore, the activation energy of the β″ phase in Sn-containing alloys is much higher. In contrast, alloy B has a lowered forming energy of β″ phase, and it can be concluded that all precipitates/phases formed during NA are Sn-free and uniform Mg-Si clusters that can act as nucleation sites for the β″ phase. In this case, the K0 parameter cannot be used as an evaluation criteria due to systemic limitations.
5. Conclusions
The addition of Sn can accelerate the precipitation and growth of the intergranular phase in the as-cast state, resulting in a large net-shaped Fe-rich phase that more easily formed in Sn-containing alloys; Sn also accelerates the redissolution and spherodiation of the Fe-rich phase during homogenisation treatment, resulting in a more rod-shaped phase spherodised to particles (α) in Sn-containing alloys. Taking both opposite acceleration effects into account, the alloy B-0.01 contains the least Fe-rich phase for the (rod shaped) precipitation effect < redissolution effect, while the alloy B-0.03 contains the most/largest Fe-rich phase for the(net shaped) precipitation effect > redissolution effect.
The difference in the distribution of Fe-rich phase particles further causes differences in texture components and mechanical properties. Although the content of Sn led to microstructures that evolved in discrepant directions, both the alloys B-0.01 and B-0.03 weakened textures to different extent, accordingly improving the formability by reducing the yield strength, which can be attributed to the combined size effect of spheroidised and crushed Fe-rich phase particles.
For solution-treated samples, Sn-containing alloys show better natural aging stability than the alloy B, and the alloy B-0.03 shows better stability than the alloy B-0.01. For pre-aged samples, Sn-containing alloys show lower hardness in a short time; after 2 h, the hardness rises faster than that of the base alloy B.
The DSC analysis results, together with thermodynamic simulations, explain the reason behind the hardness change. Sn addition affected the precipitation temperature/behaviour of GP zones and further affected the precipitation behaviour during aging, as a result affecting the precipitation of the β″ phase. The β″ phase, proven by TEM observation, is still the main strengthening phase of bake hardening.
Based on all experimental results and thermo-dynamic discussions, a new precipitating sequence during aging after PA treatment was proposed in the studied alloys, B: GP zones (MgZn2 structure) →MgZn2 decomposition + Mg-Si formation →β″; B-0.01: GP zones (MgZn2Sn structure) →MgZn2Sn growth less + Mg-Si formation →β″; B-0.03: GP zones (MgZn2Sn structure) →MgZn2Sn growth more → MgZn2 decomposition + Mg-Si formation →β″; after forming β″, the sequence is changed as → (new β″ + transformed β′ + Q′) for PA samples, and → (transformed β′ + Q′) for PA + NA samples.
Disclosure statement
No potential conflict of interest was reported by the author(s).
Additional information
Funding
References
- J. Zhou, X. Wan and Y. Li, Advanced aluminium products and manufacturing technologies applied on vehicles presented at the EuroCarBody conference. Mater. Today Proc. 2(10A) (2015), pp. 5015–5022. doi:10.1016/J.MATPR.2015.10.091.
- J. Du, A. Zhang, Y. Zhang, et al., Atomistic determination on stability, cluster and microstructures in terms of crystallographic and thermo-kinetic integration of Al−Mg−Si alloys. Mater. Today Commun. 24 (2020), pp. 101220. doi:10.1016/j.mtcomm.2020.101220.
- H. Zhong, P.A. Rometsch, Q. Zhu, et al., Effect of pre-ageing on dynamic strain ageing in Al-Mg-Si alloys. Mater. Sci. Eng. A 687 (2017), pp. 323–331. doi:10.1016/j.msea.2017.01.051.
- Z. Yang, Z. Liang, D. Leyvraz, et al., Effect of pre-ageing on natural secondary ageing and paint bake hardening in Al–Mg–Si alloys. Materialia 7 (2019), pp. 100413. doi:10.1016/j.mtla.2019.100413.
- L. He, H. Zhang and J. Cui, Effects of pre-ageing treatment on subsequent artificial ageing characteristics of an Al-1.01Mg-0.68Si-1.78Cu alloy. J. Mater. Sci. Technol. 26(2) (2010), pp. 141–145. doi:10.1016/S1005-0302(10)60023-0.
- L. Zhang, K. Li, H. He, et al., Influence of prolonged natural aging followed by artificial aging on tensile properties and compressive behavior of a thin-walled 6005 aluminum alloy tube. J. Centr. South Univ. 28 (2021), pp. 2647–2659. https://link.springer.com/article/10.1007%2Fs11771-021-4799-2/metrics.
- O. Pracha, O. Trudonoshyn, P. Randelzhofer, et al., Multi-alloying effect of Sc, Zr, Cr on the Al-Mg-Si-Mn high-pressure die casting alloys. Mater. Charact. 168 (2020), pp. 110537. https://www.x-mol.com/paperRedirect/1286736451143909376.
- J. Rakhmonov, G. Timelli and F. Bonollo, Characterization of the solidification path and microstructure of secondary Al-7Si-3Cu-0.3Mg alloy with Zr, V and Ni additions. Mater. Charact. 128 (2017), pp. 100–108. doi:10.1016/j.matchar.2017.03.039.
- Q. Zheng, J. Wu, H. Jiang, et al., Effect of micro-alloying element La on corrosion behavior of Al-Mg-Si alloys. Corros. Sci. 179 (2021), pp. 109113. https://www.x-mol.com/paperRedirect/1326743470565662720.
- S. Zhu, Z. Li, L. Yan, et al., Natural aging behavior in pre-aged Al-Mg-Si-Cu alloys with and without Zn addition. J. Alloys Compd. 773 (2019), pp. 496–502. doi:10.1016/J.JALLCOM.2018.09.244.
- Y. He, H. Xi, W. Ming, et al., Thermal stability and precipitate microstructures of Al−Si−Mg−Er alloy. Trans. Nonferrous Metals Soci. China 31(1) (2021), pp. 1–10. doi:10.1016/S1003-6326(20)65474-7.
- X. Yang, B. Xiong, X. Li, et al., Effect of Li addition on mechanical properties and ageing precipitation behavior of extruded Al−3.0Mg−0.5Si alloy. J. Centr. South Univ. 28 (2021), pp. 2636–2646. https://link.springer.com/article/10.1007%2Fs11771-021-4798-3/metrics.
- Y. Pazhuhanfar and B. Eghbali, Processing and characterization of the microstructure and mechanical properties of Al6061-TiB2 composite. Int. J. Miner. Metall. Mater. 28 (2021), pp. 1080–1089. doi:10.1007/s12613-021-2288-0.
- H. Ebrahimzadeh, H. Farhangi and S.A.A.A. Mousavi, Microstructural analyses of aluminum-magnesium-silicon alloys welded by pulsed Nd: YAG laser welding. Int. J. Miner. Metall. Mater. 27 (2020), pp. 660–668. doi:10.1007/s12613-020-2027-y.
- M.X. Guo, G.J. Li, Y.D. Zhang, et al., Influence of Zn on the distribution and composition of heterogeneous solute-rich features in peak aged Al-Mg-Si-Cu alloys. Scr. Mater. 159 (2019), pp. 5–8. doi:10.1016/j.scriptamat.2018.09.004.
- T. Honma, D.W. Saxey and S.P. Ringer, Effect of trace addition of Sn in Al-Cu alloy. Mater. Sci. Forum 519-521 (2006), pp. 203–208. doi:10.4028/www.scientific.net/MSF.519-521.203.
- S. Pogatscher, H. Antrekowitsch and M. Werinos, Diffusion on demand to control precipitation aging: application to Al-Mg-Si alloys. Phys. Rev. Lett. 112 (2014), pp. 225701. doi:10.1103/PhysRevLett.112.225701.
- M. Werinos, H. Antrekowitsch, T. Ebner, et al., Design strategy for controlled natural aging in Al-Mg-Si alloys. Acta Mater. 118 (2016), pp. 296–305. doi:10.1016/j.actamat.2016.07.048.
- M. Werinos, H. Antrekowitsch, T. Ebner, et al., Hardening of Al–Mg–Si alloys: effect of trace elements and prolonged natural aging. Mater. Des. 107 (2016), pp. 257–268. doi:10.1016/j.matdes.2016.06.014.
- M. Werinos, H. Antrekowitsch, E. Kozeschnik, et al., Ultrafast artificial aging of Al–Mg–Si alloys. Scr. Mater. 112 (2016), pp. 148–151. doi:10.1016/j.scriptamat.2015.09.037.
- C. Liu, P. Ma, L. Zhan, et al., Solute Sn-induced formation of composite β′/β″ precipitates in Al-Mg-Si alloy. Scr. Mater. 155 (2018), pp. 68–72. doi:10.1016/j.scriptamat.2018.06.028.
- C. He, B. Luo, Y. Zheng, et al., Effect of Sn on microstructure and corrosion behaviors of Al-Mg-Si alloys. Mater. Charact. 156 (2019), pp. 109836. doi:10.1016/j.matchar.2019.109836.
- M. Liu, X. Zhang, B. Körner, et al., Effect of Sn and In on the natural ageing kinetics of Al–Mg–Si alloys. Materialia 6 (2019), pp. 100261. doi:10.1016/j.mtla.2019.100261.
- X. Zhang, M. Liu, H. Sun, et al., Influence of Sn on the age hardening behavior of Al–Mg–Si alloys at different temperatures. Materialia 8 (2019), pp. 100441. doi:10.1016/j.mtla.2019.100441.
- W. Tu, J. Tang, Y. Zhang, et al., Influence of Sn on the precipitation and hardening response of natural aged Al-0.4Mg-1.0Si alloy artificial aged at different temperatures. Mater. Sci. Eng. A 765 (2019), pp. 138250. doi:10.1016/j.msea.2019.138250.
- F. Lotter, D. Petschke, F.D. Geuser, et al., In situ natural ageing of Al-Cu-(Mg) alloys: the effect of In and Sn on the very early stages of decomposition. Scr. Mater. 168 (2019), pp. 104–107. doi:10.1016/j.scriptamat.2019.04.031.
- G. Lu, S. Nie, J. Wang, et al., Enhancing the bake-hardening responses of a pre-aged Al-Mg-Si alloy by trace Sn additions. J. Mater. Sci. Technol. 40 (2020), pp. 107–112. doi:10.1016/j.jmst.2019.08.045.
- W. Tu, J. Tang, Y. Zhang, et al., Effect of Sn and Cu addition on the precipitation and hardening behavior of Al-1.0Mg-0.6Si alloy. Mater. Sci. Eng. A 770 (2020), pp. 138515. doi:10.1016/j.msea.2019.138515.
- S. Dai, Z. Bian, W. Wu, et al., The role of Sn element on the deformation mechanism and precipitation behavior of the Al–Cu–Mg alloy. Mater. Sci. Eng. A 792 (2020), pp. 139838. doi:10.1016/j.msea.2020.139838.
- M.H. Alvi, S.W. Cheong, J.P. Suni, et al., Cube texture in hot-rolled aluminum alloy 1050 (AA1050): nucleation and growth behavior. Acta Mater. 56(13) (2008), pp. 3098–3108. doi:10.1016/j.actamat.2008.02.037.
- J. Hirsch, E. Nes and K. Lücke, Rolling and recrystallization textures in directionally solidified aluminium. Acta Mater. 35 (1987), pp. 427–438. doi:10.1016/0001-6160(87)90249-5.
- J. Hjelen, R. Ørsund and E. Nes, On the origin of recrystallization textures in aluminium. Acta Metall. Mater. 39 (1991), pp. 1377–1404. doi:10.1016/0956-7151(91)90225-P.
- I. Samajdar and R.D. Doherty, Cube recrystallization texture in warm deformed aluminum: understanding and prediction. Acta Mater. 46 (1998), pp. 3145–3158. doi:10.1016/S1359-6454%2897%2900492-8.
- H.E. Vatne, R. Shahani and E. Nes, Deformation of cube-oriented grains and formation of recrystallized cube grains in a hot deformed commercial AlMgMn aluminium alloy. Acta Mater. 44 (1996), pp. 4447–4462. doi:10.1016/1359-6454(96)00077-8.
- R. Orsund and E. Nes, Effect of particles on recrystallization textures in aluminium-manganese alloys. Scr. Metall. 22(5) (1988), pp. 665–669. doi: 10.1016/s0036-9748(88)80179-0.
- X. Jiang, M. Galano and F. Audebert, Extrusion textures in Al, 6061 alloy and 6061/SiCp nanocomposites. Mater. Charact. 88 (2014), pp. 111–118. doi:10.1016/j.matchar.2013.11.009.
- Y.L. Liu, D.J. Jensen and N. Hansen, Recovery and recrystallization in cold-rolled Al-SiCw composites. Metall. Mater. Trans. A 23 (1992), pp. 807–819. doi:10.1007/BF02675558.
- Q. Liu, Z. Yao, A. Godfrey, et al., Effect of particles on microstructural evolution during cold rolling of the aluminum alloy AA3104. J. Alloys Compd. 482 (2009), pp. 264–271. doi:10.1016/j.jallcom.2009.03.183.
- H.E. Vatne, O. Engler and E. Nes, Influence of particles on recrystallisation textures and microstructures of aluminium alloy 3103. Mater. Sci. Technol. 13 (1997), pp. 93–102. doi:10.1179/mst.1997.13.2.93.
- O. Engler, Nucleation and growth during recrystallisation of aluminium alloys investigated by local texture analysis. Mater. Sci. Technol. 12 (1996), pp. 859–872. doi:10.1179/mst.1996.12.10.859.
- X. Wang, M. Guo, W. Peng, et al., Relationship among solution heating rate, mechanical properties, microstructure and texture of Al−Mg−Si−Cu alloy. Trans. Nonferrous Metals Soc. China 31(1) (2021), pp. 36–52. doi:10.1016/S1003-6326(20)65477-2.
- J. Sidor, A. Miroux, R. Petrov, et al., Microstructural and crystallographic aspects of conventional and asymmetric rolling processes. Acta Mater. 56(11) (2008), pp. 2495–2507. doi:10.1016/j.actamat.2008.01.042.
- F.J. Humphreys and M. Hatherly, Recrystallization and Related Annealing Phenomena, Elsevier Ltd, Amsterdam, 2004.
- L. Dawkwei, Prediction of the limiting drawing ratio and the maximum drawing load in cup-drawing. Int. J. Mach. Tools Manuf. 37(2) (1997), pp. 201–213. doi:10.1016/0890-6955(95)00107-7.
- C.S. Tsao, C.Y. Chen, U.S. Jeng, et al., Precipitation kinetics and transformation of metastable phases in Al-Mg-Si alloys. Acta Mater. 54(17) (2006), pp. 4621–4631. doi:10.1016/j.actamat.2006.06.005.
- S. Esmaeili and D.J. Lloyd, Characterization of the evolution of the volume fraction of precipitates in aged AlMgSiCu alloys using DSC technique. Mater. Charact. 55(4-5) (2005), pp. 307–319. doi:10.1016/j.matchar.2005.07.007.