
 ?Mathematical formulae have been encoded as MathML and are displayed in this HTML version using MathJax in order to improve their display. Uncheck the box to turn MathJax off. This feature requires Javascript. Click on a formula to zoom.
ABSTRACT
Information is key. Offshore wind farms are installed with supervisory control and data acquisition systems (SCADA) gathering valuable information. Determining the precise condition of an asset is essential on achieving the expected operational lifetime and efficiency. Equipment fault detection is necessary to achieve this. This paper presents a systematic literature review of machine learning methods applied to condition monitoring systems, using both vibration information and SCADA data together. Starting with conventional methods using vibration models, such as Fast-Fourier transforms to five prominent supervised learning regression models; Artificial neural network, support vector regression, Bayesian network, random forest and K-nearest neighbour. This review specifically looks at how conventional vibration data can be combined with SCADA data to determine the assets condition.
1. Introduction
The total capacity in Europe of installed wind power sat at 18,499 MW in 2018 which is an increase of 2649 MW from 2017 (WindEurope Citation2019). The industry has tended away from small clusters of wind turbines where maintenance is more accessible and the overheads of sending a team for regular intervals were not expensive. For offshore wind farms, the cost of maintenance relative to the levelised cost of energy (LCOE) is significantly increased compared to onshore. It is reported in the North-Sea that the operations and maintenance (O&M) cost between 20% and 25% of the LCOE compared to around 12% onshore (Röckmann, Lagerveld, and Stavenuiter Citation2017; Tavner Citation2012). The impact of the offshore environment coupled with increasingly expanding machines means that the maintenance strategy of planned, scheduled or responsive regime to incorporate a more proactive, predictive methodology. The key contributor to this shift in the industry is the intelligent monitoring of the structural health termed condition monitoring. Condition monitoring systems (CMS) are being developed by several operators. Companies monitor several parameters including; vibrations, oil quality and temperatures in some of the main assemblies (Martinez-Luengo, Kolios, and Wang Citation2016). This information is used to infer the health of the assets to determine the remaining useful life or to determine if scheduled maintenance is required based on the monitored irregularities. There is an additional cost of implementing supervisory control systems, which have deterred operators in the past but the financial benefit has eradicated skepticism (Clark and DuPont Citation2018). All large utility-scale offshore wind turbines have supervisory control and data acquisition (SCADA) systems to govern the performance. SCADA systems provide a magnitude of information over the operational life of a turbine providing updates at a resolution of 10 min. This paper is a continuation of Martinez-Luengo, Kolios, and Wang (Citation2016), which is carried out a detailed review of CMS, following the statistical pattern recognition paradigm. Developing this idea, this report seeks to understand the types of maintenance procedures implemented in offshore wind engineering. Focusing on current detection methods incorporating machine-learning techniques. Currently, there is a variety of review papers on how condition monitoring is beneficial when implemented correctly (Artigao et al. Citation2018; Zhou and Yin Citation2019). Others look at how predicting the structural health of a component using machine learning methods can determine scheduled maintenance (Scheu et al. Citation2019; Wan and Ni Citation2018). Most of which are looking at vibration methods or SCADA methods individually. This article investigates this but develops on the idea that they can complement the results from machine learning methods when used together. One of the major drawbacks of vibration-based methods is that the results are difficult to interpret without the help of an expert. Combining both sets of information compliment the analysis for easier insight and implementation on improving offshore-wind turbine operational management.
The remainder of this paper is constructed as follows: A methodology for the systematic review is portrayed in Section 2. In Section 3 and 4 is a review of 5 different machine learning methods and condition monitoring strategies. Finally, rounding the remaining sections with a discussion and conclusion separately.
2. Method
This review paper conducts a qualitative systematic review providing an exhaustive summary of current systems in place that tackle offshore wind monitoring and maintenance. The purpose of this review style is to restrict confirmation bias.
The systematic review procedure is developed based on Ioannou, Angus, and Brennan (Citation2017). This focuses on assessing what methods have been applied towards maintenance and monitoring. This study is only looking into five different regression type models. Refining this search helped manage the large volume of literature and streamline the process. The top five most commonly integrated regression methods are implemented in this paper. Observing that there are other regression methods such; Tobit, Cox, Poisson, Lasso and linear to name a few but they are less commonly applied in recent papers.
The process is as follows; both Google Scholar and Scopus were used to initialise the database, searching specifically for condition-based maintenance for offshore-wind turbine operational management. Then a limitation of the top five most used types of machine learning applied to SCADA data, and all vibration-based methods were included. Secondly, a limit from 2013 is set, removing duplicates from both searches. After this process was completed the initial screening process, with titles and abstracts are checked against a predetermined criterion for relevance. The thorough search screening for this paper ranks papers with higher citation having more recognition and importance in the community. At this point, a full paper consideration is taken. Noting, some significant works older than 2013 and other with limited citation works that have a large impact in this field are still included. Following the exhaustive search, a review of the most relevant information will be transcribed.
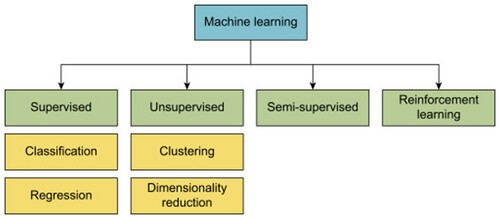
Figure 1. The types of machine learning. This is achieved by supervised learning, unsupervised learning, semisupervised learning, or reinforcement learning. Both Supervised and unsupervised can be further distinguished with classification and regression for supervised learning. Finally clustering, dimensionality reduction and Clustering in unsupervised learning.
3. Machine-learning
Machine-learning is the application of artificial intelligence (AI) that provides systems the ability to experience without explicitly being programmed. Nevertheless, machine learning is referred to as an area of artificial intelligence that is solely concerned with identifying patterns from data for predictions on unseen information. One of the most common definitions, by T. M. Mitchel (Citation1997) ‘A computer program is said to learn from experience E with respect to some task T and some performance measure P, if its performance on T, as measured by P improves with experience E’. In this section the types of machine learning methods will be discussed, detailing the nuances and how they are incorporated into the industry. Following that, a more in-depth discussion on 5 specific regression models that are both most commonly applied and are widely applicable at time-series data predictions are discussed. These are support vector regression (SVR), K-Nearest Neighbour, Bayesian Network, Gaussian Process Regression and Artificial Neural Networks (ANN).
Machine learning demands learning relevant patterns from data to make predictions. There are various ways in which this can be achieved from a vast variety of learning algorithms to select from (). Common taxonomy organises the different approaches into learning styles, based on this there are main categories of learning; supervised, unsupervised, semi-supervised and reinforcement. Supervised learning can be further coupled into classification or regression depending on either categorical or continuous targets respectively. The main task of unsupervised learning involves clustering and reducing the dimensionality of the input information.
3.1. Supervised learning
For supervised learning, the algorithm must have input variables and the target variables could be; severity of symptoms, the presence of credit card fraud or future clinical outcomes. The aim here is to develop an algorithm to determine the optimal function that captures the relationship between input and output target variables. This type of learning is often related to learning with a teacher, in this situation the teacher knows the correct answer and corrects the algorithm when a mistake is made. Therefore, requiring an iterative process of predictions and adjustment until the output prediction and targeted value has reached a maximal efficiency. The performance is estimated by comparing targeted values against unseen information.
3.1.1. Classification
The main aim of classification is to predict group membership, labels or classes, from observations. This type of algorithm is common in brain disorder research. Classification is advantageous for this problem since it can be broken into a categorical decision; for example, should the patient be medicated with A, B or C. In this case, the algorithm learns to distinguish the patient with a particular disease from healthy controls. There are a plethora of published articles that have used neuron-imaging data to determine disorders (Scheu et al. Citation2019; Wan and Ni Citation2018; Ioannou, Angus, and Brennan, Citation2017; Mitchell Citation1997; Kambeitz et al. Citation2015, Citation2017). A small niche is using motor signals to identify Parkinson’s disease (Koutsouleris et al. Citation2015). This motion can be extended to a multi-disorder diagnosis, where the algorithm can predict the probability of a patient having a particular disease (Schnack et al. Citation2014).
3.1.2. Regression
For a regression problem, the aim is to determine a score on a continuous scale. There are questions that cross-over with classifier and regression algorithms, but the outcome is continuous rather than a categorical variable. This characteristic is useful, when, predicting outcomes such as stock market trends or predicting meteorological trends, both follow a continuum.
There is a collection of survey articles related to the energy industry, for example (Voyant et al. Citation2017), applies regression models to determine the solar radiation to make predictions for photo-voltaic panels (Heinermann and Kramer Citation2016), similarly makes predictions on wind power forecasting (Zemene and Khedkar Citation2017), has applied various methods to determine consumer electric power consumption.
The level of functioning is completely different, in the clinical trials for classification models the output is distinguished between true and false. For the regression models applied to the energy market, the output has a quantitative value that can be ranked.
3.2. Unsupervised learning
As appose to supervised learning, in an unsupervised learning environment, there is no target value. The aim is to uncover underlying structures in data. There are two main approaches to unsupervised learning: clustering and dimensionality reduction.
3.2.1. Clustering
Clustering is an analytical technique to develop meaningful subgroups from large samples, such as subgroups from published journal papers. In this type of situation, the individual articles could be classed into smaller mutually exclusive, from non-defined, groups based on the similarities amongst them. Grid-mapping, used in image recognition or pattern recognition, is another area where clustering is effective. Noise from uncertain sensor measurements can be reevaluated (Zhu et al. Citation2019), have highlighted effective results.
3.2.2. Dimensionality reduction
In a situation where the number of features substantially outnumbers the number of observations, a dimensional reduction can be useful. The greater amount of features increases the visual complexity, a dimensional reduction is a process where reducing the number of random features under consideration replacing it with a principal set.
A dimensional reduction study on three-dimensional shape retrieval carried out in (Wang, Lin, et al. Citation2019) aims to gather the most pertinent shapes from two-dimensional images. Another study takes conventional household objects in CAD, uses ResNet library in Python, which is a deep neural network, to retrieve the original shape and alleviating computational demand, omitting redundant information. Shape descriptors are commonly used in text recognition software, A.A. Mohamed (Citation2020) has reviewed various Dimensionality reduction text recognition methods. The handwritten text has considerable amounts of ambiguity and redundancies. These methods seek to retrieve the most relevant information to determine the text.
3.3. Semi-supervised learning
As the title suggests, when target variables are only available for a portion of the data. Semi-supervised learning addresses the issue by allowing the model to integrate the available unlabelled features for supervised learning. This approach is effective when it is unpractical or expensive to attain the measured target data.
Soft sensors or virtual sensors are used in chemical plants, where several measurements are processed together where the interaction of the signals can be used to determine quantities that need not be measured. The process of predicting important, difficult-to-measure quality variables is investigated by Shao, Ge, and Song (Citation2019). Melt index, concentration and octane numbers are determined using semi-supervised learning to determine the quality of the ammonia extraction. This approach maximised the amount of input data in the context of this study with the finite amount of information from labelled samples.
3.4. Reinforcement learning
Reinforcement learning aims to build a system whereby it can learn from the interactions from its environment, much like the operant conditioning Sutton and Barto (Citation1998). For this type of learning, the algorithm’s conduct is shaped by a sequence of rewards and penalties, which are dependant on whether the decision is towards the final goal, that is set by the programmer. As opposed to supervised learning, where the examples are given to model the behaviour, reinforcement learning is allowed to develop its path, based on trial and error. This is one of the most promising areas of machine learning for autonomous control of vehicles. A model-free reinforcement algorithm developed by Chen-Huan Pi et al. (Citation2020) has a quad-copter tracing a predetermined path subjected disturbances. The algorithm rewards the system when the trajectory is as efficient at following the predetermined path subsequently minimising the error.
Machine learning is an emerging topic within artificial intelligence that is gaining momentum in all research fields. With each individual industry developing different topics within the AI field. The nature of this, for the most part is open source which allows an easy transfer of knowledge between industries. Machine learning is concerned with identifying patterns from data and subsequently using these patterns to make predictions for unseen data. This is a stark contrast from inferential statistics that seek explanatory power. Contrary to popular belief, classical statistics is not capable of making inferences at a singular level. It is important to understand that there are significant challenges with regards to machine learning, it requires a larger number of observations, whereas as some statistical inferences require less. This issue is being addressed with major developments in transfer learning or domain adaptation, among other methods.
4. Models
Machine learning is a growing area with a magnitude of methods to select from. In the previous section, only the basic procedure is explained. Supervised learning is a common type of machine learning for condition-based maintenance. The following section will provide a more detailed discussion on classification and regression models, introducing the fundamental concepts behind them. Before digging into the details of these models it is important to divulge the process of dealing with raw data.
Pre-processing temporal data are mandatory to improve the final model accuracy. The mote of errors could be, incomplete data, noisy or inconsistent. The following process can be implemented:
Feature extraction involves cases where data sources from multiple databases and it may need to be integrated into a single data set. In the case of offshore wind, one may want to extract vibrational features from the metalogical data.
Data reduction involves reducing the size of the data through a subset selection, feature selection or data transformation. This can be handled using row reduction and column reduction. This generally improves the efficiency of the algorithm by removing irrelevant records, improving the quality of the data.
Data cleaning is a widely studied practice that can be carried out using varying methods for time-series data (Burman and Otto Citation1988) and (Fox Citation1972) have discussed potential options. Alternatively, for high dimensional data (Aggarwal and Yu Citation2001) explores other methods. It involves potentially removing noisy data points or replacing it. This handles missing and incorrect entries.
Data splitting, consists of three sets; training set, which is used for learning. The Validation set is used to tune the parameters of the model and the testing set is used to assess the performance of the fully trained model. This is most commonly used in ANN, however, it is not employed in all ML process.
This process is carried out to provide more accurate and efficient results. The following subsections discuss the underlying features of; ANN, SVR, K-nearest neighbours, Dynamic Bayesian network and Gaussian regression.
4.1. Artificial neural network
ANN have developed since the 1940s by McCulloch and Pitts (McCulloch and Pitts Citation1943) and the learning rule of ANN is based on simple neuron-like logic called a perceptron. A single neuron which is a universal approximator of a smooth surface. The connection strength between artificial neurons is called ‘Hebbian learning’ (Hebb Citation1949) ANNs took off in the 1980s when; Werbos (Citation1974), Parker (Citation1982) and Rumelhart, Hinton, and Williams (Citation1986) all worked on backpropagation; hence, systematic learning can be achieved. The human brain is a vast network of connections coupled with sensory receptors that perform the simple task of receiving and passing on signals. If the signal is strong enough it passes the information on, otherwise, it is rejected. This is the building block for the ANN, with the structure depending on the architecture. Dendrites are assimilated to the inputs of the signal, collating the information along the cell body. The myelinated axion is the functioning body of the neuron processing the information and at the axon terminal, the information is passed on to the subsequent neuron. Learning in ANNs is commonly carried out using backpropagation optimisation. Originally it was considered that a synaptic signal was either 1 or 0. For an optimisation problem, discontinuous trends are difficult to solve. Rao and Rao (Citation1998) considered the synaptic strength to be a continuous fixed function. Recently have been developments implementing the self-adjusting threshold discussed in Werner et al. (Citation2019). One of the most significant advantages of ANNs is the ability to predict non-linear, complex behaviour effectively. This success is directly proportional to the selected instances. When presented with incomplete information ANNs can still produce results. ANNs are dependant on the samples, with limited information the accuracy is hindered. This also means that large quantities of data are necessarily imposing a hardware requirement. But there are developments in domain adaptation (Wang, Michau, and Fink Citation2019). This method transfers knowledge from other related data-sets to improve the performance of machine learning methods when there is limited amounts of data for specific tasks.
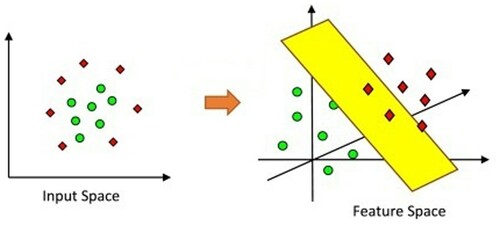
Figure 2. The transformation from input data into feature space for a greater fit (Gholami and Fakhari Citation2017).
4.2. Support vector regression
Due to some of the shortcomings from ANN, the so-called SVR was developed in the 1990s for non-linear regression and classification problems by V. Vapnik (Citation1998). There are three main reasons for SVR’s success; reliable training efficiency with small samples, the robustness against error models and its computational efficiency compared to other methods such as ANN (Martinez-Ramon and Cristodoulou Citation2006; Wang Citation2005). In the training process of machine learning techniques, it is often assumed that the larger the sample, the error function will decrease. This can result in what is known as overfitting (Duda, Hart, and Stork Citation2002), where a complicated function is designed to reduce the loss of estimated target and desired output. This yields very accurate results in the training stage, but the estimation is poor. This is not consistent with SVRs.
SVRs aim to generate a function by separating the variables with a hyperplane. To determine the two classes separating the hyperplane a suitable regularisation model is required for the training stage. Vapnik-Chervonekis developed the basis of SVR (Cristianini and Shawe-Taylor Citation2000), the Kernel function (Mercer Citation1909), this transforms the input space into feature space or Hilbert space so that non-linear input data can be modelled more accurately (). An approximation of this can be (Smola and Schölkopf Citation2004):
where
are Lagrange multipliers for N training variables and b is a constant real number. For this instance a Gaussian radial bias kernel function can be used with σ, a tuning parameter:
4.3. K-nearest neighbour
Similar to the previous machine learning methods, K-nearest neighbour (K-NN) presumes that the current time series will exist in the future. This method differs from the other methods in this article since the training of the algorithm is considered ‘lazy learning’, where learning is a generalisation of the input data as opposed to training the algorithm before receiving queries in ‘eager learning’. The objective is therefore to determine the present value based on a generalisation of past values. This is evolved from Kantz and Schreiber (Citation2004).
The algorithm’s aim is to determine the Euclidean distance from the present and past variables, while some other less common distances can also be used (O’Hagan Citation1978). Locating the closest distance of the variables from the learning data to determine the output. The distance is given by:
where a1(x) denotees the 1st feature instance of x. To determine the K-NNs the value
as the estimate of f(xq) is the most frequent value of f among the K-NN can be represented as:
with υ(a,b) = 1 if a = b else υ(a,b) = 0. This is one of the simplest machine learning methods. Since there is no training necessary it can be considered faster at making decisions. However, with large multidimensional data sets, the algorithm does not perform well since it is more difficult to determine the Euclidean distance.
4.4. Dynamic Bayesian network
Dynamic Bayesian networks (DBN) are directed graphs representing a set of variables and their condition dependence (Pearl Citation1988). BNs constitute both quantitative and qualitative analysis. The quantitative section involves prior and conditional probabilities for each node and the qualitative section involves arcyclic graphs. Each node represents a random variable. The arcs represent the cause–effect relationships or dependence’s between the nodes. The joint distribution between variables of vector is X, the network is represented by:
with values of variable xi and pa(xi) denoting an instant of the parents of X.
BNs is a set of conditional independence statements; this is the main consideration when building the model. This can be determined by employing the rules of d-separation. Using this method the joint probability distribution for a set of random variables can be determined using the chain rule. Dynamic BNs are an extension of BNs; typically they partition the variables into input, hidden and output variables for a state-space model. This can tackle discrete-time stochastic models.
4.5. Gaussian process regression
A Gaussian process (GP) is a multi-variable probabilistic approach applied to regression and classification machine learning problems. GP algorithms are stochastic processes, that can model multivariate infinite vectors. The process can be defined for a random set of variables x as mean m(x) and covariance k(x,x') (Rasmussen and Williams Citation2006):
GP regression determines marginal Gaussian distributions from the training data and can describe non-linear trends as an output function. Essentially GP is a non-parametric generalisation of a joint-normal distribution of an infinite set on input variables, defined by the mean and karnel function (Rasmussen and Williams Citation2006). A typical common karnel is the squared exponential karnel used in Tolba et al. (Citation2019):
with l being a length scale. The function determines a probabilistic accuracy, meaning that the output from this process has a predetermined confidence interval. This is advantageous as there is uncertainty associated with the output function. The Gaussian process is also versatile since there is a variety of covariance functions for varying problems however, this does raise the issue of implementing the correct Kalman filter (Hartikainen and Särkkä Citation2010).
Machine learning is continually adapting, with huge amounts of investment from large international organisations and research institutions. This article has only selected several models that are suited towards time-series problems but there are vast amounts of other models for different challenges. There is no consensus on what is the most desirable methodology, there are guides and books but no concrete standardisations for confidant, accurate model implementation.
5. Data-driven decision making for wind turbine operational management
The maintenance of an offshore wind farm can be categorised into two approaches; preventative and corrective maintenance. The latter applies to the run-to-failure approach, which inherently risks cascading failures with the potential of catastrophic loss. This approach is also likely to cause greater downtimes since planning for maintenance is followed by the failure event.
In contrast, the preventative-based maintenance philosophy aims to repair a component before failure, this is broken into two subcategories: calendar-based maintenance or condition-based maintenance. Calendar-based maintenance is performed by annual or semi-annual visits or scheduled replacements based on the operational life of the component. A more effective approach is condition-based maintenance, where the components are repaired based on the health of the part. This strategy aims to predict failure before it occurs so that the scheduling can be planed earlier in a corrective manner to reduce downtime. Producing accurate predictions of the remaining useful life of an asset is a complex task, especially so in a complex system with multiple failure modes.
There are three main requirements of a condition-based maintenance system according to (Wiggelinkhuizen et al. Citation2008):
Detection of failure mechanism
Measurable criteria
Detection of time
These three steps have been interpreted in a variety of different ways, the creativity within the maintenance sector has resulted in a variety of different models. The following sections will look into Acoustic and SCADA models for the detection of failure mechanisms and how to use the measurable criterion.
5.1. Acoustic condition modelling
In the context of an offshore wind turbine, with mechanical, electrical and structural components. There have been various signals and monitoring tools to determine the structural health of the turbine.
The identification of dynamic system responses has been carried out qualitatively since the introduction of acoustic modelling (Tchakoua et al. Citation2014), recently with the emergence of condition monitoring, the maturation and cost reduction of digital computer hardware (Crabtree, Zappalá, and Tavner Citation2014). Condition monitoring is becoming more attractive and the offshore wind industry is becoming an emerging topic. Monitoring of rotating machinery is most competitive in terms of profitability and reliability (Qiao and Lu Citation2015a; Tavner Citation2012). The failure detection systems depend on pattern recognition related to displacement, velocity and acceleration time histories.
The sensors are commonly placed on the housing or shafts of the components during the operation. DNV-GL (GL Renewables Certification Citation2013) codes on condition monitoring state that the minimal amount of sensors of geared turbines shall include at least one vibrations sensor on the main bearing, two on the generator bearing and five for the gearbox sensor. Sensors are predominantly mounted on the housing of the component. The most common sensor used is a Piezo-electric accelerometer because of the large bandwidth, ranging from 0.1 to 30 Hz BSI 13373-1 (BSI Citation2002). Piezo-electrics sensors, unfortunately, suffer from roll-off at lower frequencies.
Raw vibration analysis is no arbitrary task. The data as a whole needs to be analysed in detail. Common methods are; time-domain analysis, for instance, Hilbert Transform. Statistical analysis, and frequency domain techniques, such as Fast-Fourier Transform or time-frequency domain techniques like the wavelet transform.
Fast-Fourier Transform has been the most applied technique in-order to obtain frequency spectrum by converting the time domain signals into the frequency domain. Specific harmonics are directly correlated to the gradation or faults of moving parts. Qiao and Lu (Citation2015b) have explored this for faults specific to wind turbines. Fast-Fourier transforms are effective in stationary signals but, may result in indistinct solutions in non-stationary environments. Offshore wind, and especially floating offshore wind the nacelle oscillates. The IEC-61400-25 (IEC Citation2011) has suggested binning vibration measurements over the power band of the operational wind turbine, or using log mean composition and applying synchrosqueezing transform (Geropp Citation1997; Sheng Citation2013).
Envelope analysis is used in signal processing to detect fault frequencies that may not be represented in the spectrum produced by Fast-Fourier Transform such as shock impulses (Sheng Citation2012). A Band-pass filter is applied to the time domain signals centreing on the desired energy region. The amplitude is demodulated in the filtered time-domain signal, extracting this repetition rate of impact. Applying this process during Fast-Fourier Transform characteristic impact frequencies and their modulations, side-bands, are determined.
Cepstrum involves taking the inverse Fourier transform of the logarithmic power spectrum. This methodology has been applied in auto-correction ANSIs, which is just performed on the logarithm of the power spectrum, In Cepstrum the correction is mainly focused on the lower harmonics (Geropp Citation1997).
For rotating machinery, fault detection is usually determined by distinguishing specific harmonics or side-bands. Envelope analysis is carried out to specifically locate side-bands using amplitude demodulation. Cepstrum analysis is carried out to distinguish between different harmonic groups (Spectra Quest Citation2006). The combination of this collection of techniques can lead to good failure detection. They can identify various forms of failures and are incorporated into commercially available solutions on vibrational analysis for offshore wind turbine condition monitoring. These tools often require experts to interpret the results to determine whether the information is indicative of a fault. Efforts have been put to fully automate fault detection with vibrational analysis using the features such as sideband energy, Koukoura, Carroll, and Mcdonald (Citation2017), deep learning convolution networks (Bach-Andersen, Rømer-Odgaard, and Winther Citation2018) or using a system that uses vibrations analysis combines with wind and rotor speeds (Ha et al. Citation2017). There is a need for a more generic approach of fault detection utilising machine learning methods, vibrational analysis with the minimal amount of human intervention as possible.
Offshore wind turbine condition monitoring is an emerging field with various tools emerging. Roller bearing failure detection using vibrational signals by extracting features with SVR modelling (Fernández-Francos et al. Citation2013). Also, another the same problem using ANN (Ziaja et al. Citation2016). Gearbox failures are of interest since it has one of the highest gown time, these failures have been diagnosed using Von-Kalman filters during operation and in non-stationary conditions (Feng, Qin, and Liang Citation2016) also including complex wavelet transformations (Teng, Ding, et al. Citation2016). Another approach has developed a tool using the angular velocity data (Nejad et al. Citation2014), investigating jerk’, using the rate of change of acceleration (Zhang, Verma, and Kusiak Citation2012).
CMS have been incorporated in several industries for years, Sky-wise (Airbus Citation2020) in the Aerospace or Pulse for the Nuclear industry. The Wind industry operators have only recently introduced dedicated CMS. The reason this development requires time is largely dependent on the initial cost being high (Yang, Court, and Jiang Citation2013), resulting in ambiguity on returns. The benefit of this investment will take years to impact the cost–benefit analysis. Another aspect is there probability of false alarms, hence, unnecessary cost from scheduled maintenance. As some insurance companies dictate that condition monitoring is mandatory the offshore wind industry will develop more effective mechanisms, according to a study carried out in 2014 by Yang et al. (Citation2014) only 60–80% accurate diagnosis is necessary to provide adequate returns to justify the implementation.
5.2. SCADA modelling
CMS based mostly on vibrational analysis can be costly, the appeal of SCADA bases systems for condition monitoring is largely due to the sensors already being installed to track the normal operations of the vessels. This subsection will discuss approaches implemented in the industry using SCADA data for failure detection and condition monitoring. There are six main approaches; trending, clustering, normal behaviour modelling (NBM), damage modelling, alarm assessment and performance monitoring. SCADA data typically records the meteorological data, component temperatures, control variables and electrical characteristics for horizontal offshore wind turbines. The exact configuration is dependant on the manufacture and operator but is most consistent with . The time-step from SCADA systems are typically 10minute averages of 1 Hz values. Some operators can offer maximum, minimums and standard deviations on each time-step. Some forms of valuable information are start, stop and alarm logs (Godwin and Matthews Citation2013), oil pressure levels coupled with filter status (Yang et al. Citation2014) and vibrations. There is no standardisation implemented in the wind industry or any industry. The general trend seems to be more sensors in modern offshore wind turbines for more data.
Table 1. Summary of references relating to the machine learning methods used in the specific types of monitoring and maintenance technique.
Data cleansing is a technique involving the transformation of raw data into an understandable format. For instance, the data, whether it is missing, inconsistent or noisy data especially in the offshore wind industry. This has a large influence on meaningful reliability assessment (Farrar and Worden Citation2007). Two common methods of addressing this issue; Fuzzy-set theory (Mokhtari et al. Citation2011). This aims to distinguish the gradual assessment of membership from elements using indicator functions. Dempster–Shafer theory (Ferdous et al. Citation2012) is a framework for reasoning with uncertainty applying understood connections. These theories can help mitigate the issue of vague data but do not remove the problem.
There is information that can be utilised from the offshore oil industry or the onshore wind industry that can be utilised in setting up meaningful databases, taking into consideration the different environmental conditions into account (Zhang et al. Citation2016). Another issue is the changing technologies of a fast developing industry so the richness of data or cost aspects needs to be tackled in each of the following models.
5.2.1. Trending
As soon as optimising maintenance strategies grew in the wind industry, so did structural health monitoring. One key area of interest in SCADA systems is temperature measurements. Thermal-dynamics of components can directly relate to the efficiency of the system. In the offshore wind, the gearbox has one of the highest down times causing this keen interest.
A study carried out from 2002 till 2007 (Wiggelinkhuizen et al. Citation2008), applies SCADA-based monitoring methodologies consisting of trending methods. Implementing regressions on scatter diagrams of temperature, power, as well as three-dimensional graphs including the ambient temperature. Manual interpretation of the filtered results was proven to be beneficial for determining anomalous behaviour. Yang, Court, and Jiang (Citation2013) have concluded that when the gearbox of a horizontal operational wind turbine efficiency decreases, the gearbox temperature will rise (compared to the ambient temperature), with an expected 6 months before failure. Wilkinson et al. (Citation2014) investigated condition monitoring methods. One of which was a trending method that compared the temperature difference of separate wind turbines on the same site tries to determine faults. The authors dismissed the efforts rendering the approach too inaccurate due to the environmental condition disparity between each wind turbine. It could be argued that this method is still valid but a more complex approach is necessary to irradiate the temporal nature of turbines. The binning method, where an average is taken, was applied to; the wind speed, generator speed and output power by Yang et al. (Citation2014). In this case, the trending methods were applied to historic data and current information to detect levels of damage, the added value is the differing scales of damage dictated by the damage mode and dependent parameter.
The trending method applied to SCADA parameters can observe the development of failure using past data comparing to the present information. There are several studies indicated here where the results are case dependant. Particularly in studies using temperature data which is case-specific and requiring manual interpretation. Attempts to visualise the information have not provided more insight. If trending methods are to be used for maintenance, the difficulties of interpretation and variance on individual offshore wind turbines will need to be addressed. If not, this will likely result in uncertainty and the possibility of false alarms.
5.2.2. Clustering
Visualising trends can be problematic, especially in a wind farm with turbines operating individually under dissimilar meteorological conditions. The evolution of trending was clustering SCADA data, where algorithms began to use classification methods to determine either ‘normal’, ‘faulty’ or ‘error’ observations.
One of the original implementations of clustering using ANN was carried out by Catmull (Citation2011), incorporating a self-organising map interpretation of SCADA information. The methods built clusters through the organisation of neurons on a regular grid for the training process such that the neighbouring neurons have similar inputs. To visualise the clustering information a unified distance matrix is used combined with projections of patterns. In this case, only normal operational signals are implemented for training. The fault detection operated by determining the distance between input data and the best-matched neuron, quantisation error, for abnormal behaviour detection. A similarly, a study by Kim et al. (Citation2011) included failures in the training of the algorithm and subsequently was able to determine individual failures.
Reviewing clustering methods highlights again that interpreting this information still requires human intervention. Also developing a tool that requires the faults to have been previously recorded is not always possible. The advantages from clustering are not dissimilar from trending hence more suitable methods are necessary.
5.2.3. Normal behaviour modelling
NBM encompasses the previous detection methods in normal operations of an offshore wind turbine but has incorporated a significant development where the tool aims to empirically model the desired parameter during the training phase. There are two main concepts; full signal reconstruction, where only the signals no other than the target are used to predict the desired target and Auto-Regressive with eXogenouos input modelling, this includes the target value but also incorporates previous values of the target to be used.
There is a magnitude of authors investigating the validity of artificial neural networks’ ability to monitor offshore wind turbines. G. Ciulla et al. (Citation2019) have investigated the power curve of a Senvion MM92 aero generator from a 2.05 MW wind turbine. They were able to produce results with deviations below 1% for the producibility and below 0.5% for the power curve.
Garcia, Sanz-Bobi, and del Pico (Citation2006) devised a predictive maintenance scheme called SIMAP using Auto-Regressive with eXogenouos artificial neural network. This involved gearbox bearing temperatures and oil coolant temperature. Measuring the difference from the coolant temperature before and after the model makes a prediction coupled with selected inputs. Using cross-correlations and the impulse response analysis the scheme can produce results with a confidence level of 95% for the upper and lower bounds. There is no information on the topology of the artificial neural network from this study.
Another approach using adaptive neuro-fuzzy logic by Aamer Bilal Asghar and Xiaodong Liu (2018) for online estimation of the wind speed from the tip speed ratio. This study is carried out with the NREL 5 MW offshore wind turbine. The wind speed and rotational speed of the rotor are used in the estimator, the neuro-fuzzy logic generates Boolean logic rules. For this example, only 216 rules were determined. This study was able to produce results with a testing error of around 6–7%.
A large number of studies have detailed how NBM is suitable for detecting failure. The concept of evaluating residual measured values minus modelling signals provides an easier interpretation of failure indicators than trending. The large dependency on vast amounts of data for the traning stage, coupled with the data pre-processing stage can produce undetected problems or false alarms. There has been a variety of different methodologies discussed but to determine the most effective a more comprehensive study is necessary to evaluate the best solution. Besides, there is no clear universal strategy or consensus on input and output parameters for NBM.
5.2.4. Damage modelling
Effective modelling can be carried out when an entire system can be observed at every detail, unlike NBM, where most of the modelling is considered ‘black box’. Damage modelling compares the desired signals with empirical models of normal operation. The interpretation of information involves physical models that can better represent the damage development and provide accurate results.
An electro-thermal analysis of a doubly-fed induction generator in a wind turbine using a geared transition conducted in Qiu et al. (Citation2015) used thermal-dynamic theory and combined it with temperature trending methods. The study made a few assumptions consisting of the rotor aerodynamics are steady-state and the drive-train is considered as rigid body dynamics. This case study used SCADA information of a 1.5 MW wind turbine with gear teeth failures, vibration faults and generator winding imbalances. The diagnostic rules determined faults for power transmission efficiency, generator winding and lubricant temperature.
Switching generators require cooling to sustain the operation. Borchersen and Kinnaert (Citation2016), devised a physics-based numerical model of the coil temperatures. The model was developed using Kalman filters of the actual system. The damage is determined using the values from the physical model on the three coils coupled with a cumulative sum algorithm. This study has used three years of historical data for 43 offshore wind turbines with an 88% fault detection success rate.
The comparison from measured signals and physical turbine damage models has shown success when applied to failure detection, significant challenges still exist with regards to the accuracy. Due to the lack of studies conducted on varying failure modes and from different turbines the full extent of this method of condition monitoring is not yet established.
5.2.5. Alarm assessment
Interpreting the information from complex failure detection strategies is one of the leading causes of discontinuity from development to delivering a condition monitoring system. There are a variety of tools constructed to provide better insight into the outputs of SCADA control alarms or Normal Behaviour Modelling. In general, alarms are usually broken into system operation, environmental and communication/software to indicate system malfunctions.
A fault diagnostic tool for a wind turbine developed by Yingning Qui and Yahuni Feng (Citation2020) used SCADA alarm material and is based on Dampster-Shafer theory. Dampster-Shafer theory is a multidimensional probability theory that takes each alarm as an item of evidence which supports different possible failures. The system verification was carried out using battery failures producing false-negatives and false-positive rates with an accuracy of 76%.
An analysis for detecting false alarms conducted by Pliego Marugán and García Márquez (Citation2019) uses artificial neural networks. There are three trained ANN in this approach, one of which deals with vibration information, the second deals with SCADA data and both of which are fed into a final model which also includes the alarm information. The system verification model involved a fuzzy logic-based methodology, where fuzzification was applied to each input and output variable and was critically analyses in a fuzzy data set. The final results of this tool ranged from 80% to 90% false alarm detection.
Evaluating alarm assessments for condition monitoring has shown benefits for fully autonomous fault detection systems. There is a severe lack of information regarding industrial algorithms for alarm assessment in offshore wind. The lack of clarity, highlighted was the large discrepancy in accuracy of outcomes, for the results status code consistency to increase these articles underline how necessary it is for more work in this area to reach full condition monitoring autonomy.
5.2.6. Performance monitoring
Monitoring the operations of an asset is essential to review the performance. Equally the performance of the turbine can be evaluated in terms of health, assessing the degradation in terms of health has opened up an opportunity to assess the performance in greater detail.
Addressing the performance of an operational wind turbine has been standardised in the IEC 61400-12 (Zhao et al. Citation2018), discretising the power curve into bins of 0.5 m/s wind speeds and calculating the mean power value for each bin. Applying this method does not consider the non-linear power to wind relationship (IEC 61400-12-2:2013, IEC Citation2013). There are a variety of probabilistic methods (Pedersen and Fossen Citation2012; Rogers et al. Citation2020; Saravanakumar and Jena Citation2013) and non-parametric (Pedersen and Fossen Citation2012) that encapsulate the power curve of a wind turbine. This aspect is crucial to effective power modelling.
A robust diagnosis of a wind turbine pitch failure conducted by Song et al. (Citation2018) uses power estimation to diagnose the fault. This method involves a pitch misalignment estimation using a statistically based fault scheme. This model incorporates the wind and wake model to determine the power curve, the fault detection is conducted using a model bases observer including a closed-loop. One of the main characteristics of this scheme is the performance improvement by building a bank of observers that lead to the decision to create consensus. This system can determine pitch errors at 0.1 deg at low wind speeds and 1 deg at high.
Another area that affects the output power is the yaw alignment, this is another area that has significant developments for performance monitoring. Sales-Setién and Peñarrocha-Alós (Citation2020) details two favourable yaw control systems. The China Ming Yang 1.5 W wind turbine is assessed in this case. Two yaw control systems are constructed using low pass filters. An Auto-Regressive Integrated Moving Average is used to predict future wind speed and direction. A Kalman filter is then used to determine the manoeuvre of yaw rotation. This method increased the performance by 15% however, the frequency of this SCADA data is every 10 s and would benefit with a higher frequency of results.
Performance monitoring is beneficial, increasing the efficiency of the operational wind turbine and assessing the condition of the turbine. Research has indicated that SCADA data are suitable for this task but a higher resolution is necessary for a more optimal tool. Again there is a limited amount of resources from the industrial sector and the standardisation is not implemented in most academic papers.
6. Discussion
There have been a variety of different machine learning methods’ main features discussed. The five popular methods strengths and limitations for; ANN, SVR, GPR, DBN and K-NN are compared:
Given the capabilities and limitations for the above models it is difficult to advise a specific type. They can all provide reasonable results for condition-based maintenance. Whether you are looking to understand the contributions towards the outcome or not would be a consideration among many. One main significant capability all models have is the ability to develop an individual prediction from historical data, something that cannot be carried out with conventional statistical methods or physical models. This comes with the cost of computational effort in comparison to statistical data fitting. Conversely, physical models can be too computationally expensive and hinder productivity but can provide more insight ().
Table 2. Summary of the benefits and limitations for the 5 individual regression machine learning methods.
The majority of discussion has strictly tackled the individual ML models applied to condition monitoring, but in more recent studies which include multi-agent systems, combinations of algorithms used to gain improved results, is gaining traction in the offshore wind industry. Yin and Zhao (Citation2019) effectively applied this technique using multiple ML methods gaining impressive results in predicting the thrust of the operational wind turbine.
Another interesting aspect is bringing combinations of condition monitoring methods. Multi-agent systems are ones that share features that are used to determine different objectives. M’hammed et al. (Citation2014) applied both clustering techniques measuring the vibrations of multiple components and an alarm assessment to determine the most effective maintenance strategy.
The challenges that arise from CMS of offshore wind turbine systems are discussed. Currently, vibration-based condition monitoring depends on advanced signal processing methods coupled with expert insight. With regard to SCADA-based condition monitoring, there are various techniques addressed. The principal methods in addition to novel ideas are gathered and presented as follows:
Trending methods have demonstrated an effective ability at detecting anomalies. The specific cases have highlighted those specific configurations and interpretations are necessary for different machines. Automated trend monitoring systems are unlikely to provide accurate and adequate alarms.
Clustering a more effective method than trending at determining the differentiation between normal operation and anomaly but still has similar limitations. This also requires historical failure information to develop an effective diagnostic tool and it is unlikely that the full extent of faults is determined.
Normal Behaviour Modelling is the main focus for SCADA data condition monitoring because of the simplicity of anomaly detection, by using the trained model modelled versus the measured variable. This article has detailed machine learning methods that can be used to determine failures effectively. But there is no clear comprehensive technique described as the best. From the variety of cases reviewed, it was difficult to determine with certainty if the fault detection technique is lacking or the method used to determine the behaviour. The specific type of configuration of the model also remains unclear to determine if specific issues like overfitting are present. There is also a lack of published standards to understand the performance of individual models to benchmark tools.
Damage Modelling is effective at specifically looking at the physical cause of failure for offshore wind turbines. This will be no easy feat since reliable and accurate damage models encompassing all failure modes are difficult. There is limited information on this with limited studies being published. Inferring different models for varying turbines for different environments cannot be examined yet.
Alarm Assessment combined with probabilistic methods and or physical rules has provided promise at reducing the frequency of alarms to more a critical catalogue of alarms. The studies have shown limited industrial developments that back this. Expert systems with fuzzy interference working together can interpret complex information and deliver easily understood information.
Performance Monitoring tools effectively determine the difference in power output from the environmental conditions, operations and health of the turbine. This tool is necessary to determine the performance of the offshore wind turbine, aid the optimisation of power extraction and maintenance.
7. Conclusion
This article has given a systematic review of how monitoring for maintenance can be carried out, detailing specific measures that can be taken for condition-based maintenance. This article has addressed the types of machine learning, providing a review of models suited to condition maintenance for offshore wind turbines. Bringing both of these components together is a trend across all industries, the offshore wind industry is catching up to the oil sector or aerospace. There are consistencies across all sectors; there are no design principles for implementing these tools and there is no consensus on the best-suited machine learning methodology.
Monitoring and maintenance carried out on an offshore wind turbine are implementing vibrational analysis, but limited studies are incorporating the vibrations analysis coupled with SCADA data to determine faults. This journal paper has discussed in detail how machine-learning can be used to detect faults with a variety of approaches. Another powerful tool of machine-learning is that specific faults can be categorised into alarms for immediate action to be taken.
Common issues when implementing data-driven approaches is the prepossessing of the data. Since there are no specific standards on how this is carried out, each individual producing a ML model may have dissimilar results when using the same architecture. This could be a result of many different approaches to anomaly detection, the variation in the opinion of experts, or the magnitude of dimensional reduction among some possibilities.
Lastly, current methods usually require experts to implement and understand the results of the monitoring systems. Exploring the automation of CMS could remove the complexity of the results decreasing the ambiguity on the condition of the asset.
Acknowledgements
This work is supported by the University of Strathclyde, Centre for Doctoral Training in Renewable Energy Marine Structure (REMS) http://www.rems-cdt.ac.uk/. Also from the United Kingdom Engineering and Physical Science Research Council (EPSRC).
Disclosure statement
No potential conflict of interest was reported by the authors.
Additional information
Funding
References
- Aggarwal, C. C., and P. S. Yu. 2001. “Outlier Detection for High Dimensional Data.” ACM SIGMOD Record 30: 37–46.
- Airbus. 2020. “Skywise Digital Solutions.” https://skywise.airbus.com/.
- Artigao, Estefania, Sergio Martín-Martínez, Andrés Honrubia-Escribano, and Emilio Gómez-Lázaro. 2018. “Wind Turbine Reliability: A Comprehensive Review Towards Effective Condition Monitoring Development.” Applied Energy 228: 1569–1583. ISSN 03062619, doi:https://doi.org/10.1016/j.apenergy.2018.07.037.
- Asghar, Aamer Bilal, and Xiaodong Liu. 2018. “School of Control Science and Engineering, Faculty of Electronic Information and Electrical Engineering”, Dalian University of Technology, Dalian 116024, P.R. China.
- Astolfi, D. 2019. “A Study of the Impact of Pitch Misalignment on Wind Turbine Performance.” Machines 7 (1): 8.
- Bach-Andersen, M., B. Rømer-Odgaard, and O. Winther. 2018. “Deep Learning for Automated Drive Train Fault Detection.” Wind Energy 21: 29–41. doi:https://doi.org/10.1002/we.2142.
- Bangalore, P., and L. B. Tjernberg. 2015. “An Artificial Neural Network Approach for Early Fault Detection of Gearbox Bearings.” IEEE Transactions on Smart Grid 6 (2): 980–987.
- Bi, R., C. Zhou, and D. M. Hepburn. 2017. “Detection and Classification of Faults in Pitchregulated Wind Turbine Generators Using Normal Behaviour Models Based on Performance Curves.” Renewable Energy 105: 674–688.
- Borchersen, A. B., and M. Kinnaert. 2016. “Model-based Fault Detection for Generator Cooling System in Wind Turbines Using SCADA Data.” Wind Energy 19 (4): 593–606. doi:https://doi.org/10.1002/we.1852 (cit. on pp. 28, 72).
- Bouzid, O. M., G. Y. Tian, K. Cumanan, and D. Moore. 2015. “Structural Health Monitoring of Wind Turbine Blades: Acoustic Source Localization Using Wireless Sensor Networks.” Journal of Sensors 2015: 139695.
- BSI (British Standards Institution). 2002. Condition Monitoring and Diagnostics of Machines—Thermography — Part 1: General Procedures. United Kingdom: British Standards Institution.
- Burman, J. P., and M. C. Otto. 1988. Census Bureau Research Project: Outliers in Time Series. Statistical Research Division Report. CENSUS/SRD/RR-88114. Bureau of the Census.
- Cao, M., Y. Qiu, Y. Feng, H. Wang, and D. Li. 2016. “Study of Wind Turbine Fault Diagnosis Based on Unscented Kalman Filter and SCADA Data.” Energies 9: 10.
- Catmull, S. 2011. “Self-Organising Map Based Condition Monitoring of Wind Turbines.” EWEA Annual Conference 2011.
- Ciulla, Giuseppina, Antonino D’Amico, V. Dio, and V. Lo Brano. 2019. “Modelling and Analysis of Real-World Wind Turbine Power Curves: Assessing Deviations from Nominal Curve by Neural Networks.” Renewable Energy 140: 477–492. doi:https://doi.org/10.1016/j.renene.2019.03.075
- Clark, C. E., and B. DuPont. 2018. “Reliability-based Design Optimization in Offshore Renewable Energy Systems.” Renewable and Sustainable Energy Reviews 97: 390–400.
- Crabtree, C. J., D. Zappalá, and P. J. Tavner. 2014. Survey of Commercially Available Condition Monitoring Systems for Wind Turbines. Technical Report. Durham University School of Engineering, Computing Sciences and the SUPERGEN Wind Energy Technologies Consortium. http://dro.dur.ac.uk/12497/ (cit. on pp. 7, 9).
- Cristianini, N., and J. Shawe-Taylor. 2000. An Introduction to Support Vector Regressions (and Other Kernel-Based Learning Methods). Cambridge: Cambridge University Press. 190 pp.
- de Moura, E. P., F. E. de Abreu Melo Junior, F. F. Rocha Damasceno, L. C. Campos Figueiredo, C. F. de Andrade, M. S. de Almeida, and P. Alexandre Costa Rocha. 2016. “Classification of Imbalance Levels in a Scaled Wind Turbine Through Detrended Fluctuation Analysis of Vibration Signals.” Renewable Energy 96: 993–1002.
- Dervilis, N., M. Choi, S. G. Taylor, R. J. Barthorpe, G. Park, C. R. Farrar, and K. Worden. 2014. “On Damage Diagnosis for a Wind Turbine Blade Using Pattern Recognition.” Journal of Sound and Vibration 333 (6): 1833–1850.
- Djeziri, M. A., S. Benmoussa, and R. Sanchez. 2018. “Hybrid Method for Remaining Useful Life Prediction in Wind Turbine Systems.” Renewable Energy 116: 173–187.
- Duda, R. O., P. E. Hart, and D. G. Stork. 2002. Pattern Classification. 2nd ed., 305–307. New York: John Wiley & Sons.
- Farrar, C. R., and K. Worden. 2007. “An Introduction to Structural Health Monitoring.” Philosophical Transactions of the Royal Society A: Mathematical Physical and Engineering Sciences 365: 303–315. doi:https://doi.org/10.1098/rsta.2006.1928
- Feng, Z., and M. Liang. 2014. “Fault Diagnosis of Wind Turbine Planetary Gearbox Under Nonstationary Conditions via Adaptive Optimal Kernel Time-Frequency Analysis.” Renewable Energy 66: 468–477.
- Feng, Zhipeng, Sifeng Qin, and Ming Liang. 2016. “Time–Frequency Analysis Based on VoldKalman Filter and Higher Order Energy Separation for Fault Diagnosis of Wind Turbine Planetary Gearbox Under Nonstationary Conditions.” Renewable Energy 85: 45–56. ISSN 0960-1481, doi:https://doi.org/10.1016/j.renene.2015.06.041 (http://www.sciencedirect.com/science/article/pii/S0960148115300641).
- Ferdous, R., F. Khan, R. Sadiq, P. Amyotte, and B. Veitch. 2012. “Handling and Updating Uncertain Information in Bow-Tie Analysis.” Journal of Loss Prevention in the Process Industries 25: 8–19.
- Fernandez-Canti, R. M., J. Blesa, S. Tornil-Sin, and V. Puig. 2015. “Fault Detection and Isolation for a Wind Turbine Benchmark Using a Mixed Bayesian/Set-Membership Approach.” Annual Reviews in Control 40: 59–69.
- Fernández-Francos, D., D. Martínez-Rego, O. Fontenta-Romero, and A. Alonso-Betanzos. 2013. “Automatic Bearing Fault Diagnosis Based on one-Class ν-SVM.” Computers & Industrial Engineering 64 (1): 357–365.
- Fox, A. J. 1972. “Outliers in Time Series.” Journal of the Royal Statistical Society. Series B Methodological 34 (3): 350–363.
- Garcia, M. C., M. A. Sanz-Bobi, and J. del Pico. 2006. “SIMAP: Intelligent System for Predictive Maintenance Application to the Health Condition Monitoring of a Wind Turbine Gearbox.” Computers in Industry 57 (6): 552–568.
- Geropp, B. 1997. “Envelope Analysis - A Signal Analysis Technique for Early Detection and Isolation of Machine Faults.” IFAC Proceedings Volumes 30 (18): 977–981. doi:https://doi.org/10.1016/S1474-6670(17)42527-4 (cit. on p. 9).
- Gholami, Raoof, and Nikoo Fakhari. 2017. “Chapter 27 – Support Vector Machine: Principles, Parameters, and Applications.” In Handbook of Neural Computation, edited by Pijush Samui, Sanjiban Sekhar, and Valentina E. Balas, 515–535. Academic Press. ISBN 9780128113189.
- GL Renewables Certification. 2013. “Rules and Guidelines, IV: Industrial Services; 4: Guideline for the Certification of Condition Monitoring Systems for Wind Turbines” (cit. on pp. 7, 146)
- Godwin, J. L., and P. Matthews. 2013. “Classification and Detection of Wind Turbine PitchFaults Through SCADA Data Analysis.” International Journal of Prognostics and HealthManagement 4: 1–11. (cit. on pp. 11, 29).
- Gonzalez, E., M. Reder, and J. J. Melero. 2016. “SCADA Alarms Processing for Wind Turbine Component Failure Detection.” Journal of Physics: Conference Series 753 (7): 072019.
- Ha, J. M., H. Oh, J. Park, and B. D. Youn. 2017. “Classification of Operating Conditions of Wind Turbines for a Class-Wise Condition Monitoring Strategy.” Renewable Energy 103: 594–605. doi:https://doi.org/10.1016/j.renene.2016.10.071 (cit. on p. 10).
- Hackell, M. W., R. Rolfes, M. B. Kane, and J. P. Lynch. 2016. “Three-Tier Modular Structural Health Monitoring Framework Using Environmental and Operational Condition Clustering for Data Normalization: Validation on an Operational Wind Turbine System.” Proceedings of the IEEE 104 (8): 1632–1646.
- Hang, J., J. Zhang, and M. Cheng. 2016. “Application of Multi-Class Fuzzy Support Vector Machine Classifier for Fault Diagnosis of Wind Turbine.” Fuzzy Sets and Systems 297: 128–140.
- Hartikainen, J., and S. Särkkä. 2010. “Kalman Filtering and Smoothing Solutions to Temporal Gaussian Process Regression Models.” 2010 IEEE International Workshop on Machine Learning for Signal Processing, Kittila, pp. 379–384. doi:https://doi.org/10.1109/MLSP.2010.5589113
- Hebb, D. 1949. The Organization Behavior. New York: Wiley.
- Heinermann, J., and O. Kramer. 2016. “Machine Learning Ensembles for Wind Power Prediction.” Renewable Energy 89: 671–679.
- Herp, J., N. L. Pedersen, and E. S. Nadimi. 2016. “Wind Turbine Performance Analysis Based on Multivariate Higher Order Moments and Bayesian Classifiers.” Control Engineering Practice 49: 204–211.
- IEC (International Electrotechnical Commission). 2011. Wind Turbines – Communications for Monitoring and Control of Wind Power Plants – Logical Node Classes and Data Classes for Condition Monitoring. IEC 61400-25-6:2011. International Electrotechnical Commission (cit. on pp. 9, 146).
- IEC (International Electrotechnical Commission). 2013. Wind Turbines Part 12-2: Power Performance of Electricity Producing Wind Turbines Based on Nacelle Anemometry. IEC 61400-12-2:2013. International Electrotechnical Commission (cit. on pp. 32, 39, 44, 46, 48, 49, 74).
- Ioannou, Anastasia, Andrew Angus, and Feargal Brennan. 2017. “Risk-based Methods for Sustainable Energy System Planning: A Review.” Renewable and Sustainable Energy Reviews 74: 602–615. ISSN 1364-0321. doi:https://doi.org/10.1016/j.rser.2017.02.082. (http://www.sciencedirect.com/science/article/pii/S136403211730312X).
- Jlassi, I., J. O. Estima, S. Khojet El Khil, N. Mrabet Bellaaj, and A. J. Marques Cardoso. 2015. “Multiple Open-Circuit Faults Diagnosis in Back-to-Back Converters of PMSG Drives for Wind Turbine Systems.” IEEE Transactions on Power Electronics 30 (5): 2689–2702.
- Joshuva, A., and V. Sugumaran. 2017. “A Data Driven Approach for Condition Monitoring of Wind Turbine Blade Using Vibration Signals Through Best-First Tree Algorithm and Functional Trees Algorithm: A Comparative Study.” ISA Transactions 67: 160–172.
- Kambeitz, Joseph, Carlos Cabral, Matthew D. Sacchet, Ian H. Gotlib, Roland Zahn, Mauricio H. Serpa, Martin Walter, Peter Falkai, and Nikolaos Koutsouleris. 2017. “Detecting Neuroimaging Biomarkers for Depression: a Meta-Analysis of Multivariate Pattern Recognition Studies.” Biological Psychiatry 82 (5): 330–338. doi:https://doi.org/10.1016/j.biopsych.2016.10.028
- Kambeitz, Joseph, Lana Kambeitz-Ilankovic, Stefan Leucht, Stephen Wood, Christos Davatzikos, Berend Malchow, Peter Falkai, and Nikolaos Koutsouleris. 2015. “Detecting Neuroimaging Biomarkers for Schizophrenia: a Metaanalysis of Multi-Variate Pattern Recognition Studies.” Neuropsychopharmacology 40 (7): 1742–1751. doi:https://doi.org/10.1038/npp.2015.22
- Kang, J., X. Zhang, and T. Jin. 2015. “Tracking Gearbox Degradation based on Stable Distribution Parameters: A Case Study.” 2015 IEEE Conference on Prognostics and Health Management: Enhancing Safety, Efficiency, Availability, and Effectiveness of Systems Through PHAf Technology and Application, PHM.
- Kantz, H., and T. Schreiber. 2004. Nonlinear Time Series Analysis, Schreiber. 2nd ed. Cambridge: Cambridge University Press.
- Kim, K., G. Parthasarathy, O. Uluyol, W. Foslien, S. Sheng, and P. Fleming. 2011. “Use of SCADA Data for Failure Detection in Wind Turbines.” ASME 5th International Conference on Energy Sustainability.
- Koukoura, S., J. Carroll, and A. Mcdonald. 2017. “Wind Turbine Intelligent Gear Fault Identification.” Annual Conference of the PHM Society, St. Petersburg, USA, pp. 1–7 (cit. on p. 10).
- Koutsouleris, N., E. M. Meisenzahl, S. Borgwardt, A. Riecher-Rössler, T. Frodl, J. Kambeitz, et al. 2015. “Individualized Differential Diagnosis of Schizophrenia and Mood Disorders Using Neuroanatomical Biomarkers.” Brain 138 (7): 2059–2073.
- Leahy, K., R. L. Hu, I. C. Konstantakopoulos, C. J. Spanos, and A. M. Agogino. 2016. “Diagnosing Wind Turbine Faults Using Machine Learning Techniques Applied to Operational Data.” 2016 IEEE International Conference on Prognostics and Health Management, ICPHM 2016.
- Lee, S., and S. Lee. 2014. “Numerical and Experimental Study of Aerodynamic Noise by a Small Wind Turbine.” Renewable Energy 65: 108–112.
- Li, Y., S. Liu, and L. Shu. 2019. “Wind Turbine Fault Diagnosis Based on Gaussian Process Classifiers Applied to Operational Data.” Renewable Energy 134: 357–366.
- Liu, X., M. Li, S. Qin, X. Ma, and W. Wang. 2016. “A Predictive Fault Diagnose Method of Wind Turbine Based on K-Means Clustering and Neural Networks.” Journal of Internet Technology 17 (7): 1521–1528.
- Martinez-Luengo, M., A. Kolios, and L. Wang. 2016. “Structural Health Monitoring of Offshore Wind Turbines: A Review Through the Statistical Pattern Recognition Paradigm.” Renewable and Sustainable Energy Reviews 64: 91–105. https://www.sciencedirect.com/science/article/pii/S1364032116301976.
- Martinez-Ramon, M., and C. Cristodoulou. 2006. Support Vector Regressions for Antenna Array Processing and Electromagnetic. Watson Research Center Yorktown: Morgan & Claypool.
- Mazidi, P., M. Du, L. Bertling Tjernberg, and M. A. S. Bobi. 2016. “A Performance and Maintenance Evaluation Framework for Wind Turbines.” 2016 International Conference on Probabilistic Methods Applied to Power Systems.
- McCulloch, W. S., and W. Pitts. 1943. “A Logical Calculus of the Ideas Immanent in Nervous Activity.” Bulletin of Mathematical Biophysics 5: 115–133.
- Mercer, J. 1909. “Functions of Positive and Negative Type and Their Connection with the Theory of Integral Equations.” Philosophical Transactions of the Royal Society London A 209: 415–446.
- M’hammed, Sahnoun, P. Godsiff, Baudry David, Louis Anne, and B. Mazari. 2014. “Modelling of Maintenance Strategy of Offshore Wind Farms based Multi-Agent System.” CIE 2014 – 44th International Conference on Computers and Industrial Engineering and IMSS 2014 - 9th International Symposium on Intelligent Manufacturing and Service Systems, Joint International Symposium on “The Social Impacts of Developments in Informat”, 2406–2420.
- Mitchell, T. M. 1997. Machine Learning. Burr ridge, IL: McGraw Hill. 45(37), 870–877.
- Mohamed, A. A. 2020. “An Effective Dimension Reduction Algorithm for Clustering Arabic Text.” Egyptian Informatics Journal 21 (1): 1–5. ISSN 1110-8665. doi:https://doi.org/10.1016/j.eij.2019.05.002
- Mokhtari, K., J. Ren, C. Roberts, and J. Wang. 2011. “Application of a Generic Bow-tie Based Risk Analysis Framework on Risk Management of Sea Ports and Offshore Terminals.” Journal of Hazardous Materials 192: 465–475.
- Möller, T., D. Langenkämper, and T. Nattkemper. 2019. “Wind Turbine Segmentation Performing KNN-Clustering on Superpixel Segmentations.” Proceedings of SPIE – The International Society for Optical Engineering.
- Nejad, A. R., P. F. Odgaard, Z. Gao, and T. Moan. 2014. “A Prognostic Method for Fault Detection in Wind Turbine Drivetrains.” Engineering Failure Analysis 42: 324–336.
- Neu, E., F. Janser, A. A. Khatibi, and A. C. Orifici. 2017. “Fully Automated Operational Modal Analysis Using Multi-Stage Clustering.” Mechanical Systems and Signal Processing 84: 308–323.
- O’Hagan, A. 1978. “Curve Fitting and Optimal Design for Prediction.” Journal of the Royal Statistical Society Series B (Methodological) 40 (1): 1–42.
- Parker, D. B. 1982. Learning–Logic. Invention Report S81-64, File 1, Office of Technology Licensing. Stanford, CA.: Stanford University.
- Pearl, J. 1988. Probabilistic Reasoning in Intelligent Systems. San Mateo, CA: Morgan Kaufmann.
- Pedersen, Morten D., and Thor I. Fossen. 2012. “Efficient Nonlinear Wind-Turbine Modeling For Control Applications.” IFAC Proceedings Volumes 45 (2): 264–269. ISSN 1474-6670. ISBN 9783902823236. doi:https://doi.org/10.3182/20120215-3-AT3016.00046
- Pi, Chen-Huan, Kai-Chun Hu, Stone Cheng, and I-Chen Wu. 2020. “Low-level Autonomous Control and Tracking of Quadrotor Using Reinforcement Learning.” Control Engineering Practice 95: 104222. ISSN 0967-0661. doi:https://doi.org/10.1016/j.conengprac.2019.104222
- Pliego Marugán, A., and F. P. García Márquez. 2019. “Advanced Analytics for Detection and Diagnosis of False Alarms and Faults: A Real Case Study.” Wind Energy 22: 1622–1635. doi:https://doi.org/10.1002/we.2393
- Qiao, W., and D. Lu. 2015a. “A Survey on Wind Turbine Condition Monitoring and Fault Diagnosis – Part II: Signals and Signal Processing Methods.” IEEE Transactions on Industrial Electronics 62 (10): 6546–6557. doi:https://doi.org/10.1109/TIE.2015.2422394 (cit. on p. 7).
- Qiao, W., and D. Lu. 2015b. “A Survey on Wind Turbine Condition Monitoring and Fault Diagnosis – Part I: Components and Subsystems.” IEEE Transactions on Industrial Electronics 62 (10): 6536–6545. doi:https://doi.org/10.1109/TIE.2015.2422112 (cit. on pp. 7, 9).
- Qiu, Yingning, and Yanhui Feng. 2020. “David Infield, Fault Diagnosis of Wind Turbine with SCADA Alarms Based Multidimensional Information Processing Method.” Renewable Energy 145: 1923–1931. ISSN 0960-1481. doi:https://doi.org/10.1016/j.renene.2019.07.110
- Qiu, Y., W. Zhang, M. Cao, Y. Feng, and D. Infield. 2015. “An Electro-Thermal Analysis of a Variable-Speed Doubly-Fed Induction Generator in a Wind Turbine.” Energies 8 (5): 3386–3402.
- Rao, V., and H. Rao. 1998. C++ Neural Network and Fuzzy Logic. 2nd ed. New Delhi: BPB.
- Rasmussen, C. E., and C. K. I. Williams. 2006. Gaussian Processes for Machine Learning. MIT Press. ISBN 026218253X.
- Regan, T., C. Beale, and M. Inalpolat. 2017. “Wind Turbine Blade Damage Detection Using Supervised Machine Learning Algorithms”, Journal of Vibration and Acoustics.” Transactions of the ASME 139 (6): 061010.
- Regan, T., R. Canturk, E. Slavkovsky, C. Niezrecki, and M. Inalpolat. 2016. “Wind Turbine Blade Damage Detection using Various Machine Learning Algorithms.” Proceedings of the ASME Design Engineering Technical Conference.
- Rocher, B., F. Schoefs, M. Fraņcois, and A. Salou. 2014. “Bayesian Updating of Probabilistic Time-Dependent Fatigue Model: Application to Jacket Foundations of Wind Turbines.” 7th European Workshop on Structural Health Monitoring, EWSHM 2014 – 2nd European Conference of the Prognostics and Health Management (PHM) Society, pp. 1264.
- Röckmann, Christine, Sander. Lagerveld, and John Stavenuiter Stavenuiter. 2017. “Operation and Maintenance Costs of Offshore Wind Farms and Potential Multi-use Platforms in the Dutch North Sea.” In Aquaculture Perspective of Multi-Use Sites in the Open Ocean, 97–113. Springer.
- Rogers, T. J., P. Gardner, N. Dervilis, K. Worden, A. E. Maguire, E. Papatheou, and E. J. Cross. 2020. “Probabilistic Modelling of Wind Turbine Power Curves with Application of Heteroscedastic Gaussian Process Regression.” Renewable Energy 148: 1124–1136. ISSN 0960-1481. doi:https://doi.org/10.1016/j.renene.2019.09.145.
- Rumelhart, D. E., G. E. Hinton, and R. J. Williams. 1986. “Learning Internal Representations by Error Propagation.” In Parallel Distributed Processing. 8th ed., edited by D. E. Rumelhart and J. L. McClelland, 45–76. Cambridge: MIT Press.
- Saidi, L., J. Ben Ali, M. Benbouzid, and E. Bechhofer. 2018. “An Integrated Wind Turbine Failures Prognostic Approach Implementing Kalman Smoother with Confidence Bounds.” Applied Acoustics 138: 199–208.
- Sales-Setién, Ester, and Ignacio Peñarrocha-Alós. 2020. “Robust Estimation and Diagnosis of Wind Turbine Pitch Misalignments at a Wind Farm Level.” Renewable Energy 146: 1746–1765. ISSN 0960-1481. doi:https://doi.org/10.1016/j.renene.2019.07.133
- Saravanakumar, R., and D. Jena. 2013. “Nonlinear Estimation and Control of Wind Turbine.” 2013 IEEE International Conference on Electronics, Computing and Communication Technologies, Bangalore, 1–6. doi:https://doi.org/10.1109/CONECCT.2013.6469307
- Sarrafi, A., Z. Mao, C. Niezrecki, and P. Poozesh. 2018. “Vibration-based Damage Detection in Wind Turbine Blades Using Phase-Based Motion Estimation and Motion Magnification.” Journal of Sound and Vibration 421: 300–318.
- Scheu, Matti Niclas, Lorena Tremps, Ursula Smolka, Athanasios Kolios, and Feargal Brennan. 2019. “A Systematic Failure Mode Effects and Criticality Analysis for Offshore Wind Turbine Systems Towards Integrated Condition Based Maintenance Strategies.” Ocean Engineering 176: 118–133. doi:https://doi.org/10.1016/j.oceaneng.2019.02.048
- Schlechtingen, Meik, Ilmar Ferreira Santos, and Sofiane Achiche. 2013. “Wind Turbine Condition Monitoring Based on SCADA Data Using Normal Behavior Models. Part 1: System Description.” Applied Soft Computing 13 (1): 259–270. ISSN 1568-4946. doi:https://doi.org/10.1016/j.asoc.2012.08.033
- Schnack, Hugo G., Mireille Nieuwenhuis, Neeltje E. M. van Haren, Lucija Abramovic, Thomas W. Scheewe, Rachel M. Brouwer, Hilleke E. Hulshoff Pol, and René S. Kahn. 2014. “Can Structural MRI Aid in Clinical Classification? A Machine Learning Study in two Independent Samples of Patients with Schizophrenia, Bipolar Disorder and Healthy Subjects.” Neuroimage 84: 299–306.
- Shafiee, M. 2015. “A Fuzzy Analytic Network Process Model to Mitigate the Risks Associated with Offshore Wind Farms.” Expert Systems with Applications 42 (4): 2143–2152.
- Shao, Weiming, Zhiqiang Ge, and Zhihuan Song. 2019. “Quality Variable Prediction for Chemical Processes Based on Semisupervised Dirichlet Process Mixture of Gaussians.” Chemical Engineering Science 193: 394–410. ISSN 0009-2509. doi:https://doi.org/10.1016/j.ces.2018.09.031
- Sheng, S.2012. Wind Turbine Gearbox Condition Monitoring Round Robin Study - Vibration Analysis. Technical Report. Golden, CO: National Renewable Energy Laboratory. doi:https://doi.org/10.2172/1048981 (cit. on pp. 9, 10, 143).
- Sheng, S.2013. Report on Wind Turbine Subsystem Reliability – A Survey of Various Databases. Technical Report. NREL/PR-5000-59111. National Renewable Energy Laboratory. https://www.nrel.gov/docs/fy13osti/59111.pdf.
- Simani, S. 2015. “Overview of Modelling and Advanced Control Strategies for Wind Turbine Systems.” Energies 8 (12): 13395–13418.
- Skrimpas, G. A., C. W. Sweeney, K. S. Marhadi, B. B. Jensen, N. Mijatovic, and J. Holbøll. 2015. “Employment of Kernel Methods on Wind Turbine Power Performance Assessment.” IEEE Transactions on Sustainable Energy 6 (3): 698–706.
- Smola, A. J., and B. Schölkopf. 2004. “A Tutorial on Support Vector Regression.” Statistics and Computing 14: 199–222.
- Song, Dongran, Jian Yang, Xinyu Fan, Yao Liu, Anfeng Liu, Guo Chen, and Young Hoon Joo. 2018. “Maximum Power Extraction for Wind Turbines Through a Novel Yaw Control Solution Using Predicted Wind Directions.” Energy Conversion and Management 157: 587–599. ISSN 0196-8904. doi:https://doi.org/10.1016/j.enconman.2017.12.019
- Spectra Quest. 2006. Rotating Machinery Faulty Diagnosis Techniques – Envelope and Cep-Strum Analyses, 1–11. Technical Report. Richmond, VA: Spectra Quest, Inc.
- Sutton, R. S., and A. G. Barto. 1998. Barto Introduction to Reinforcement Learning, vol. 135. Cambridge: MIT Press.
- Tabib, Mandar, M. Salman Siddiqui, Adil Rasheed, and Trond Kvamsdal. 2017. “Industrial Scale Turbine and Associated Wake Development -Comparison of RANS Based Actuator Line Vs Sliding Mesh Interface Vs Multiple Reference Frame Method.” Energy Procedia 137: 487–496. ISSN 1876-6102. doi:https://doi.org/10.1016/j.egypro.2017.10.377
- Tavner, P. J. 2012. Offshore Wind Turbines: Reliability, Availability and Maintenance. London: Institution of Engineering and Technology. p. 296. doi:https://doi.org/10.1049/PBRN013E (cit. on p. 1).
- Tchakoua, P., R. Wamkeue, M. Ouhrouche, F. Slaoui-Hasnaoui, T. A. Tameghe, and G. Ekemb. 2014. “Wind Turbine Condition Monitoring: State-of-the-Art Review, New Trends, and Future Challenges.” Energies 7 (4): 2595–2630.
- Teng, W., X. Ding, X. Zhang, Y. Liu, and Z. Ma. 2016. “Multi-fault Detection and Failure Analysis of Wind Turbine Gearbox Using Complex Wavelet Transform.” Renewable Energy 93: 591–598.
- Teng, W., X. Wang, C. Dang, and W. Shi. 2016. “Dynamic Equvalent Model of the Wind Farm Based on the K Nearest Neighbor.” Asia-Pacific Power and Energy Engineering Conference.
- Tolba, Hanany, Nouha Dkhili, Julien Nou, Julien Eynard, Stéphane Thil, and Stéphane Grieu. 2019. “GHI Forecasting Using Gaussian Process Regression: Kernel Study.” IFAC-PapersOnLine 52 (4): 455–460. ISSN 2405-8963.
- Vapnik, V. 1998. Statistical Learning Theory, 1998. New York: Wiley. 768 pp.
- Voyant, Cyril, Gilles Notton, Soteris Kalogirou, Marie-Laure Nivet, Christophe Paoli, Fabrice Motte, and Alexis Fouilloy. 2017. “Machine Learning Methods for Solar Radiation Forecasting: A Review.” Renewable Energy 105: 569–582. doi:https://doi.org/10.1016/j.renene.2016.12.095
- Wan, Hua-Ping, and Yi-Qing Ni. 2018. Bayesian Multi-Task Learning Methodology for Reconstruction of Structural Health Monitoring Data. Hong Kong: Sage.
- Wang, L. 2005. Support Vector Regressions: Theory and Applications. Berlin: Springer. 430 pp.
- Wang, Y., D. G. Infield, B. Stephen, and S. J. Galloway. 2014. “Copula-based Model for Wind Turbine Power Curve Outlier Rejection.” Wind Energy 17 (11): 1677–1688.
- Wang, Zihao, Hongwei Lin, Xiaofeng Yu, and Yusuf Fatihu Hamza. 2019. “A Dimensional Reduction Guiding Deep Learning Architecture for 3D Shape Retrieval.” Computers & Graphics 81: 82–91. ISSN 0097-8493. doi:https://doi.org/10.1016/j.cag.2019.04.002
- Wang, Y., Y. Liu, L. Li, D. Infield, and S. Han. 2018. “Short-term Wind Power Forecasting Based on Clustering pre-Calculated CFD Method.” Energies 11 (4): 854.
- Wang, Q., G. Michau, and O. Fink. 2019. “Domain Adaptive Transfer Learning for Fault Diagnosis.” 2019 Prognostics and System Health Management Conference (PHM-Paris), Paris, France, 279–285.
- Wang, H., H. Wang, G. Jiang, J. Li, and Y. Wang. 2019. “Early Fault Detection of Wind Turbines Based on Operational Condition Clustering and Optimized Deep Belief Network Modeling.” Energies 12 (6): 984.
- Werbos, P. J. 1974. “Beyond Regression: New Tools for Prediction and Analysis in the Behavioral Sciences.” Master thesis, Harvard University.
- Werner, T., O. Bichler, E. Vianello, and B. Yvert. 2019. “Commissariat al Energie Atomique et aux Energies Alternatives and Institut National de la Sante et de la Recherche Medicale INSERM”, Modulation device and method, artificial synapse comprising said modulation device, short term plasticity method in an artificial neural network comprising said artificial synapse. US Patent Application 16/465,854.
- Wiggelinkhuizen, E., T. Verbruggen, H. Braam, L. Rademakers, J. Xiang, and S. J. Watson. 2008. “Assessment of Condition Monitoring Techniques for Offshore Wind Farms.” Journal of Solar Energy Engineering 130 (3): 031004. doi:https://doi.org/10.1115/1.2931512 (cit. on pp. 7, 13).
- Wilkinson, M., K. Harman, T. van Delft, and B. Darnell. 2014. “Comparison of Methods for Wind Turbine Condition Monitoring with SCADA Data.” IET Renewable Power Generation 8 (4): 390–397.
- WindEurope. 2019. “Wind energy in Europe: Outlook to 2023.” [online] https://windeurope.org.
- Yang, W., R. Court, and J. Jiang. 2013. “Wind Turbine Condition Monitoring by the Approach of SCADA Data Analysis.” Renewable Energy 53: 365–376.
- Yang, H.-H., M.-L. Huang, and S.-W. Yang. 2015. “Integrating Auto-Associative Neural Networks with Hotelling T2 Control Charts for Wind Turbine Fault Detection.” Energies 8 (10): 12100–12115.
- Yang, C., J. Liu, Y. Zeng, and G. Xie. 2019. “Real-time Condition Monitoring and Fault Detection of Components Based on Machine-Learning Reconstruction Model.” Renewable Energy 133: 433–441.
- Yang, W., P. J. Tavner, C. J. Crabtree, Y. Feng, and Y. Qiu. 2014. “Wind Turbine Condition Monitoring: Technical and Commercial Challenges.” Wind Energy 17 (5): 673–693.
- Yin, Xiuxing, and Xiaowei Zhao. 2019. “Big Data Driven Multi-Objective Predictions for Offshore Wind Farm Based on Machine Learning Algorithms.” Energy 186: 115704. ISSN 0360-5442. doi:https://doi.org/10.1016/j.energy.2019.07.034
- Yu, R., J. Gao, M. Yu, W. Lu, T. Xu, M. Zhao, J. Zhang, R. Zhang, and Z. Zhang. 2019. “LSTM-EFG for Wind Power Forecasting Based on Sequential Correlation Features.” Future Generation Computer Systems 93: 33–42.
- Zemene, F., and V. Khedkar. 2017. “Survey on Machine Learning Based Electric Consumption Forecasting Using Smart Meter Data.” International Journal of Computer Applications, 180 (6): 46–52.
- Zhang, X., L. Sun, H. Sun, Q. Guo, and X. Bai. 2016. “Floating Offshore Wind Turbine Reliability Analysis Based on System Grading and Dynamic FTA.” Journal of Wind Engineering and Industrial Aerodynamics 154: 21–33.
- Zhang, Z., A. Verma, and A. Kusiak. 2012. “Fault Analysis and Condition Monitoring of the Wind Turbine Gearbox.” IEEE Transactions on Energy Conversion 27 (2): 526–535.
- Zhao, H., Y. Gao, H. Liu, and L. Li. 2019. “Fault Diagnosis of Wind Turbine Bearing Based on Stochastic Subspace Identification and Multi-Kernel Support Vector Machine.” Journal of Modern Power Systems and Clean Energy 7 (2): 350–356.
- Zhao, H., H. Liu, W. Hu, and X. Yan. 2018. “Anomaly Detection and Fault Analysis of Wind Turbine Components Based on Deep Learning Network.” Renewable Energy 127: 825–834.
- Zhou, P., and P. T. Yin. 2019. “An Opportunistic Condition-Based Maintenance Strategy for Offshore Wind Farm Based on Predictive Analytics.” Renewable and Sustainable Energy Reviews 109: 1–9. ISSN 1364-0321. doi:https://doi.org/10.1016/j.rser.2019.03.049
- Zhu, W. J., W. Z. Shen, E. Barlas, F. Bertagnolio, and J. N. Sørensen. 2018. “Wind Turbine Noise Generation and Propagation Modeling at DTU Wind Energy: A Review.” Renewable and Sustainable Energy Reviews 88: 133–150.
- Zhu, Erzhou, Yuanxiang Zhang, Peng Wen, and Feng Liu. 2019. “Fast and Stable Clustering Analysis Based on Grid-Mapping K-Means Algorithm and new Clustering Validity Index.” Neurocomputing 363: 149–170. ISSN 0925-2312. doi:https://doi.org/10.1016/j.neucom.2019.07.048
- Ziaja, A., I. Antoniadou, T. Barszcz, W. J. Staszewski, and K. Worden. 2016. “Fault Detection in Rolling Element Bearings Using Wavelet-Based Variance Analysis and Novelty Detection.” Journal of Vibration and Control 22 (2): 396–411. doi:https://doi.org/10.1177/1077546314532859 (cit. on p. 10).
- Ziegler, L., N. Cosack, A. Kolios, and M. Muskulus. 2019. “Structural Monitoring for Lifetime Extension of Offshore Wind Monopiles: Verification of Strain-Based Load Extrapolation Algorithm.” Marine Structures 66: 154–163.