
 ?Mathematical formulae have been encoded as MathML and are displayed in this HTML version using MathJax in order to improve their display. Uncheck the box to turn MathJax off. This feature requires Javascript. Click on a formula to zoom.
ABSTRACT
In this study, it was aimed to determine the regional priorities of renewable energy sources in Turkey. Unlike the literature, renewable energy sources were selected on a regional basis. While criteria weights were obtained by the AHP method, the alternative ranking was found for each region by the MARCOS method. While investment cost was determined as the most important criterion, it was determined as a result of the application of the MARCOS method that the energy sources that should be preferred firstly were hydro energy sources in Eastern Anatolia, Mediterranean, Southeastern Anatolia and Black Sea Region, wind energy sources in Marmara and Aegean Region, and solar energy sources in Central Anatolia Region.
1. Introduction
Turkey's electricity consumption increased by 2.2% and amounted to 304.2 billion kWh in 2018 compared to the previous year. In 2018, 67.1% of our electricity generation was obtained from fossil sources (coal, natural gas) (ETBKa Citation2020). Fossil sources such as coal, oil and natural gas are known to have an inevitable place in human life. Fossil resources with limited volume, the consumption of which is increasing with each passing day, damage the environment. Furthermore, Turkey's oil and natural gas resources are insufficient, and therefore, it is dependent on foreign energy. Due to all these reasons and increasing energy needs, the use of renewable energy sources has become compulsory in terms of environmental and energy supply security (Kabak and Dağdeviren Citation2014), which provides a significant advantage in terms of both national security and energy independence. On the other hand, Turkey has various renewable energy sources such as hydro, solar, wind, biomass and geothermal energy. These renewable energy sources are the key factors that could be the solution to the growing energy problem for Turkey. Turkey has aimed to increase the share of renewable energy sources in the national energy composition based on its goals of reducing dependence on foreign energy, maximising the use of local resources and combating climate change.
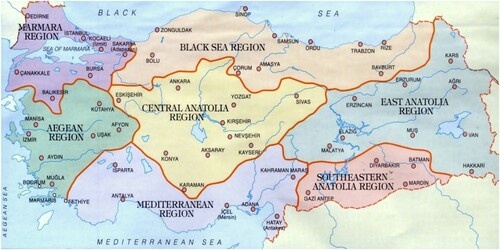
In this study, it was aimed to prioritise renewable energy sources (wind, solar, hydro, biomass, geothermal) for 7 geographical regions in Turkey. Turkey is surrounded by sea on three sides and is a country divided into seven geographical regions (Mediterranean, Aegean, Central Anatolia, Black Sea, Marmara, Eastern Anatolia and Southeastern Anatolia) by taking into account the criteria such as the separation of the inner parts of mountains from coasts, climate, transportation and vegetation (). While these regions are similar in terms of natural, human and economic characteristics among themselves, they differ greatly by physical factors (climatic characteristics, geographical formations, soil properties) and human factors (industrialisation, agriculture, underground sources, tourism, transportation). Renewable energy sources, number of plants and potential vary by regions.
Figure 1. Geographical regions in Turkey.
AHP and MARCOS methods, that are among the Multi Criteria Decision Making (MCDM) methods, were used for the prioritisation of renewable energy sources for seven regions. MCDM methods are used for the selection and ranking of more than one alternative in terms of multiple conflicting criteria. One of those methods, AHP is one of the most popular methods used in many MCDM problems (Rajak and Shaw Citation2019). AHP method has many advantages and can also be successfully applied to qualitative data as well as quantitative data. It can transform a complex and multi-criteria problem into a hierarchical structure. AHP is one of the rare methods that can take into account the consistency of decision makers (DMs). MARCOS method is a method for defining the relationship between the alternatives and reference values (ideal and anti-ideal alternatives). This method has advantages such as the evaluation of anti-ideal and ideal solution while constructing the initial matrix, determining the degree of benefit related to both solutions, defining new utility function to determine the benefit, and opportunity to consider a large number of criteria and alternatives while maintaining the stability of the method. In this study, the criteria weights obtained by the AHP method were used in the MARCOS method and a selection was made among the renewable energy sources alternatives for seven regions. The alternative ranking obtained for each region by the MARCOS method was compared with the alternative rankings obtained from the new generation MCDM methods, MOOSRA, MABAC, MAIRCA and CODAS, and the TOPSIS method, which is frequently used in the literature.
When the studies in the literature were reviewed, it was observed that evaluations were generally made across the country and that a single ranking related to renewable energy sources was obtained. In this study, unlike the studies in the literature, the selection and ranking of renewable energy sources on a regional basis were obtained for the first time. Thus, it was determined which energy source and in which region energy source should be prioritised.
Literature review and AHP and MARCOS methods are mentioned in the second and third parts of the study, respectively. In the fourth part, the selection of renewable energy sources was made for each region by using the AHP and MARCOS methods. In the fifth part, alternative ranking was obtained for each region with the MOOSRA, MABAC, MAIRCA, CODAS and TOPSIS methods, and a comparison analysis was performed by comparing it with the ranking obtained from the MARCOS method. Furthermore, sensitivity analysis was performed by changing the weights of main criteria and it was investigated how alternative ranking changed by changing the criteria weights. In the final part, the study results and discussion are presented.
2. Literature review
Studies on various topics related to renewable energy were conducted. Some of these study areas are as follows: measurement of energy efficiency (Emeç et al. Citation2019; Ervural, Zaim, and Delen Citation2018; Zeng et al. Citation2020), determination of the factors affecting renewable energy by statistical methods (Bamati and Raoofi Citation2019; Zeren and Akkuş Citation2020; Fan and Hao Citation2020), site selection for the plant (Doğan and Uludağ Citation2018; Saracoglu Citation2020), studies on economy (Valodka and Valodkienė Citation2015; Yıldırım Citation2019), modelling studies (Wang et al. Citation2019; Deveci and Güler Citation2020), studies on environmental effects (Ike et al. Citation2020; Fobissie and Inc Citation2019) etc.
The studies on the selection of renewable energy sources performed by using the MCDM methods are presented in .
Table 1. Studies on the selection of renewable energy sources performed by using the MCDM methods.
As a result of the literature review, it was observed that there was no study on the selection of renewable energy sources on a regional basis. In this study; (1) renewable energy sources were evaluated on a regional basis and an alternative ranking was obtained. (2) The selection of renewable energy sources was performed with the MARCOS, MOOSRA and CODAS methods for the first time, and their comparisons were analysed. (3) It was investigated whether there was a change in the rankings of renewable energy sources on a regional basis by changing the criteria weights.
3. Methodology
3.1. AHP (Analytic Hierarchy process)
The AHP method, which was proposed by Saaty in Citation1980, is probably the most popular methodology used in many MCDM problems (Saaty Citation1980; Rajak and Shaw Citation2019). This method has many advantages: it can be successfully applied to qualitative data as well as quantitative data, and it can transform a complex and multi-criteria problem into a hierarchical structure. The weights of main criteria and sub-criteria were calculated by forming pairwise comparison matrices according to the 1–9 scale determined by Saaty, using the AHP method, which is one of the rare methods that can take into account the consistency of DMs.
The reason why AHP is used classically without being combined with fuzzy logic is that Saaty and Tran indicated that the inclusion of fuzzy logic in traditional AHP would not make the results of real-life problems more valid (Saaty and Tran Citation2007; Rajak and Shaw Citation2019). The authors concluded that AHP itself was a fuzzy technique and there was no need to make it fuzzier. Based on it, the original AHP method was used in this study.
The steps of the AHP method are presented below (Dağdeviren, Yavuz, and Kılınç Citation2009; Delice and Güngör Citation2009; Işıklar and Büyüközkan Citation2007):
Step 1: Presenting the decision problem in a hierarchical structure
The problem is divided into goal, main criteria and sub-criteria and alternatives. A hierarchical structure is formed.
Step 2: Constructing pairwise comparison matrices
DMs’ opinions are obtained by constructing pairwise comparison matrices shown in Equation (1) between the main and sub-criteria. The 1–9 scale shown in is used while constructing these matrices by the experts (Saaty and Tran Citation2007).
Table 2. Saaty's 1–9 comparison scale.
Let be the set of criteria. Pairwise comparison matrix A (Equation (1)) to be constructed in the presence of n criterion is in the size of nxn and consists of
elements.
, refers to the rating of the criterion i in respect to the criterion j when the DM compares criterion i with criterion j. It is suggested that the weights obtained by making pairwise comparisons between the criteria are more reliable than obtaining weight directly (Işıklar and Büyüközkan Citation2007).
(1)
(1)
Step 3: Normalisation and finding relative weights
The comparison matrix is normalised before the calculation of priority vector. Each element in the pairwise comparison matrix
is normalised by dividing it by the sum of its column according to Equation (2). In this way, a normalised matrix is obtained in which the sum of the elements of each column vector is 1.
(2)
(2)
After normalisation, the eigenvectors should be calculated which would give the relative weights of criteria. The relative weights are shown as in Equation (3) with the right eigenvector corresponding to the highest eigenvector
:
(3)
(3)
If all pairwise comparisons are consistent, the matrix A has rank 1 and . In this case, the weights can be obtained by normalising any of the rows or columns of A.
These procedures are repeated for the main and sub-criteria in the hierarchy. The relative priorities of the sub-criteria are determined by multiplying the local weights of the sub-criteria by the global weights of main criteria. As a result, the overall relative priority is obtained for the sub-criteria at the lower level of the hierarchy. These overall, relative priorities show to what extent the criteria contribute to the achievement of the goal. The perspectives of various stakeholders on the evaluation process in which these priorities are obtained are integrated (Wang and Yang Citation2007).
Step 4: Calculation of consistency ratio (CR)
Whether the judgments obtained as a result of pairwise comparisons performed between the criteria are consistent is checked. Whether an A matrix constructed with the judgments of DMs is consistent is obtained by calculating the ‘Consistency Index (CI)’ value given in Equation (4).
(4)
(4)
The ‘Random Index (RI)’ value should also be known in order to check consistency. RI values corresponding to each matrix size n are presented in (Delice and Güngör Citation2009).
Table 3. RI values according to matrix size.
After CI and RI ratios are determined, CR value is calculated using Eq.5 (Adar, Ok, and Delice Kılıç Citation2017).
(5)
(5) CR value should be less than 0.1 so that the matrix would be consistent. It is concluded that the matrix is inconsistent if the CR value is found to be greater than 0.1, and pairwise comparison matrix is reviewed again (Dağdeviren, Yavuz, and Kılınç Citation2009).
3.2. MARCOS (Measurement alternatives and ranking according to compromise solution)
MARCOS method is a new generation MCDM method proposed by Stević et al. (Citation2020). This method has advantages such as the evaluation of anti-ideal and ideal solution while constructing the initial matrix, closer determination of the degree of benefit related to both solutions, defining the new utility function to determine the benefit, and opportunity to consider a large number of criteria and alternatives while maintaining the stability of the method.
MARCOS method is based on defining the relationship between the alternatives and reference values (ideal and anti-ideal alternatives). Based on the relationships defined, the utility functions of alternatives are determined and compromise ranking is performed according to the ideal and anti-ideal solutions. Decision preferences are defined on the basis of utility functions. Utility functions represent the position of an alternative with regard to an ideal and anti-ideal solution. The best alternative is the one that is closest to the ideal and at the same time furthest from the anti-ideal reference point.
MARCOS method is a very new method proposed in 2020. The studies conducted using this method are as follows: In the study of Stević et al. (Citation2020), sustainable supplier selection in the private medical sector was performed with the MARCOS method. 8 alternatives were ranked with this method with regard to 21 criteria. In the study, sensitivity analysis consisting of 21 scenarios for the change of criteria weights and comparison analysis with six other MCDM methods were performed. In the study of Stević and Brković (Citation2020) evaluation of Human Resources in a Transport Company with FUCOM-MARCOS was performed. 23 drivers were evaluated with regard to five main criteria. Criteria priorities were found with the FUCOM method and the alternative ranking was found with the MARCOS method. In the study of Stanković et al. (Citation2020), Fuzzy MARCOS method was proposed. Method validity was shown for road traffic risk analysis. The MARCOS method used for supplier selection for steelmaking company (Badi and Pamucar Citation2020) and evaluation software of project management (Puška et al. Citation2020).
The steps of the MARCOS method are as follows:
Step 5: Formation of an initial decision-making matrix
In case of a decision with n criteria and m alternatives, DMs are selected to evaluate alternatives according to criteria. In case of multiple DMs, expert evaluation matrices are combined. DMs use the scale 1–9 for their evaluations.
Step 6: Formation of an extended initial matrix
In this step, the extension of the initial matrix is performed by defining the ideal (AI) and anti-ideal (AAI) solution (Equation (6)).
(6)
(6) While the anti-ideal solution (AAI) is the worst alternative, the ideal solution (AI) represents an alternative with the best characteristic. Depending on the nature of the criteria, AAI and AI are obtained by Equations (7)–(8)
(7)
(7)
(8)
(8) where B represents a benefit group of criteria, while C represents a group of cost criteria.
Step 7: Normalisation of the extended initial matrix (X)
The elements of the normalised N matrix are obtained by using Equations (9)–(10).
(9)
(9)
(10)
(10) where
and
, represent the elements of the matrix X.
Step 8: Determination of the weighted matrix (V)
The weighted matrix (V) is obtained by multiplying the normalised matrix elements by the criteria weights (Equation (11)).
(11)
(11)
Step 9: Calculation of the utility degree of alternatives
The utility degrees of alternatives in relation to the anti-ideal and ideal solution are calculated using Equations (12)–(13).
(12)
(12)
(13)
(13) where,
represents the sum of the elements of the weighted matrix (V) (Equation (14)).
(14)
(14)
Step 10: Determination of the utility function of alternatives
The utility function is the compromise value of the observed alternative in relation to the ideal and anti-ideal solution. The utility functions of the alternatives are determined by Equation (15).
(15)
(15) where,
and
indicate the utility function in relation to the ideal solution and anti-ideal solution, respectively. These functions are calculated using Equations (16)–(17).
(16)
(16)
(17)
(17)
Step 11: Ranking the alternatives in relation to utility function values
Ranking is performed from the alternative with higher utility function value to the alternative with low utility function, and ultimately the best alternative is selected.
4. Proposed AHP & MARCOS Model
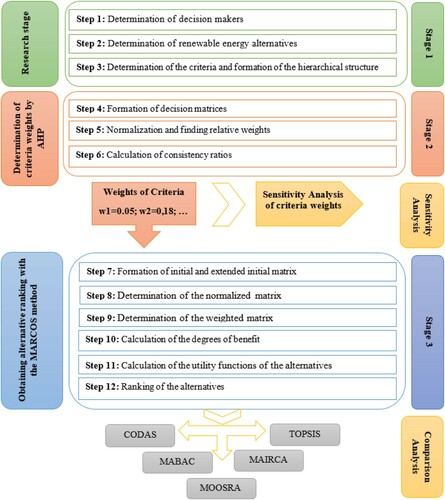
The proposed model consists of three stages. In the first stage, DMs criteria and alternatives are determined. While criteria weights are obtained with the AHP method in the second stage, renewable energy sources alternatives are ranked with the MARCOS method and the energy source that should be preferred firstly for each region is determined in the third stage. The stages of the proposed method are presented in .
Figure 2. Stage of the proposed AHP&MARCOS model.
5. Application
In this section, regional renewable energy sources for Turkey were evaluated with the AHP-MARCOS method. This evaluation process will be discussed according to the stages given in the proposed AHP&MARCOS section ().
Stage 1. Research stage: Determination of DMs, criteria and alternatives
Step 1: Determination of DMs
Making correct decisions in the decision-making process depends on adequate knowledge and experience of DMs, as well as the correct determination of criteria and alternatives. Therefore, the selection of DMs is an important issue. In this study, the DMs group was composed of 11 people because there were few people with sufficient knowledge and experience about renewable energy sources. The decision-makers group consisting of two academicians, six engineers and three experts was involved in the determination of criteria and alternatives and the formation of decision matrices. Two academicians in the decision-makers group did doctorate in the field of renewable energy. The remaining 9 DMs consisted of 6 engineers and 3 experts working in R.T Ministry of Energy and Natural Resources. 2 environmental and 4 energy engineers with an experience of 3 and 6 years working in the Department of Renewable Energy Resources Project Development and Follow-up were selected. The experts consisted of individuals with an experience of 5 and 12 years working in Energy Natural Resources Strategy Development Unit.
Step 2: Determination of alternatives
The distribution of our installed power by resources by the end of September 2019 in energy generation consisted of hydropower energy by 31.4%, natural gas by 28.6%, coal by 22.4%, wind by 8.1%, solar by 6.2%, geothermal by 1.6%, and other sources by 1.7% (ETBKd Citation2020). The renewable energy sources that contribute to energy generation in Turkey are wind, solar, hydro, and geothermal sources. In this study, the opinions of the decision-makers group were also received in line with this information, and renewable energy sources alternatives were determined as wind energy (A1), solar energy (A2), geothermal energy (A3), biomass (A4) and hydropower (A5).
Wind energy (A1) is a natural, renewable, clean and endless source of energy. Wind power plants (WPP) have no foreign dependency, raw material shortage, and negative effects on nature and human health. They require little space for installation (ETBKa Citation2020). As of July 2019, the share of WPPs in electricity generation was 7.40% in Turkey. Due to its geographical position, Turkey is under the influence of different air masses that lead to potential wind energy generation opportunities in different areas, and especially, northwestern winds of the Balkan Peninsula and the Black Sea provide strong winds in winter period (Barlas Citation2019). As of December 2019, 275 Wind energy plants and an installed wind power of 7.591,2 MW were available in Turkey (Energy portal Citation2019a).
Solar energy (A2) is a renewable energy source with characteristics such as not polluting the environment and not creating hazardous wastes, as well as its ease of installation and use. Our country has high solar energy potential due to its geographical position. According to Turkey Solar Energy Potential Atlas (GEPA), the total annual sunshine duration is 2.741 h (daily average 7.5 h), and the total annual incoming solar energy is 1,527 kWh/m².year (daily average 4.18 kWh/m².day) (GEPA Citation2020).
Geothermal energy (A3) is a renewable, clean, cheap and environmentally friendly underground resource with a wide range of uses, from human health and agriculture to industry, from electricity to heating. Our country is in a geothermally rich position among the world countries because of being located on an active tectonic belt due to its geological and geographical position (ETBKc Citation2020).
Biomass (A4) is defined as organic matter including plant and animal waste, food, forestry by-products and urban waste. It is an energy source with an important place among renewable energy sources that do not pollute the environment (Kazaz Citation2018). In Turkey, there are 199 biomass-sourced electricity generation plants. According to BEPA, the total energy equivalent of wastes is 14.627.331 TEP/year (BEPA Citation2020).
Hydropower Plants (A5) convert the power of running water into electricity (Energy portal Citation2019b). Hydropower plant potential is higher in places where altitude and roughness are high and the flow rate of streams is high. While theoretical hydropower potential of our country is 1% of the world theoretical potential, its economic potential is 16% of the European economic potential (ETKBb Citation2020). As of December 2019, 682 hydropower plants and 28,503 MW installed hydropower power were available in Turkey (Enerji portalı Citation2019a).
Step 3: Determination of the criteria and formation of the hierarchical structure
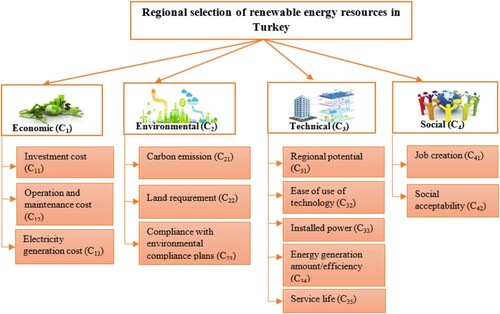
4 main criteria (economic (C1), environmental (C2), technical (C3), social criteria (C4)) and 13 sub-criteria (investment cost (C11), operation and maintenance cost (C12), electricity generation cost (C13), carbon emission (C21), land requirement (C21), compliance with environmental compliance plans (C21), regional potential (C31), ease of use of technology (C32), installed power (C33), energy generation amount/efficiency (C34), service life (C35), job creation (C41), social acceptability (C42)) were determined as a result of the opinions of the decision-makers group and the literature review. These criteria selected are the most used criteria in the studies on renewable energy source selection available in the literature (Kaya and Kahraman Citation2010; Kabak and Dağdeviren Citation2014; Büyüközkan and Güleryüz Citation2017).
The hierarchical structure consisting of the criteria and alternatives to be used in the selection of regional renewable energy sources for Turkey is presented in .
Figure 3. Hierarchical structure.
Stage 2. Determination of criteria weights by AHP
In this stage, the weights of the criteria and sub-criteria to be used in the selection of regional renewable energy sources for Turkey were determined by applying the steps of AHP presented in the methodology section.
Step 4: Formation of decision matrices
Since all the real numerical values cannot be reached according to the criteria (economic, technical, environmental and social) considered, MCDM method was used as a method in this study. In other words, expert opinions were received through a questionnaire, calculations were made and results were obtained. The questionnaire used in this study was specified in the study and added to the end of the study (Supplementary).
Decision matrices were formed by each DM by using the 1–9 scale proposed by Saaty and presented in . All procedures are shown through main criteria only for DM1. The same calculation process was applied for other DMs and other sub-criteria. The decision matrix including the opinions of DM1 for the main criteria are presented in .
Table 4. Decision matrix for the main criteria (DM1).
Step 5: Normalisation and finding relative weights
The comparison matrix presented in for the main criteria are normalised using Equation (2). After normalisation, the eigenvectors that will give the relative weights of the criteria are calculated using Equation (3).
Step 6: Calculation of Consistency ratios (CR)
Whether the judgments obtained as a result of pairwise comparisons performed between the criteria were consistent was calculated with Equations (4)–(5). Normalised matrix, values and consistency rate are presented in .
Table 5. Normalised decision matrix for the main criteria (DM1)
They are the criteria weights obtained by pairwise comparisons performed by DM1 as a result of the above calculations. The weights are found for the main and sub-criteria by performing calculations for each DM. Whether the judgments obtained as a result of pairwise comparisons performed between the criteria were consistent was calculated with Equations (4)–(5). In this study, the consistency ratios of pairwise comparison matrices were calculated for the main and sub-criteria created by 11 DMs and the matrices of 6 DMs were found to be consistent. Therefore, the application was maintained through the evaluations of 6 DMs.
In the next stage, the pairwise comparison matrices of main and sub-criteria for 6 DMs were formed and then these matrices were combined with a geometric mean. For instance, the decision matrices combined for the main criteria are presented in .
Table 6. Aggregated decision matrix for main criteria.
Aggregated decision matrix was normalised using Equation (2). After normalisation, the relative weights of the criteria were calculated using Equation (3). The consistency ratio of the matrices was recalculated with Equations (4)–(5) and the matrices were found to be consistent. Normalised matrix, value and consistency rate are presented in .
Table 7. Normalised decision matrix for the main criteria.
After the same procedures were applied for the economic, technical, environmental and social sub-criteria, the local weights of the criteria were calculated. Local and global weights of the main and sub-criteria are presented in . Global weights are found by multiplying the weights of main criteria by the weights of sub-criteria.
Table 8. Local and global weights of the criteria.
As a result of the AHP method calculations, when the main criteria were evaluated within themselves, the most significant main criterion was determined as the economic criterion (C1=0.564), and the most insignificant main criterion was determined as the social criterion (C4=0.072). When the global criteria weights taken in the sub-criteria were examined, it was determined that the most significant sub-criterion and the most insignificant sub-criteria were investment cost (C11) and job creation (C41), respectively.
Stage 3. Obtaining alternative ranking with the MARCOS method
In this stage, renewable energy sources were prioritised for the Mediterranean, Aegean, Central Anatolia, Black Sea, Marmara, Eastern Anatolia and Southeast Anatolia regions by using the criteria weights obtained with the AHP method and by applying the steps of the MARCOS method presented in the methodology section. Here, the main purpose was to determine which renewable energy sources should be prioritised in these regions, which are similar in terms of natural, human and economic characteristics among themselves but differ in terms of physical factors and renewable energy sources, number of plants and current potential. In this paper, the calculations performed for the Eastern Anatolia Region are presented. Renewable energy resource priorities were obtained by performing the same calculations for other regions.
Step 7: Formation of initial and extended initial matrix
At first, each of DM evaluated 5 alternatives separately for 7 regions in terms of 13 criteria. Then, decision matrices were combined with geometric mean (). DMs used the 1–9 scale for their evaluations. The ideal (AI) and anti-ideal (AAI) solution was determined in the form in Equation (6) using Equations (7) and (8) ().
Table 9. Initial and extended initial matrix for the Eastern Anatolia Region.
Step 8: Normalisation of the extended initial matrix
Matrix normalised using Equations (9–10) was obtained as in . In this study, the first five criteria (C11, C12, C13, C21 and C22) were cost criteria, and the remaining criteria were benefit criteria.
Table 10. Normalised matrix for the Eastern Anatolia Region.
Step 9: Determination of the weighted matrix
The weighted matrix was calculated as in using Equation (11).
Table 11. Weighted matrix for the Eastern Anatolia Region.
Steps 10–12: Calculation and ranking of the degrees of benefit and utility functions of the alternatives
The degrees of benefit of the alternatives were calculated according to the anti-ideal and ideal solutions using Equations (12)–(13). The utility functions of the alternatives were determined with Equation (15) using Equations (16)–(17). A ranking was made from the alternative with a high utility function value to the alternative with a low utility function value, and the priority ranking of renewable energy sources for the Eastern Anatolia Region was obtained ().
Table 12. Priority ranking of renewable energy sources for the Eastern Anatolia Region.
According to , the energy source that should be preferred firstly for the Eastern Anatolia Region was hydropower. More dams should be established in the region to obtain this energy source. All calculation steps were applied in the other six regions and the alternative rankings obtained are presented in .
Table 13. Priority ranking of renewable energy sources for the six regions.
Priority rankings of renewable energy sources as a result of the application of MARCOS method were found to as follows:
For the Eastern Anatolia Region, Hydropower (A5)> Biomass (A4)> Wind (A1) > Solar (A2)> Geothermal (A3);
For the Mediterranean Region, Hydropower (A5)> Wind (A1)> Solar (A2)> Biomass (A4)> Geothermal (A3);
For the Southeastern Anatolia Region, Hydropower (A5)> Solar (A2)> Wind (A1)> Biomass (A4)> Geothermal (A3);
For the Marmara Region, Wind (A1)> Solar (A2)> Biomass (A4)> Hydropower (A5)> Geothermal (A3);
For the Aegean Region, Wind (A1)> Solar (A2)> Geothermal (A3)> Hydropower (A5)> Biomass (A4);
For the Black Sea Region, Hydropower (A5)> Wind (A1)> Biomass (A4)> Solar (A2)> Geothermal (A3)
For the Central Anatolia Region, Solar (A2)> Biomass (A4)> Wind (A1)> Hydropower (A5)> Geothermal (A3).
As it is seen from these rankings, while hydropower energy source was on the first rank in the Eastern Anatolia, Mediterranean, Southeastern Anatolia and Black Sea Regions, Solar energy source was on the first rank in the Central Anatolia Region, and Wind energy source was on the first rank in the Marmara and Aegean Regions.
When the distribution of hydropower plants with a power of greater than 100MWE that are under construction by cities is examined, it appears that they are in the Eastern Anatolia, Mediterranean, Black Sea and South Eastern Anatolia Regions. Our hydropower potential is very high and distributed across these four regions, therefore, it is a reasonable selection to make hydropower investments in these four regions. In our model, hydropower energy source was also on the first rank in these four regions in all scenario analyses. Similarly, in the studies in which prioritisation of renewable energy sources was performed for Turkey with the MCDM techniques (Boran, Boran, and Menlik Citation2012; Şengül et al. Citation2015; Köne and Büke Citation2007; Ayan and Pabuçcu Citation2013; Kabak and Dağdeviren Citation2014), hydropower energy source was found to be on the first rank. When renewable energy sources are examined in general, hydropower energy sources for Turkey are more than all other sources in terms of both installed power and potentials. In our study, the fact that it was found to be of first priority in four of seven regions in our country can be considered as a result supported by the studies in the literature.
The fact that our wind energy source was found to be on the first rank in the Aegean and Marmara regions can be shown as an evidence that the outcomes of our model were significant. In four of five scenario analyses, the wind source ranked first in the Aegean and Marmara regions. Only in the fifth scenario analysis, the solar source ranked first and the wind source ranked second in the Aegean region. In terms of DMs it is obvious that it will be beneficial to make investments of future wind energy plants in the Aegean and Marmara regions. A regional study that will directly support these results in the literature is the study of Kaya and Kahraman (Citation2010). In the study, the prioritisation of renewable energy resources was performed for Istanbul (a city in the Marmara Region), and the Wind source was found to be on the first rank. Similarly, in the studies of Büyüközkan and Güleryüz (Citation2016); Kahraman, Kaya, and Cebi (Citation2009); Özcan, Ünlüsoy, and Eren (Citation2017); Karaca, Ulutaş, and Eşgünoğlu (Citation2017); Çolak and Kaya (Citation2017); Ertay, Kahraman, and Kaya (Citation2013), wind source ranked first in the resource prioritisation performed for the whole Turkey with the multi-criteria decision-making techniques.
When the list of installed Solar energy plants in Turkey (Energy Atlas Citation2020) is examined in detail and each city is classified by regions, it can be determined that while 59% of our current installed solar energy plants in the Central Anatolia, 13% of it is in the Aegean, 11% of it is in the Mediterranean, 7% of it is in the South Eastern Anatolia, 5% of it is in the Eastern Anatolia, 4% of it is in the Marmara Region, and 1% of it is in the Black Sea Region. In addition, the construction of the GES, which will be one of the largest GESs in the world, with a capacity of 1000 MWe in Konya-Karapınar (in the Central Anatolia Region), is going on. Based on these conclusions, the fact that the solar resource ranked first in the Central Anatolia in our study made our results more valuable. In the resource prioritisation studies conducted for Turkey with the MCDM techniques in the literature, the solar source ranked first only in the study of Çelikbilek and Tüysüz (Citation2016). In our study, solar resource ranked first only in one of seven regions in our country.
Sensitivity analysis – changing the weights of main-criteria
In this section, sensitivity analysis was performed by changing the weights of main-criteria. Five scenarios were established to determine in which regions the renewable energy source would have a higher priority if the significance level of the weights of main criteria changed (Lee and Chang Citation2018; Wang, Xu, and Solangi Citation2020). According to these scenarios, the change in renewable energy resource priorities for seven geographical regions is presented in .
Figure 4. Regional alternative rankings by Scenarios.
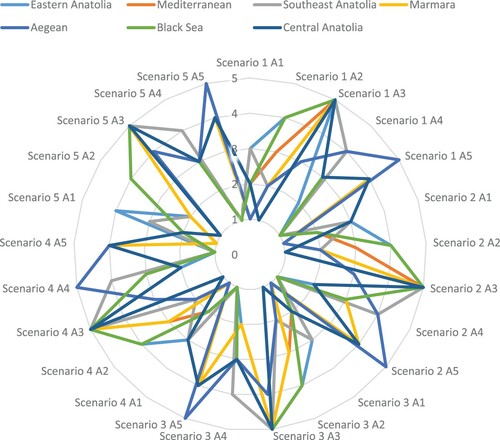
In Scenario 1, the weights of main-criteria are equal (C1= C2= C3= C4=0.25).
In Scenario 2, while the weight of the economic criteria was highest, the weights of other main criteria were equal (C1=0.4, C2= C3= C4=0.20).
In Scenario 3, while the weight of environmental criteria was highest, the weights of other main criteria were equal (C2=0.4, C1= C3= C4=0.20).
In Scenario 4, while the weight of technical criteria was highest, the weights of other main criteria were equal (C3=0.4, C1= C2= C4=0.20).
In Scenario 5, while the weight of social criteria was highest, the weights of other main criteria were equal (C4=0.4, C1= C2= C3=0.20).
While hydropower source was on the first rank for the Eastern Anatolia, Mediterranean, Southeastern Anatolia and Black Sea Regions for each scenario, and geothermal energy ranked last. According to Scenario 4, solar energy source was on the second rank for these 3 regions. According to Scenario 3, Biomass, Wind and Solar energy sources were on the second rank for the Eastern Anatolia Region, Mediterranean Region and Southeastern Anatolia Region, respectively. As it can be understood from here, there was no change in the first and last energy sources according to the priorities of significance level of the technical and social criteria, however, the priority ranking of other energy sources varied.
While wind energy source was on the first rank for the Marmara and Aegean Regions for the first four scenarios, geothermal energy source and hydropower source were on the last rank for the Marmara Region and the Aegean Region, respectively, in each scenario. According to Scenario 5, while wind energy source was on the first rank for the Marmara region, while Solar Energy Source was on the first rank for the Aegean Region.
Solar energy source was on the first rank and geothermal energy was on the last rank for the Central Anatolia Region in each scenario. The energy source, which was on the second rank for the Central Anatolia Region, differed according to the scenarios and varied between wind and biomass energy.
Comparison analysis
In this section, the priority ranking of renewable energy sources was determined for each region with the TOPSIS, MOOSRA, CODAS, MABAC and MAIRCA methods, which are the other decision-making techniques. Among these methods, the article of Işıklar and Büyüközkan (Citation2007) can be examined for the TOPSIS method, the article of Das, Sarkar, and Ray (Citation2012) can be examined for the MOOSRA method, the articles of Pamučar, Vasin, and Lukovac (Citation2014) and Adar et al., (Citation2019) can be examined for the MAIRCA method, the article of Pamučar and Ćirović (Citation2015) can be examined for the MABAC method, and the article of Keshavarz Ghorabaee et al. (Citation2016) can be examined for the CODAS method. The general common feature of the methods is that they try to determine the ideal alternative using distance measures. Therefore, the alternative ranking was obtained using these methods. Due to the limitation of the area, only the regions the alternative ranking of which had changes were presented (). In the figures, the y axis shows the ranking of the alternative and the x axis shows the alternatives according to the method used.
Figure 5. Comparison of other method alternative rankings for the Marmara Region.
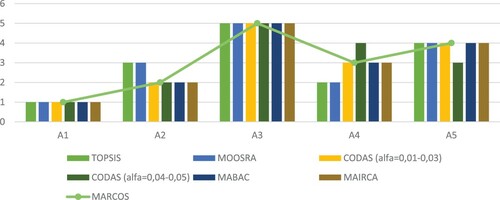
Figure 6. Comparison of other method alternative rankings for the Aegean Region.
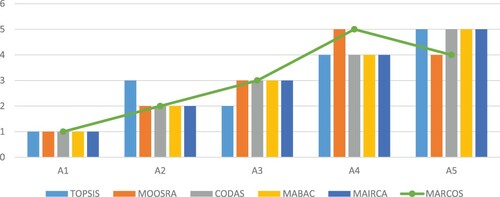
Figure 7. Comparison of other method alternative rankings for the Central Anatolia Region.
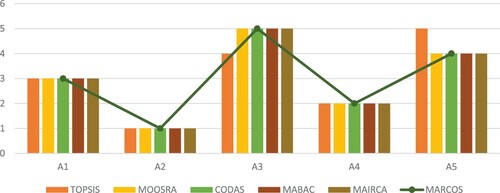
As it is seen in the figures, there was not much change in the priority ranking of renewable energy sources for the Marmara, Aegean and Central Anatolia Regions. Nevertheless, it is observed that the priority ranking of the final resource was Solar (A2), Biomass (A4), Wind (A1), Hydropower (A5) and Geothermal (A3) for the Central Anatolia Region. it is observed that the priority ranking of the final resource was Wind (A1), Solar (A2), Geothermal (A3), Biomass (A4), Hydropower (A5) for the Aegean Region, which also indicated that the alternative rankings obtained by the proposed integrated AHP&MARCOS method and the rankings obtained by the other method were consistent with each other. In the Marmara Region, it is observed that Wind (A1) was on the first rank and Geothermal (A3) was on the last rank as a result of the calculations performed by each method.
6. Conclusion and Policy implications
It is one of the most important issues of the country's administrators to meet the increased energy need along with the increasing population and industrialisation in a sustainable and safe manner. Considering issues such as insufficient available fossil resources in our country, increased environmental sensitivities in recent years, high dependence on foreign energy, and energy supply security, the orientation to renewable energy sources has become inevitable.
In the literature, many studies were conducted for the prioritisation of renewable energy sources for Turkey, however, these studies may lead to misleading results for our country, which consists of a wide geography and regions with different characteristics. Based on this view, the idea that evaluating renewable energy sources separately for each region would be more reasonable constituted the main motivation of the study. Unlike the literature, our study has been the first study that prioritised renewable energy resources on a regional basis for Turkey.
In the study, according to the results of resource prioritisation studies performed for seven regions of Turkey, hydropower plants came to the forefront in the Eastern Anatolia, Mediterranean, Southeastern and Black Sea regions, Wind power plants came to the forefront in the Marmara and Aegean regions, and finally, Solar Energy Plants came to the forefront in the Central Anatolia region. The fact that policy makers and DMs consider this evaluation is vital for renewable energy investments, which have increased especially in recent years and have played an important role in closing our energy deficit.
Future studies would include making comparative analyses using the methods based on Intuitionistic Fuzzy Sets, Interval-valued Intuitionistic Fuzzy Sets and classical Fuzzy Sets.
CRediT authorship contribution statement
Abdulkerim Karaaslan: Investigation, making decisions by contacting the experts (filling out a questionnaire), writing – original draft; Tuba Adar: Making calculations with MCDM techniques, investigation; Elif Kilic Delice: Review & editing, Supervision.
GSOL_1897126_Supplementary_Material
Download MS Word (40.4 KB)Acknowledgements
We thank experts that have given constructive comments and feedback to help improve this paper.
Disclosure statement
No potential conflict of interest was reported by the author(s).
References
- Adar, T., and E.K. Delice. 2019. “New Integrated Approaches Based on MC-HFLTS for Healthcare Waste Treatment Technology Selection.” Journal of Enterprise Information Management 32 (4): 688–711.
- Adar, T., Y. Ok, and E. Delice Kılıç. 2017. “Selection of On-site Energy Generation Technology With a New MCDM Approach Using MABAC&AHP.” International Conference on Industrial Engineering and Technology Management, Dallas, Texas.
- Alizadeh, R., L. Soltanisehat, P.D. Lund, and H. Zamanisabzi. 2019. “Improving Renewable Energy Policy Planning and Decision-Making Through a Hybrid MCDM Method.” Energy Policy 111174: 1–17.
- Ayağ, Z., and F. Samanlioglu. 2019. “Fuzzy AHP-GRA Approach to Evaluating Energy Sources: A Case of Turkey.” International Journal of Energy Sector Management 14(1): 40–58.
- Ayan, T., and H. Pabuçcu. 2013. “Yenilenebilir Enerji Kaynakları Yatırım Projelerinin Analitik Hiyerarşi Süreci Yöntemi ile Değerlendirilmesi.” Süleyman Demirel Üniversitesi İktisadi ve İdari Bilimler Fakültesi Dergisi 18(3): 89–110.
- Badi, I., and D. Pamucar. 2020. “Supplier Selection for Steelmaking Company by Using Combined Grey-MARCOS Methods.” Decision Making: Applications in Management and Engineering 3 (2): 37–48.
- Bamati, N., and A. Raoofi. 2019. “Development Level and the Impact of Technological Factor on Renewable Energy Production.” Renewable Energy 151: 946–955.
- Barlas, S.S. 2019. Türkiye Hâkim Rüzgâr ve Ortalama Rüzgâr Vektörel Haritası ile Türkiye Rüzgâr Enerji Potansiyelinin Değerlendirilmesi. Yüksek Lisans Tezi, Namık Kemal Üniversitesi, Tekirdağ.
- BEPA (Biyokütle Enerji Potansiyel Haritası). 2020. Accessed March 13 2020. https://bepa.enerji.gov.tr/.
- Boran, F.E., K. Boran, and T. Menlik. 2012. “The Evaluation of Renewable Energy Technologies for Electricity Generation in Turkey Using Intuitionistic Fuzzy TOPSIS.” Economics, Planning and Policy 7(1): 81–90.
- Büyüközkan, G., and S. Güleryüz. 2016. “An Integrated DEMATEL-ANP Approach for Renewable Energy Resources Selection in Turkey.” International Journal of Production Economics 182: 435–448.
- Büyüközkan, G., and S. Güleryüz. 2017. “Evaluation of Renewable Energy Resources in Turkey Using an Integrated MCDM Approach with Linguistic Interval Fuzzy Preference Relations.” Energy 123: 149–163.
- Büyüközkan, G., Y. Karabulut, and E. Mukul. 2018. “A Novel Renewable Energy Selection Model for United Nations’ Sustainable Development Goals.” Energy 165: 290–302.
- Çelikbilek, Y., and F. Tüysüz. 2016. “An Integrated Grey Based Multi-Criteria Decision Making Approach for the Evaluation of Renewable Energy Sources.” Energy 115(Part 1): 1246–1258.
- Çolak, M., and İ Kaya. 2017. “Prioritization of Renewable Energy Alternatives by Using an Integrated Fuzzy MCDM Model: A Real Case Application for Turkey.” Renewable and Sustainable Energy Reviews 80: 840–853.
- Dağdeviren, M., S. Yavuz, and N. Kılınç. 2009. “Weapon Selection Using the AHP and TOPSIS Methods Under Fuzzy Environment.” Expert Systems with Applications 36 (4): 8143–8151.
- Das, M.C., B. Sarkar, and S. Ray. 2012. “Decision Making Under Conflicting Environment: a new MCDM Method.” International Journal of Applied Decision Sciences 5 (2): 142–162.
- Delice, E.K., and Z. Güngör. 2009. “The Usability Analysis with Heuristic Evaluation and Analytic Hierarchy Process.” International Journal of Industrial Ergonomics 39 (6): 934–939.
- Deveci, K., and Ö Güler. 2020. “A CMOPSO Based Multi-Objective Optimization of Renewable Energy Planning: Case of Turkey.” Renewable Energy. In press
- Doğan, H., and A. S. Uludağ. 2018. “Yenilenebilir Enerji Alternatiflerinin Değerlendirilmesi ve Uygun Tesis Yeri Seçimi: Türkiye’de Bir Uygulama.” Ekonomik ve Sosyal Araştırmalar Dergisi 14 (2): 157–180.
- Emeç, Ş, T. Adar, G. Akkaya, and E.K. Delice. 2019. “Measuring the Efficiency of Wind Power Plants Using Data Envelopment Analysis: A Case Study from TURKEY.” Turk J Electrom Energ 4 (2): 19–32.
- Enerji Atlası. 2020. Accessed April 4 2020. https://www.enerjiatlasi.com/gunes/.
- Enerji Portalı. 2019a. Accessed March 12 2020. https://www.enerjiportali.com/teias-aralik-2019-sonu-kurulu-guc-raporunu-yayimladi/.
- Enerji Portalı. 2019b. Accessed March 13 2020. https://www.enerjiportali.com/hidroelektrik-enerjisi-hes-nedir-nasil-elektrik-uretir/.
- Enerji ve Tabi Kaynaklar Bakanlığı (ETBKa). Accessed March 6 2020. https://www.enerji.gov.tr/tr-TR/Sayfalar/Elektrik-ETBK-.
- Enerji ve Tabi Kaynaklar Bakanlığı (ETBKb). Accessed March 13 2020. https://www.enerji.gov.tr/tr-TR/Sayfalar/Hidrolik.
- Enerji ve Tabi Kaynaklar Bakanlığı (ETBKc). Accessed March 13 2020. https://www.enerji.gov.tr/tr-TR/Sayfalar/Jeotermal.
- Enerji ve Tabi Kaynaklar Bakanlığı (ETBKd). [Accessed March 27 2020. https://www.enerji.gov.tr/tr-TR/Sayfalar/Elektrik.
- Ertay, T., C. Kahraman, and İ Kaya. 2013. “Evaluation of Renewable Energy Alternatıves Using Macbeth and Fuzzy Ahp Multi-Criteria Methods: The Case of Turkey.” Technological and Economic Development of Economy 19(1): 38–62.
- Ervural, B.C., S. Zaim, and D. Delen. 2018. “A Two-Stage Analytical Approach to Assess Sustainable Energy Efficiency.” Energy 164: 822–836.
- Fan, W., and Y. Hao. 2020. “An Empirical Research on the Relationship Amongst Renewable Energy Consumption, Economic Growth and Foreign Direct Investment in China.” Renewable Energy 146: 598–609.
- Fobissie, E.N., and F. Inc. 2019. “The Role of Environmental Values and Political Ideology on Public Support for Renewable Energy Policy in Ottawa, Canada.” Energy Policy 134: 110918.
- Ghose, D., S. Pradhan, and Shabbiruddin. 2019. “Development of Model for Assessment of Renewable Energy Sources: a Case Study on Gujarat, India.” International Journal of Ambient Energy 1–10.
- GEPA (Güneş Enerji Potansiyeli Atlası). Accessed March 11 2020. http://www.yegm.gov.tr/MyCalculator/Default.aspx.
- Ike, G.N., O. Usman, A.A. Alola, and S. A. Sarkodie. 2020. “Environmental Quality Effects of Income, Energy Prices and Trade: The Role of Renewable Energy Consumption in G-7 Countries.” Science of The Total Environment 721: 1–10, 137813.
- Işıklar, G., and G. Büyüközkan. 2007. “Using a Multi-Criteria Decision Making Approach to Evaluate Mobile Phone Alternatives.” Computer Standards & Interfaces 29 (2): 265–274.
- Kabak, M., and M. Dağdeviren. 2014. “Prioritization of Renewable Energy Sources for Turkey by Using a Hybrid MCDM Methodology.” Energy Conversion and Management 79: 25–33.
- Kahraman, C., İ Kaya, and S. Cebi. 2009. “A Comparative Analysis for Multiattribute Selection among Renewable Energy Alternatives Using Fuzzy Axiomatic Design and Fuzzy Analytic Hierarchy Process.” Energy 34 (10): 1603–1616.
- Karaca, Ç, A. Ulutaş, and M. Eşgünoğlu. 2017. “Türkiye’de Optimal Yenilenebilir Enerji Kaynağının COPRAS Yöntemiyle Tespiti ve Yenilenebilir Enerji Yatırımlarının İstihdam Artırıcı Etkisi.” Maliye Dergisi 172: 111–132.
- Kaya, T., and C. Kahraman. 2010. “Multicriteria Renewable Energy Planning Using an Integrated Fuzzy VIKOR & AHP Methodology: The Case of Istanbul.” Energy 35(6): 2517–2527.
- Kazaz, O. 2018. “Biomass Energy Potential of Turkey.” Master Thesis, Çukurova University, Adana.
- Keshavarz Ghorabaee, M., E.K. Zavadskas, Z. Turskis, and J. Antucheviciene. 2016. “A New Combinative Distance-Based Assessment (CODAS) Method for Multi-Criteria Decision-Making.” Economic Computation & Economic Cybernetics Studies & Research 50 (3): 25–44.
- Köne, AÇ, and T. Büke. 2007. “An Analytical Network Process (ANP) Evaluation of Alternative Fuels For Electricity Generation in Turkey.” Energy Policy 35(10): 5220–5228.
- Lee, H.C., and C. T. Chang. 2018. “Comparative Analysis of MCDM Methods for Ranking Renewable Energy Sources in Taiwan.” Renewable and Sustainable Energy Reviews 92: 883–896.
- Naicker, P., and G. A. Thopil. 2019. “A Framework for Sustainable Utility Scale Renewable Energy Selection in South Africa.” Journal of Cleaner Production 224: 637–650.
- Özcan, E.C., S. Ünlüsoy, and T. Eren. 2017. “ANP ve TOPSIS Yöntemleriyle Türkiye'de Yenilenebilir Enerji Yatırım Alternatiflerinin Değerlendirilmesi.” Selçuk Üniversitesi Mühendislik, Bilim Ve Teknoloji Dergisi 5(2): 204–219.
- Pamučar, D., and G. Ćirović. 2015. “The Selection of Transport and Handling Resources in Logistics Centers Using Multi-Attributive Border Approximation Area Comparison (MABAC).” Expert Systems with Applications 42: 3016–3028.
- Pamučar, D., L. Vasin, and V. Lukovac. 2014. “Selection of Railway Level Crossings for Investing in Security Equipment Using Hybrid DEMATEL-MARICA Model.” In Proceedings of the XVI International Scientific-expert Conference on Railways, Railcon, Niš, Serbia, 9–10 October, 89–92.
- Puška, A., I. Stojanović, A. Maksimović, and N. Osmanović. 2020. “Evaluation Software of Project Management Used Measurement of Alternatives and Ranking According to Compromise Solution (MARCOS) Method.” Operational Research in Engineering Sciences: Theory and Applications 3 (1): 89–102.
- Rajak, M., and K. Shaw. 2019. “Evaluation and Selection of Mobile Health (MHealth) Applications Using AHP and Fuzzy TOPSIS.” Technology in Society 59: 101186.
- Rani, P., A.R. Mishra, A. Mardani, F. Cavallaro, M. Alrasheedi, and A. Alrashidi. 2020. “A Novel Approach to Extended Fuzzy TOPSIS Based on new Divergence Measures for Renewable Energy Sources Selection.” Journal of Cleaner Production 257: 120352.
- Rani, P., A.R. Mishra, K.R. Pardasani, A. Mardani, H. Liao, and D. Streimikiene. 2019. “A Novel VIKOR Approach Based on Entropy and Divergence Measures of Pythagorean Fuzzy Sets to Evaluate Renewable Energy Technologies in India.” Journal of Cleaner Production 238: 117936.
- Saaty, T.L. 1980. The Analytic Hierarchy Process. New York: McGraw-Hill.
- Saaty, T.L., and L.T. Tran. 2007. “On the Invalidity of Fuzzifying Numerical Judgments in the Analytic Hierarchy Process.” Mathematical and Computer Modelling 46 (7-8): 962–975.
- Saracoglu, B.O. 2020. Location Selection Factors of Concentrated Solar Power Plant Investments. Sustainable Energy, Grids and Networks 22: 100319.
- Stanković, M., Ž Stević, D.K. Das, M. Subotić, and D. Pamučar. 2020. “A New Fuzzy MARCOS Method for Road Traffic Risk Analysis.” Mathematics 8 (3): 457.
- Stević, Ž, and N. Brković. 2020a. “A Novel Integrated FUCOM-MARCOS Model for Evaluation of Human Resources in a Transport Company.” Logistics 4 (1): 4.
- Stević, Ž, D. Pamučar, A. Puška, and P. Chatterjee. 2020b. “Sustainable Supplier Selection in Healthcare Industries Using a new MCDM Method: Measurement of Alternatives and Ranking According to COmpromise Solution (MARCOS).” Computers & Industrial Engineering 140: 106231.
- Şengül, Ü, M. Eren, S.E. Shiraz, V. Gezder, and A.B. Şengül. 2015. “Fuzzy TOPSIS Method for Ranking Renewable Energy Supply Systems in Turkey.” Renewable Energy 75: 617–625.
- Valodka, I., and G. Valodkienė. 2015. “The Impact of Renewable Energy on the Economy of Lithuania.” Procedia-Social and Behavioral Sciences 213: 123–128.
- Wang, S., H. Gangammanavar, S. Ekşioğlu, and S. J. Mason. 2019. “Statistical Estimation of Operating Reserve Requirements Using Rolling Horizon Stochastic Optimization.” Annals of Operations Research 292: 371–397.
- Wang, Y., L. Xu, and Y. A. Solangi. 2020. “Strategic Renewable Energy Resources Selection for Pakistan: Based on SWOT-Fuzzy AHP Approach.” Sustainable Cities and Society 52: 101861.
- Wang, J.J., and D. L. Yang. 2007. “Using a Hybrid Multi-Criteria Decision aid Method for Information Systems Outsourcing.” Computers & Operations Research 34 (12): 3691–3700.
- Yıldırım, H.H. 2019. “Yenilenebilir Enerji Yatırımlarındaki Teşviklerin Yatırım Performansları Üzerine Etkisi.” Finans Ekonomi ve Sosyal Araştırmalar Dergisi (FESA 4 (3): 330–345.
- Yuan, J., C. Li, W. Li, D. Liu, and X. Li. 2018. “Linguistic Hesitant Fuzzy Multi-Criterion Decision-Making for Renewable Energy: A Case Study in Jilin.” Journal of Cleaner Production 172: 3201–3214.
- Zeng, Y., W. Guo, H. Wang, and F. Zhang. 2020. “A two-Stage Evaluation and Optimization Method for Renewable Energy Development Based on Data Envelopment Analysis.” Applied Energy 262: 114363.
- Zeren, F., and H.T. Akkuş. 2020. “The Relationship Between Renewable Energy Consumption and Trade Openness: New Evidence from Emerging Economies.” Renewable Energy 147: 322–329.