
 ?Mathematical formulae have been encoded as MathML and are displayed in this HTML version using MathJax in order to improve their display. Uncheck the box to turn MathJax off. This feature requires Javascript. Click on a formula to zoom.
ABSTRACT
The effect of an increasing volume of the phase change material (PCM) and large heat transfer area have been assessed for controlling the higher surface temperature of the photovoltaic (PV) module which influences conversion efficiency and power output. For this, a bed of multi-cylindrical copper tubes filled with PCM has been prepared. The performance evaluation has been done on three different configurations such as module ‘B’ integrated with 91 tubes in the first configuration, module ‘C’ integrated with 181 in the second configuration and module ‘D’ integrated with 271 in the third configuration. The results obtained from three configurations are compared with the reference module (module A). All the tested panels are found to be better than the reference panel, but panel D is found to be the best configured among all tested panels, which showed the average per cent reduction of around 20.76% in the cell temperature and average per cent increment in 6.49% in conversion efficiency and 6.67% in power output.
Nomenclature
| PCM | = | Phase change material |
| TES | = | Thermal energy storage |
| LHS | = | Latent heat storage |
| Apm | = | Area of the photovoltaic module (m2) |
| has | = | Coefficient of heat transfer for the surrounding air (W/m2 K) |
| hbs-pv | = | Coefficient of convective heat transfer for the back surface of the tested PV panel (W/m2 K) |
| hpcm-t | = | Coefficient of convective heat transfer for the PCM infused tube (W/m2 K) |
| Tamb | = | Ambient temperature (°C) |
| Tbs | = | Back surface temperature of PV (°C) |
| TPCM | = | Temperature of PCM (°C) |
| Tsc | = | Temperature of solar cell surface (°C) |
| HPCM | = | Latent heat of PCM (J/kg) |
| MPCM | = | Mass of PCM (kg) |
| Csol | = | Specific heat of solid PCM (J/kg·K) |
| Cliq | = | Specific heat of solid PCM (J/kg·K) |
| ϵ | = | Emissivity factor |
| σ | = | Stefan–Boltzmann’s Constant (J/m2·s·K4) |
| αabs | = | Absorptive factor |
| ηce | = | Conversion efficiency (%) |
| Pmax | = | Power output (W) |
| Wv | = | Wind velocity (m/s) |
1. Introduction
Over the last few years, a significant number of reports/articles have been published, focusing on sustainable development by using renewable energy resources. In the current market of renewable energy technology an increase in the efficiency of the system (Saxena et al. Citation2011; Saxena, Agarwal, and Srivastava Citation2013) is observed as the simplest and inexpensive method to improve the feasibility of these applications at different locations of the world (Saxena and Srivastava Citation2013; Saxena and Deval Citation2016; Saxena and Norton Citation2021). For instance, cooling of the solar cell surface in PV systems under peak solar hours has exposed a visible potential in order to improve its performance in terms of efficiency and power output.
In previous literature two types of techniques for cooling of the solar cell have been identified as potential techniques to control the temperature practically such as active technique and passive technique (Krauter Citation2004; Furushima and Nawata Citation2006; Ceylan et al. Citation2014; Wu and Xiong Citation2014; Ebrahimi, Rahimi, and Rahimi Citation2015; Chandrasekar and Senthilkumar Citation2016; Sainthiya, Beniwal, and Garg Citation2018; Bahaidarah et al. Citation2013; Smith et al. Citation2014; Nizetic et al. Citation2016; Schiro et al. Citation2017; Wu, Chen, and Xiao Citation2018; Atkin and Farid Citation2015; Stropnik and Stritih Citation2016; Hachem et al. Citation2017; Waqasa and Ji Citation2017). summarise some of the research work carried out previously on thermal management of PV systems around the globe.
Table 1. PV surface cooling by water.
Table 2. PV surface cooling by phase change materials (PCM).
Table 3. PV surface cooling by natural convection techniques.
It is clear from Saxena and Norton (Citation2021), (Krauter (Citation2004), (Furushima and Nawata (Citation2006), Ceylan et al. (Citation2014), Wu and Xiong (Citation2014), Ebrahimi, Rahimi, and Rahimi (Citation2015) and Chandrasekar and Senthilkumar (Citation2016) that the efficiency of photovoltaic panels decreases as the panels’ temperature increases, which results in the deduction of electricity generation. In order to reduce this effect, different cooling methods have been proposed and investigated (). The present paper reviews the previous work on cooling PV cells and concludes that cost-effectiveness, design feasibility and minimal energy consumption are the important design consideration for cooling systems. Based on these considerations, this paper reports a passive cooling method that utilises PCM properties along with extended fins principles for effective cooling of the PV system. The present heat sink is found to be better comparatively with other designs () which are complicated in design, therefore need much space for installation and also require a pump which increases the overall cost of the system. Another foremost issue is the replacement of the PCM which is not easy in most systems (if required) while the present heat sink is easy to maintain, less space required, no pumping cost and easy replacement of PCM through fins and lastly much-improved performance of the PV panel.
Apart from this, it has been noticed from the available literature on solar thermal systems that the latent heat storage (LHS) materials are progressive in recent years to be used as potential techniques for thermal energy storage for efficient enhancement (Saxena et al. Citation2011; Saxena, Agarwal, and Srivastava Citation2013; Saxena and Srivastava Citation2013; Saxena and Deval Citation2016; Saxena and Norton Citation2021) especially in solar energy systems (Agyenim et al. Citation2010).
TES materials have been used in photovoltaic systems owing to the excellent TES capacity. Buddhi et al. (Citation1988) carried out some experiments on different TES materials. Among all TES materials tested for performance enhancement paraffin was found to be the most economic and efficient TES material for solar applications. Chandel and Agarwal (Citation2017) studied the various cooling techniques applied to PV for performance enhancement. Results show that PCM is a cost-effective solution for controlling PV temperature and besides this a melting point around 30°C or more is capable to sustain a constant temperature of the PV panel which results in improved panel efficiency.
References (Chandrasekar and Senthilkumar Citation2016; Sainthiya, Beniwal, and Garg Citation2018; Bahaidarah et al. Citation2013; Smith et al. Citation2014; Nizetic et al. Citation2016; Schiro et al. Citation2017; Wu, Chen, and Xiao Citation2018; Atkin and Farid Citation2015; Stropnik and Stritih Citation2016; Hachem et al. Citation2017; Waqasa and Ji Citation2017) show that paraffin wax is not only a simple material but also economically energy storage material for solar electrical/thermal applications. In paraffin wax, solar energy is stored through a phase change in the TES material through two common thermal processes such as melting and freezing. In melting, the heat is stored as latent heat of fusion and in freezing this heat is liberated. A lot of research has been carried out on the suitability of different compounds of paraffin especially on wax as an LHS for solar energy systems (He and Setterwall Citation2002; Silakhori et al. Citation2013; Saxena, Agarwal, and Cuce Citation2020; Kyriaki et al. Citation2017; Kousksou et al. Citation2010). The wax has been found to improve much better the overall performance of improved heat transfer, system efficiency, power output, heat storage capacity, durability and life cycle of the solar applications. Due to this reason, a common compound of paraffin wax (RT-28HC) has been considered in the present work as a capacitive TES material (). Apart from this, it is essential to retain the operative temperature as low as conceivable to improve the efficiency of a PV system (rather at the level of STC or 25°C) and in Moradabad city, Tamb at 6:00 h mainly in the months of May and June is about 26–27°C. Therefore, PCM is selected for a melting point of about 27°C which starts to absorb the heat of the PV panel from early in the morning to the long hours of noon (daily).
2. Materials and methods
2.1. Experimental set-up
In the present article, efforts have been made to observe the effect of cylindrical copper tubes encapsulated with PCM on the thermal response of a solar PV module for better performance. For this, a special bracket of galvanised iron has been designed to support the copper tubes attached to the backside of PV. The area of the bracket (1.5 m × 0.75 m) is slightly less than the area of the PV back surface (1.58 m × 0.81 m) so that it can be attached properly to the backside or PV can be easily fitted above it. To develop the PCM cooling mechanism, a total of three thin flat sheets (thickness = 0.8 mm) of cooper are taken for the specific dimension of 1.57 m × 0.27 m. On these sheets, copper tubes of 1.8 cm diameter and 15 cm length are vertically positioned and soldered ((a)) to behave like a pin fin heat sink. Copper material has been taken because of good thermal conductivity (386 W/m-°C) and specific heat (380 J/kg-°C). The one end is completely closed through soldering while the other end is opened to be encapsulated by PCM ((b)).
Figure 1. (a) PCM tubes in vertical positioned on copper sheet (heat sink) and (b) copper tube sealing arrangement.
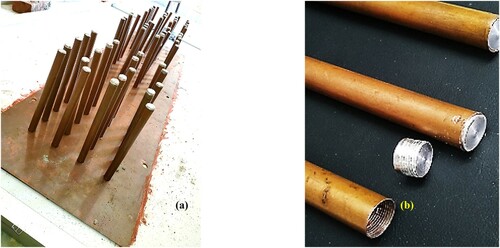
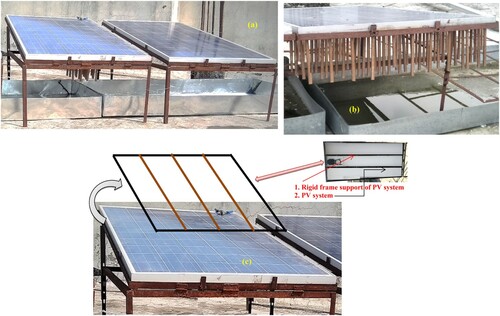
After filling the PCM, the other end is closed (or fully sealed) through an aluminium nut with the principle of nut and bolt ((b)) to avoid any kind of leakage. These PCM containing tubes are placed on equidistance (4.4 cm from all sides) from all four sides over the thin sheet of copper to prepare the PCM-based pin fin heat sink. These copper tubes have been filled with 90% of PCM to avoid leakage/damage due to thermal expansion of the PCM under higher temperatures. Now, the sheet integrated with the encapsulated tubes has been placed at the mid centre of the designed bracket (). A thin layer of thermal conductive glue (Silcotherm™: thermal conductivity 3.1 W/m·K, density 2.91 g/cm3, thermal resistance 24 mm2·K/W, minimum working temperature (−50°C), maximum working temperature (200°C) and type-paste) is pasted over the sheet and then it has been attached to the backside of PV (). The rigid bracket provides strength to the sheet carrying tubes which results in conformance of no air gap between the new designed bracket and the backside of PV, which results in better heat transfer from the backside of the panel through the tubes. A flexible stand ((c)) has been designed in such a manner that the PV panel can be easily placed on it at the inclination angle of 43° (Saxena, Agarwal, and Srivastava Citation2013; Elshafei Citation2010) from the horizontal plane.
Figure 2. Experimental set-up of a 91 PCM-encapsulated tubes (pin fin heat sink).

Figure 3. PCM cooling of PV at the backside by (a) 271 pin fin heat sink (b) 181 pin fin heat sink (c) 91 pin fin heat sink.
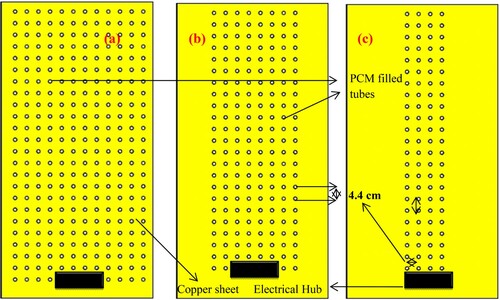
Figure 4. (a) Experimental set-up of PV cooling with 91 PCM-encapsulated tubes (b) with 271 PCM-infused fins (c) special designed flexible PV stand.
All the investigations have been carried out on the actual ambient conditions of Moradabad city (28.83°N and 78.78°E) of India. Total four same specifications solar panels of 180 Wp manufactured by CEL, Sahibabad, India, have been installed at MIT, Moradabad, for conducting experiments. From these solar panels, three configurations have been developed, consisting of different numbers of PCM-encapsulated tubes for performance enhancement evaluation.
The fourth panel is reference panel A, which has been tested simultaneously with panels B, C and D for comparison of results in the following manner;
First configuration: In the first configuration, reference panels A and B (panel with 91 PCM-encapsulated tubes) have been tested on 19 June 2019 from 06:00 to 18:00 h.
Second configuration: In the second configuration, reference panels A and C (panel with 181 PCM-encapsulated tubes) have been tested on 20 June 2019 from 06:00 to 18:00 h.
Third configuration: In this, reference panels A and D (panel with 271 PCM-encapsulated tubes) have been tested on 21 June 2019 from 06:00 to 18:00 h.
It is notable that in each configuration there is an additional tube (i.e. 90 + 1 = 91, 180 + 1 = 181 and 270 + 1 = 271) which carried a 0.6 mm drilled hole below 03 cm distance from the top edge (which is connected to the copper sheet) to measure the temperature of filled PCM inside the tube through a thermocouple sensor (). The location of additional tubes is shown in . At these points, where additional tubes are located, Tbs has its minimum value with respect to other points, which confirmed the melting of PCM inside all tubes. These tubes, attached at the backside of the PV panel, acted as a pin fin heat sink for the individual PV system.
Figure 5. Heat transfer mechanism of the pin fin heat sink.
Specifications of the PV module and tested PCM are given in and , respectively. Readings of the experiments have been taken for an interval of 30 min in all the configurations and discussed for an interval of 01 h in graphical presentation. To measure the temperature variations at the various points of set-up, a 12 point K type copper constantan thermocouple sensor with an accuracy of ±2.2°C (±0.75%) has been used due to its better sensitivity. To record the velocity of wind around the testing place an anemometer (model-WD9819) has been used with an accuracy of ±3%. A potential solarimeter ‘Surya-mapi’ (CEL™-201 and range = 0–1200 W/m2) with an accuracy of ±1 W/m2 has been used to measure solar radiation. A sensitive weigh balance (linearity ± 0.2 mg) has been used for measuring the quantity of tested PCM and a commercial multi-meter of EXTECH™ (model-EX410A) with an accuracy of ±0.5% has been used to measure the output of the PV panel.
Table 4. Specifications of installed PV.
Table 5. Properties of tested PCM.
2.2. Data analysis
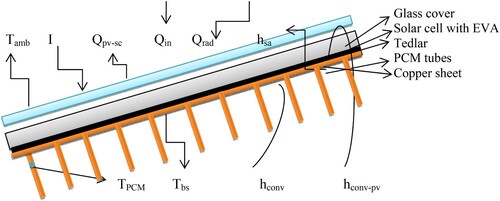
A comparative assessment of the experimental study of three different configured (but of the same specifications) multi-crystalline panels of 180 Wp has been carried out. Experiments on all three configurations have been carried out simultaneously with the same specifications’ reference panel for result comparison on consecutive days. In all configurations, reference panel ‘A’ got cooled naturally by surrounding air while the rest of the panels B, C and D got cooled by operating the system on different numbers of PCM-encapsulated tubes (). It has been observed the heat accumulated at the backside of the solar panel is transmitted to the PCM-encapsulated tube through conductive heat transfer where the PCM absorbs the heat and undergoes a solid to liquid phase conversion and stored a significant amount of waste heat from PV (). The energy balance for the heat transfer can be shown by assuming that (i) the coefficient of heat transfer remains the same for the duration of the entire over the experimental settings, (ii) solar radiation is uniformly distributed on the PV module and (iii) natural convection heat transfer occurs at both sides of the module;
(1)
(1)
The net energy input to the system is the product of time duration/frame of the experimental study (Δt) and net received solar power (Qin). According to the PV test standard conditions (STC), manufacturers of solar PV panels establish to the extent their products efficiency is about 15–16% for a typical standard silicon single P–N junction (Ingersoll Citation1986; Tiwari and Dubey Citation2010). Here, the Qpv is taken to be 16% of total energy (Qin × Δt) and the remainder (waste heat) has been absorbed through the PV panel (Ingersoll Citation1986). The value of solar power (Qin) can also be expressed as (Duffie and Beckman Citation2013)
(2)
(2)
The heat transfer through the radiation and convection provides the surrounding heat loss mechanisms as well as it acts like cooling resource for reference panel A, therefore;
(3)
(3)
(4)
(4)
Besides this, the remainder waste heat is assumed to be completely absorbed through the PCM-encapsulated tubes through heat transfer. In panels B, C and D, the solid to liquid phase change has been followed when the Tpcm reaches its melting point (Tmelt). During this phase change of the PCM, the temperature remains constant and the heat is captivated as latent heat of fusion. The values are different from the specific heat for both the states i.e. solid and liquid and have a significance effect on the increase of Tpcm. Therefore, the heat transfer mode can be expressed as follows:
For the solid phase:
(5)
(5)
For solid to liquid phases:
(6)
(6)
For the liquid phase:
(7)
(7)
2.3. Thermal response of the PCM tube
The net energy transferred () from the heated back surface of PV to the heat sink (tube network) by both components i.e. convection (
) and the radiation (
) therefore (Elshafei Citation2010) is
(8)
(8)
While the rate of heat exchanged is the difference of net input to the heat sink and conductive losses from the panels back surface; therefore,
(9)
(9)
By ignoring the conductive heat losses, the radiative component can be obtained by (Elshafei Citation2010)
(10)
(10) where Ahs = area of the heat sink (total PCM tubes area + area of the copper sheet attached to the back surface of PV), Tms is the mean temperature of the heat sink, Asur·w is the area of surrounding small walls and the value of
is 0.15 for the heat sink (Joo and Kim Citation2015).
Now by putting the value of in Equation (8), the rate of convective heat transfer in steady state can be obtained through
(11)
(11)
Now, by introducing the overall tube efficiency () in Equation (11) and assuming that
, Equation (11) becomes
(12)
(12)
Now, the overall tube efficiency () can be obtained through
(13)
(13)
Besides this, the average heat transfer coefficient through convection depended on the total surface area for heat transfer can be obtained as (Elshafei Citation2010; Joo and Kim Citation2015)
(14)
(14)
And the thermal resistance (Rth) can also be evaluated by using the following equation (Joo and Kim Citation2015):
(15)
(15)
In Equation (15), the PCM-encapsulated tube cum fin efficiency can be calculated by
(16)
(16) where H is the height of the copper tube and D is its diameter.
For a detailed analysis, one can go through the work of Amr et al. (Citation2019) and Bayrak, Oztop, and Selimefendigil (Citation2019). Both the authors have discussed the energy balance equations with a detailed model for PV panels without extended fins and with ‘n’ numbers of fins surrounded by PCM.
2.4. Power generation
The electrical yield of the solar module (Pmax) can be estimated through Equation (17) if the conversion efficiency of the PV is given as
(17)
(17)
It has been noticed experimentally that as the surface temperature of the cell is increased, the cell conversion efficiency (ƞconv) is decreased (Ingersoll Citation1986). Therefore, the relationship between the temperature rise and ƞconv drop can be designated through Equation (18) (Amr et al. Citation2019)
(18)
(18) where
are the conversion efficiency, coefficient of temperature and the cell surface temperature of the reference panel at the standard test condition (STC), while Tpv is the actual temperature of the tested solar panel.
3. Result and discussion
In the present work, the thermal performance evaluation of the 180 Wp solar PV module has been carried out by operating with different configurations of PCM-encapsulated tubes which are attached at the backside of the panel through a flat copper sheet to be worked as a pin fin heat sink (Joo and Kim Citation2015). The concept of using the PCM-encapsulated tubes is to produce the fin effect which is highly favourable for a better convective heat transfer (commonly approached in solar air heaters; Saxena, Varun, and El-Sebaii Citation2015) from the backside of the solar module mainly after the complete melting of PCM inside the tube (Duffie and Beckman Citation2013). It captivates and releases a large amount of latent heat during its phase change state at a constant temperature. Here, only the thermal behaviour of the solar panel has been investigated by using PCM tubes heat sink. Conversion efficiency (ƞconv) of the panel and power output (Pmax) are the two major characteristics of the present work which have been experimentally studied under the peak solar hours.
Testing has been carried out on three consecutive days of the month June 2019 at MIT, Moradabad (India). All the readings have been discussed for an interval of 1 h from 06:00 h in the morning to 18:00 h in the evening. In all configurations, the reference panel (A) had been cooled via natural cooling while the other panels B, C and D have got cooled under passive type cooling through the PCM. All the instruments have been well checked for proper functioning and error-free mode before starting the experiments. Wind velocity has been observed to be varied between 1.0 and 1.2 m/s therefore it has been considered for a fixed value of 1.1 m/s in experiments.
3.1. PV module testing on the first configuration
In this configuration, reference panels A and panel B with 91 PCM-encapsulated tubes have been experimentally studied simultaneously for performance enhancement (). The experiments have been conducted from the morning (6:00 h) to the evening (18:00 h) on the first day i.e. 19 June 2019. Readings have been taken to measure the temperature variations in Tamb, Tsc-A, Tsc-B and Tpcm to calculate the conversion efficiency and power yield of both panels A and B.
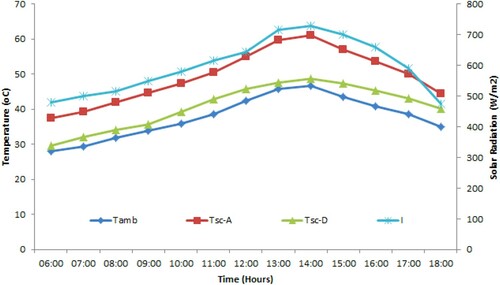
Experiments have been started around 6:00 h when the Tamb is notified as 26.9°C and irradiance ‘I’ is noted to be 475 W/m2. The surface temperature of both the panels is almost the same before experimentation. After starting the experiments Tsc-A is found to rise swiftly in comparison to Tsc-B. The value of Tsc of both the panels is found to be normally varied coinciding with solar radiation ‘I’. Increasing from an almost identical value with Tamb in the morning, it extended to its highest value in solar noon and then decreased with respect to the dropping of the Tamb and solar radiation. The maximum value of Tsc-A and Tsc-B is found to be 58.93°C and 53.9°C around the 13:05 h, respectively ().
Figure 6. Temperature variations for panels A and B.
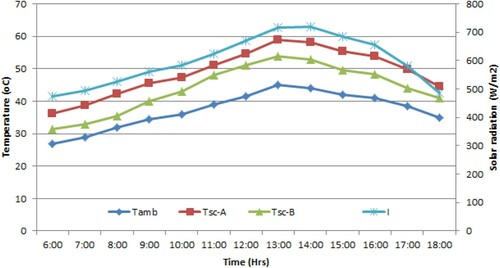
In panel B, the phase change effect has been noticed from 08:00 to 10:30 h. The PCM inside the tube is found to be completely melted around 10:30 h and the TPCM is notified around 40°C at this time. During the experiments, Tsc-A is observed to be higher than Tsc-B at all times due to the PCM cooling. During the phase change effect, the Tsc-B is found to be much cooler than Tsc-A. Notably, the PCM-encapsulated tubes of copper act like extended fins on the flat plate which improves the heat transfer from the back surface of PV to the PCM-encapsulated tubes (Joo and Kim Citation2015). PCM inside the tubes absorbed the heat energy from the back surface of panel B and due to this the value of Tsc-B has not been found moreover it is 53.9°C throughout the day. It is also notable that the surrounding air carries the stored heat from the tubes’ external surface to the environment and helps the system to get cool more efficiently in comparison to panel A.
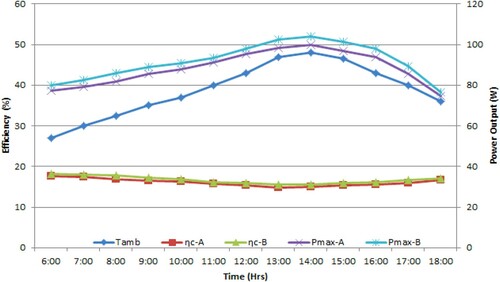
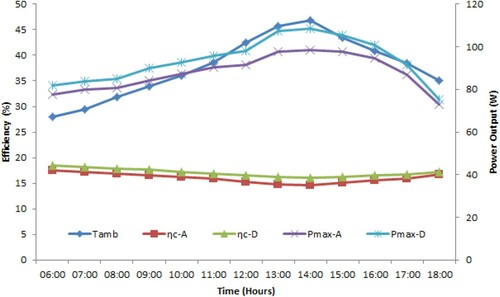
During the testing, a significant effect has been noticed on Tsc-A and Tsc-B due to variations in Tamb and I (W/m2). The average temperature reduction has been found to be 11.23% in panel B by using PCM cooling. The maximum value of ηce-A and ηce-B has been found to be 17.64% and 18.21%, respectively (). The average percentage efficiency enhancement has been found to be 3.73% for panel B under PCM cooling on the first configuration. The maximum value of Pmax-A and Pmax-B has been found to be 99.66 and 103.91 W, respectively. The average percentage power yield improvement has been found to be 3.76% for panel B on the first configuration.
Figure 7. Variations in efficiency and power output for panels A and B.
3.2. PV module testing on second configuration
In this configuration, reference panels A and panel C with 181 PCM-encapsulated tubes have been experimentally studied simultaneously for performance improvement under the climatic conditions of Moradabad city, India.
Experiments have been started around 6:00 h and the Tamb is notified to be around 27°C and irradiance ‘I’ is observed to be 470 W/m2. The surface temperature of both the panels (A and C) is almost the same before testing. After starting the experiments Tsc-A has been again noticed to rise expeditiously in comparison to Tsc-C. The maximum value of Tsc-A and Tsc-c has been observed to be 59.13°C and 48.7°C around the 13:02 h, respectively (). In panel C, the phase change effect has been noticed from 08:10 to 10:45 h. The PCM inside the tube is found to be completely melted around 10:46 h and the TPCM is notified around 45.8°C at this time. During the experiments, Tsc-A is observed to be higher than Tsc-C due to the PCM cooling. During the phase change effect, the Tsc-C is also found to be much cooler (like Tsc-B) than Tsc-A. The value of Tsc-C has not been found more than 48.71°C throughout the day.
Figure 8. Temperature variations for panels A and C.
During the experimental testing, a significant effect has been noticed on Tsc-A and Tsc-c due to variations in Tamb and I (W/m2) as in previous configuration testing. The average temperature reduction has been found to be 17.6% in panel C by using PCM cooling which is more than panels A and B because the quantity of PCM has been increased in comparison to 91 PCM-encapsulated tubes (more the amount of PCM in the heat sink, more the amount of heat energy absorbed). As well as the large contact area of the surface that improved the heat transfer. The maximum value of ηce-A and ηce-C has been found to be 17.63% and 18.27%, respectively (). The average percentage efficiency enhancement has been found to be 5.97% for panel C under PCM cooling on 181 PCM-encapsulated copper tubes. The maximum value of Pmax-A and Pmax-B has been found to be 99.48 and 108.14 W, respectively. The average percentage power yield improvement has been found to be 5.79% for the panel C on the second configuration. and show the significance of the amount of PCM used on the performance of panel C which is better over the panels A and B.
Figure 9. Variations in efficiency and power output for panels A and C.
3.3. PV module testing on the third configuration
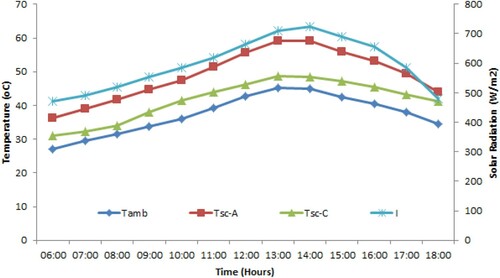
In this last configuration, the reference panels A and panel D with 271 PCM-encapsulated tubes have been experimentally studied simultaneously for performance improvement at the same location.
An experimental study has been carried out from 6:00 h in the morning and the Tamb is notified around 28°C and irradiance ‘I’ is observed to be 480 W/m2. The surface temperature of both the panels (A and D) is almost the same before conducting the tests. After starting the experiments, Tsc-A has been noticed to rise expeditiously along with the increase of Tamb and ‘I’ in comparison of Tsc-D. The maximum value of Tsc-A and Tsc-D is observed to be 61.02°C and 48.8°C around 14:01 h, respectively (). In panel D, the phase change effect has been noticed from 08:20 to 11:00 h. The PCM inside the tube is found to be completely melted around 11:00 h and the TPCM is notified around 46.9°C at this time. During the experiments, Tsc-A is observed to be higher than Tsc-D due to the PCM cooling through 271 PCM-encapsulated copper tubes attached at the back surface of panel D. During the phase change effect, the Tsc-C is also found to be much cooler (alike Tsc-C and Tsc-B) than Tsc-A. The value of Tsc-D has not been found moreover it is 48.8°C throughout the day.
Figure 10. Temperature variations for panels A and D.
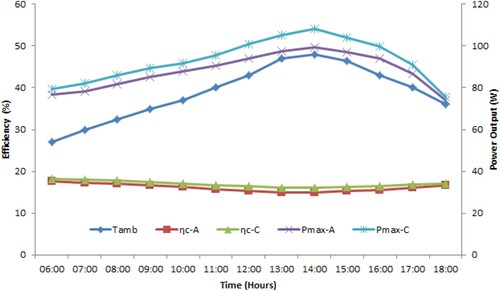
During the experiments, besides the significant effect of ambient conditions on Tsc-A and Tsc-D, the effect of PCM quantity with increasing numbers of encapsulated tubes used for cooling has been marked clearly on the performance of new panel D along with a large surface area contact. The average surface temperature reduction has been found to be 20.76% in panel D by using PCM cooling which is more than panels A, B and C because the quantity of PCM has been increased with increasing numbers of encapsulated tubes which absorbed more heat energy from the back surface of panel D in comparison of 91 and 181 PCM-encapsulated tubes and provided better conductive and convective heat transfer due to contact in a large-sized heat sink. The maximum value of ηce-A and ηce-D is found to be 17.48% and 18.44%, respectively (). The average percentage efficiency enhancement is found to be 6.49% for panel D under PCM cooling on 271 PCM-encapsulated copper tubes. The maximum value of Pmax-A and Pmax-D has been found to be 98.61 and 108.71 W, respectively. The average percentage power yield improvement is found to be 6.67% for panel D on the third configuration. and show the significance of the amount of PCM used on the performance of panel D which is better compared to panels A, B and C.
Figure 11. Variations in efficiency and power output for panels A and D.
In the present article, the PCM infused cylindrical tubes have been used for cooling of a solar panel which acted as an air-cooled pin fin heat sink at the backside of PV. It can be seen from and that the tubes have been arranged in such a manner that the possible airflow maintained through the tubes network from all the sides without blocking the air. It is remarkable that the convection heat coefficient on the PCM tube cannot be possibly defined accurately without direct airflow analysis and air temperature around exactly the tube position. Therefore considering the model (Grubisic-Cabo et al. Citation2018) for a wind speed around 1.1 m/s on the location of experiments, the mean convective heat transfer coefficient is found around 5.21 W/m2 K. shows the results of all the tested configurations on different days for a better understanding of output results.
Figure 12. Efficiency and power output of panels B, C and D on different days (19, 20, and 21 June 2019).
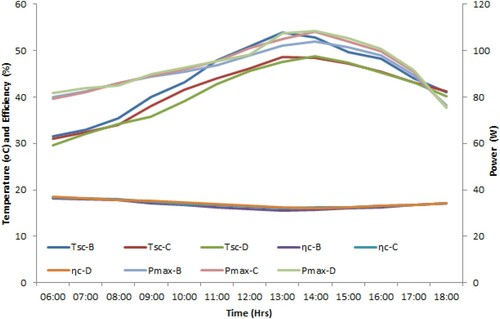
About the overall performance of the panels operated on different configurations the third configuration is found the best among all. These tubes have a greater influence on the solidification process of the tested PCM than that of melting progression. Apart from this, thermal response of the panels B, C and D is found to be improved with enhancement in design of the attached mechanism.
The convective heat transfer takes place from a large surface area by increasing the number of PCM filled tubes in each new configuration which not only helps to cool down the Tpcm towards the solidification but reduces the back surface temperature of the PV panel and results in improved conversion efficiency and power yield ().
Table 6. Results of different configurations of PV panel cooling through PCM-encapsulated copper tubes.
4. Economic analysis
The development of the cost-competitiveness of a PV system ended the years endures to initiate its interestas a worthwhile power generation alternate in the worldwide energy mix. In 2014, values of PV modules reduced about 75% in comparison with their prices in 2009 and as a consequence, refining the PV system plug parity. The total cost of the present project is shown in .
Table 7. Costs of different items of PV system.
Significant measures used in the economic assessment of a PV system considered in the present work are as follows.
4.1. Net present value (NPV)
The NPV is an economic tool that is used to assess cash outflows and incomes (revenues), and asset characteristics and choices especially for associating commonly exclusive projects. It is an algebraic sum of the net cash flows (CFm) until the end of the project’s life cycle to the present, reduced by an applicable annual discount rate (r). It can be estimated as (Saxena and Srivastava Citation2012)
(19)
(19) where N is the analysis period.
Assumptions and facts:
01 year electricity savings (kWh) is 1825 rupees ($24.25)
Electricity (kWh) price in our locations in 6.50 rupees
Total cost of the system is about 10,000/- rupees
Future value discount rate is about 20%
Annual output degradation (linear) – 0.5%
Electricity inflation price rate is about 1%.
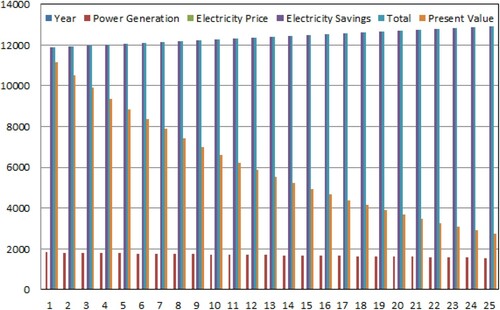
From Equation (19) the NPV for 25 years is about 14,190 INR or $188.58 and for the present PV system the NPV is shown in .
Figure 13. NPV of the present PV system for 25 years.
4.2. Life cycle cost (LCC)
LCC is a tool to estimate the inclusive cost of the project counting initial costs (CI), fuel costs, operating cost and maintenance costs (COMR), replacement (Crepl) or repair costs, discarded or resale values (Cdisc), the other finance charges (if any) and other costs (COC) (Duffie and Beckman Citation2013).
LCC can be estimated as
(20)
(20) = 12,266 INR or $163 (for one panel).
4.3. Payback period (PBP)
PBP is fundamentally the number of years obligatory to recuperate the initial investment. The small PBP is extremely desirable due to wealth gains that will be obtainable first and will decrease the risk of asset. PBP can simply be estimated as (Duffie and Beckman Citation2013)
(21)
(21) = 10,000/1825 = 5.47 years.
5. Uncertainty analysis
The uncertainties in some measured performance indicators have been obtained from the errors of the measuring instruments used in the experiments indicated in Section 2 and it has been calculated with the help of the following equations (Soliman, Hassan, and Ookawara Citation2019):
For a mean value (x)
(22)
(22)
For the standard deviation (σ)
(23)
(23)
Now, to compute the experimental uncertainty equation (22) is divided by Equation (23) and the following is obtained:
(24)
(24)
The uncertainty in solar radiation (I − W/m2) has been found to be ±1.1% while that of ambient temperature (Tamb − °C) and the panel temperature (Tsc − °C) have been found around ±1.5% and ±2.1%, respectively. Uncertainty for the conversion efficiency (ηce − %) and the power output (Pmax − W) has been found to be ±1.81% and 2.01±, respectively during the experiments.
6. Conclusion
In the present work a special bracket stand of galvanised iron has been designed through which multi cylindrical copper tubes encapsulated with PCM (melting point 27–29°C) have been attached at the backside of the PV system for controlling of the surface temperature. Experiments have been conducted on three different configurations of PCM tubes such as on 91 tubes (panel B), 181 tubes (panel C) and 271 tubes (panel D). Overall, the results can be concluded as
Panel B with 91 PCM-encapsulated tubes is found to be better over reference panel A for the average per cent reduction about11.23% in the cell temperature and average per cent increment of 3.73% in the conversion efficiency and about 3.76% in the power output through experimentally testing under the same climatic conditions.
Panel C with 181 PCM-encapsulated tubes has been found better over panel A for the average per cent reduction of about 17.6% in the cell temperature, 5.97% in the conversion efficiency and 5.79% in the power output. This panel C is found to be better over panel B for the average per cent reduction of about 5.3% in the cell temperature, 1.74% in the conversion efficiency and 1.53% in the power output. The variations in these values of performance parameters are directly subjected to the ambient conditions because both the panels have been tested on different ambient conditions.
Panel D with 271 PCM-encapsulated tubes is found out to be the best configured which showed the average per cent reduction about 20.76% in the cell temperature, 6.49% in the conversion efficiency and 6.67% in the power output in comparison of the reference panel A. In a comparison of panels B and C, the average per cent reduction is obtained to be about 7.51% and 5.6% in the cell temperature, 2.3% and 0.54% in the conversion efficiency and 2.11% and 0.57% in the power output, respectively. It is notable that panels B and C have been tested on different ambient conditions.
7. Future work
The typical thermal characteristics of PCM used in cylindrical tubes can be further investigated for the charging and discharging processes.
The design optimisation of the novel bracket stand with fin geometry will result in a much better way.
The heat transfer characteristics and angle of tubes can be studied for accurate results.
The effects of wind velocity on the cooling of PV panel especially from the back surface integrated with PCM tubes.
Failure analysis of PV under the high tensile load of thermal attachment.
Acknowledgements
The valuable support of Dr Abhishek Saxena (Co-PI of this project) is highly appreciable.
Disclosure statement
No potential conflict of interest was reported by the author(s).
Additional information
Funding
References
- Agyenim, F., N. Hewitt, P. Eames, and M. Smyth. 2010. “A Review of Materials, Heat Transfer and Phase Change Problem Formulation for Latent Heat Thermal Energy Storage Systems (LHTESS).” Renewable and Sustainable Energy Reviews 14: 615–628.
- Akbarzadeh, A., and T. Wadowski. 1996. “Heat Pipe-Based Cooling Systems for Photovoltaic Cells Under Concentrated Solar Radiation.” Applied Thermal Engineering 16: 81–87.
- Ali, M., M. H. Iqbal, N. A. Sheikh, H. M. Ali, M. S. Manzoor, M. M. Khan, and K. F. Tamrin. 2017. “Performance Investigation of Air Velocity Effects on PV Modules Under Controlled Conditions.” International Journal of Photoenergy, 1–10, Article ID 3829671.
- Amr, A. A., A. A. M. Hassan, M. Abdel-Salam, and A. M. El-Sayed. 2019. “Enhancement of Photovoltaic System Performance via Passive Cooling: Theory Versus Experiment.” Renewable Energy 140: 88–103.
- Atkin, P., and M. M. Farid. 2015. “Improving the Efficiency of Photovoltaic Cells Using PCM Infused Graphite and Aluminium Fins.” Solar Energy 114: 217–228.
- Bahaidarah, H., A. Subhan, P. Gandhidasan, and S. Rehman. 2013. “Performance Evaluation of a PV (Photovoltaic) Module by Back Surface Water Cooling for Hot Climatic Conditions.” Energy 59: 445–453.
- Bayrak, F., H. F. Oztop, and F. Selimefendigil. 2019. “Effects of Different fin Parameters and Efficiency for Cooling of PV Panels Under Natural Convection.” Solar Energy 188: 484–494.
- Buddhi, D., N. K. Bansal, R. L. Sawhney, and M. S. Sodha. 1988. “Solar Thermal Storage Systems Using Phase Change, Materials.” International Journal of Energy Research 12: 547–555.
- Ceylan, I., A. Gurel, H. Demircan, and B. Aksu. 2014. “Cooling of a Photovoltaic Module with Temperature Controlled Solar Collector.” Energy and Buildings 72: 96–101.
- Chandel, S. S., and T. Agarwal. 2017. “Review of Cooling Techniques Using Phase Change Materials for Enhancing Efficiency of Photovoltaic Power Systems.” Renewable and Sustainable Energy Reviews 73: 1342–1351.
- Chandrasekar, M., and T. Senthilkumar. 2016. “Passive Thermal Regulation of flat PV Modules by Coupling the Mechanisms of Evaporative and fin Cooling.” Heat and Mass Transfer 52: 1381–1391.
- Choubineh, N., H. Jannesari, and A. Kasaeian. 2019. “Experimental Study of the Effect of Using Phase Change Materials on the Performance of an Air-Cooled Photovoltaic System.” Renewable and Sustainable Energy Reviews 101: 103–111.
- Darkwa, J., J. Calautit, D. Du, and G. Kokogianakis. 2019. “A Numerical and Experimental Analysis of an Integrated TEG-PCM Power Enhancement System for Photovoltaic Cells.” Applied Energy 248: 688–701.
- Deaver, F. K., and M. W. Edenburn. 1983. “Passive Cooling Measurements for a Concentrating, Photovoltaic Array.” ASME Journal of Solar Energy Engineering 150: 413–417.
- Do, K. H., T. H. Kim, Y. Han, B. Choi, and M. Kim. 2012. “General Correlation of a Natural Convective Heat Sink with Plate-Fins for High Concentrating Photovoltaic Module Cooling.” Solar Energy 86: 2725–2734.
- Duffie, J. A., and W. A. Beckman. 2013. Solar Engineering of Thermal Process. Wiley, U.S.A.
- Ebrahimi, M., M. Rahimi, and A. Rahimi. 2015. “An Experimental Study on Using Natural Vaporization for Cooling of a Photovoltaic Solar Cell.” International Communications in Heat and Mass Transfer 65: 22–30.
- Elshafei, E. A. M. 2010. “Natural Convection Heat Transfer from a Heat Sink with Hollow/Perforated Circular Pins.” Energy 35: 2870–2877.
- Furushima, K., and Y. Nawata. 2006. “Performance Evaluation of Photovoltaic Power-Generation System Equipped with a Cooling Device Utilizing Siphonage.” ASME Journal of Solar Energy Engineering 128: 146–151.
- Grubisic-Cabo, F., S. Nizetic, D. Coko, I. M. Kragic, and A. Papadopoulos. 2018. “Experimental Investigation of the Passive Cooled Free-Standing Photovoltaic Panel with Fixed Aluminum Fins on the Backside Surface.” Journal of Cleaner Production 176: 119–129.
- Hachem, F., B. Abdulhay, M. Ramadan, H. El-Hage, M. G. El-Rab, and M. Khaled. 2017. “Improving the Performance of Photovoltaic Cells Using Pure and Combined Phase Change Materials e Experiments and Transient, Energy Balance.” Renewable Energy 107: 567–575.
- He, B., and F. Setterwall. 2002. “Technical Grade Paraffin Waxes as Phase Change Materials for Cool Thermal Storage and Cool Storage Systems Capital Cost Estimation.” Energy Conversion and Management 43: 1709–1723.
- Ingersoll, J. G. 1986. “Simplified Calculation of Solar Cell Temperatures in Terrestrial Photovoltaic Arrays.” ASME Journal of Solar Energy Engineering 108 (2): 95–101.
- Joo, Y., and S. J. Kim. 2015. “Comparison of Thermal Performance Between Plate-Fin and Pin Fin Heat Sink in Natural Convection.” International Journal of Heat and Mass Transfer 83: 345–356.
- Khanna, S., K. S. Reddy, and T. K. Mallick. 2018. “Optimization of Finned Solar Photovoltaic Phase Change Material (Finned Pv-pcm) System.” International Journal of Thermal Sciences 130: 313–322.
- Kousksou, T., A. Jamil, T. El Rhafiki, and Y. Zeraouli. 2010. “Paraffin Wax Mixtures as Phase Change Materials.” Solar Energy Materials & Solar Cells 94: 2158–2165.
- Krauter, S. 2004. “Increased Electrical Yield via Water Flow over the Front of Photovoltaic Panels.” Solar Energy Materials & Solar Cells 82: 131–137.
- Kyriaki, E., C. Konstantinidou, E. Giama, and A. M. Papadopoulos. 2017. “Life Cycle Analysis (LCA) and Life Cycle Cost Analysis (LCCA) of Phase Change Materials (PCM) for Thermal Applications: A Review.” International Journal of Energy Research 42:, 3068–3077.
- Nada, S. A., and D. H. El-Nagar. 2018. “Possibility of Using PCMs in Temperature Control and Performance Enhancements of Free Stand and Building Integrated PV Modules.” Renewable Energy 127: 630-641.
- Nada, S. A., D. H. El-Nagar, and H. M. S. Hussein. 2018. “Improving the Thermal Regulation and Efficiency Enhancement of PCM Integrated PV Modules Using Nano Particles.” Energy Conversion and Management 166: 735–743.
- Nasef, H. A., S. A. Nada, and H. Hassan. 2019. “Integrative Passive and Active Cooling System Using PCM and Nanofluid for Thermal Regulation of Concentrated Photovoltaic Solar Cells.” Energy Conversion and Management 199: 112065.
- Nizetic, S., M. Arıcı, Feyza Bilgin, and F. Grubisic-Cabo. 2018. “Investigation of Pork fat as Potential Novel Phase Change Material for Passive Cooling Applications in Photovoltaics.” Journal of Cleaner Production 170: 1006–1016.
- Nizetic, S., D. Coko, A. Yadav, and F. Grubišić-Čabo. 2016. “Water Spray Cooling Technique Applied on a Photovoltaic Panel: The Performance Response.” Energy Conversion and Management 108: 287–296.
- Popovici, C. G., S. V. Hudișteanu, T. D. Mateescu, and N. Cherecheș. 2016. “Efficiency Improvement of Photovoltaic Panels by Using Air Cooled Heat Sinks.” Energy Procedia 85: 425–432.
- Radwan, A., S. Ookawara, and M. Ahmed. 2016. “Analysis and Simulation of Concentrating Photovoltaic Systems with a Microchannel Heat Sink.” Solar Energy 136: 35–48.
- Sainthiya, H., N. S. Beniwal, and N. Garg. 2018. “Efficiency Improvement of a Photovoltaic Module Using Front Surface Cooling Method in Summer and Winter Conditions.” ASME Journal of Solar Energy Engineering 140: 1–7, 061009.
- Saxena, A., N. Agarwal, and E. Cuce. 2020. “Thermal Performance Evaluation of a Solar air Heater Integrated with Helical Tubes Carrying Phase Change Material.” Journal of Energy Storage 30: 101406.
- Saxena, A., N. Agarwal, and G. Srivastava. 2013. “Design and Thermal Performance of a Solar Air Heater with Long Term Heat Storage.” International Journal of Heat and Mass Transfer 60: 8–16.
- Saxena, A., and N. Deval. 2016. “A High Rated Solar Water Distillation Unit for Solar Homes.” Journal of Engineering 2016: 1–8.
- Saxena, A., and B. Norton. 2021. “Adoption Potential, Thermal Engineering and Economic Viability of Solar Water Heating Systems.” In Solar Water Heating – Fundamentals and Applications, 21–58. New York: Nova Science.
- Saxena, A., and G. Srivastava. 2012. “Potential and Economics of Solar Water Heating.” MIT International Journal of Mechanical Engineering 2 (2): 97–104.
- Saxena, A., and G. Srivastava. 2013. “Performance Studies of a Multipurpose Solar Energy System for Remote Areas.” MIT International Journal of Mechanical Engineering 3: 21–33.
- Saxena, A., Varun, and A. A. El-Sebaii. 2015. “A Thermodynamic Review of Solar Air Heaters.” Renewable and Sustainable Energy Reviews 43: 863–890.
- Saxena, A., Varun, S. P. Pandey, and G. Srivastava. 2011. “A Thermodynamic Review on Solar Box Type Cookers.” Renewable and Sustainable Energy Reviews 15: 3301–3318.
- Schiro, F., A. Benato, A. Stoppato, and N. Destro. 2017. “Improving Photovoltaics Efficiency by Water Cooling: Modeling and Experimental Approach.” Energy 137: 798–810.
- Siahkamari, L., M. Rahimi, N. Azimi, and M. Banibayat. 2019. “Experimental Investigation on Using a Novel Phase Change Material (PCM) in Micro Structure Photovoltaic Cooling System.” International Communications in Heat and Mass Transfer 100: 60–66.
- Silakhori, M., M. S. Naghavi, H. S. C. Metselaar, T. M. I. Mahlia, H. Fauzi, and M. Mehrali. 2013. “Accelerated Thermal Cycling Test of Microencapsulated Paraffin Wax/Polyaniline Made by Simple Preparation Method for Solar Thermal Energy Storage.” Materials 6: 1608–1620.
- Siyabi, I. A., K. Shanksa, T. Mallick, and S. Sundaram. 2020. “Indoor and Outdoor Characterization of Concentrating Photovoltaic Attached to Multi-Layered Micro Channel Heat Sink.” Solar Energy 202: 55–72.
- Smith, M. K., H. Selbak, C. C. Wamser, N. U. Day, M. Krieske, D. J. Sailor, and T. N. Rosenstiel. 2014. “Water Cooling Method to Improve the Performance of Field-Mounted, Insulated, and Concentrating Photovoltaic Modules.” ASME Journal of Journal of Solar Energy Engineering 136: 1–4, 034503.
- Soliman, A. M. A., H. Hassan, and S. Ookawara. 2019. “An Experimental Study of the Performance of the Solar Cell with Heat Sink Cooling System.” Energy Procedia 162: 127–135.
- Stropnik, R., and U. Stritih. 2016. “Increasing the Efficiency of PV Panel with the use of PCM.” Renewable Energy 97: 671–679.
- Teo, H. G., P. S. Lee, and M. N. A. Hawlader. 2012. “An Active Cooling System for Photovoltaic Modules.” Applied Energy 90: 309–315.
- Tiwari, G. N., and S. Dubey. 2010. Fundamentals of Photovoltaic Modules and Their Applications. Royal Society of Chemistry, U.K.
- Waqasa, A., and J. Ji. 2017. “Thermal Management of Conventional PV Panel Using PCM with Movable Shutters – A Numerical Study.” Solar Energy 158: 797–807.
- Wu, S., C. Chen, and L. Xiao. 2018. “Heat Transfer Characteristics and Performance Evaluation of Water-Cooled PV/T System with Cooling Channel Above PV Panel.” Renewable Energy 125: 936–946.
- Wu, Shenyi, and Chenguang Xiong. 2014. “Passive Cooling Technology for Photovoltaic Panels for Domestic Houses.” International Journal of Low-Carbon Technologies 9: 118–126.
- Zhao, J., T. Ma, Z. Li, and A. Song. 2019. “Year-Round Performance Analysis of a Photovoltaic Panel Coupled with Phase Change Material.” Applied Energy 245: 51–64.